
Zhuang Ma, Xiaoyan Zhou, Lin Zhang, "Phase regimes of parity-time-symmetric coupled-ring systems at exceptional points," Photonics Res. 10, 2374 (2022)
- Photonics Research
- Vol. 10, Issue 10, 2374 (2022)
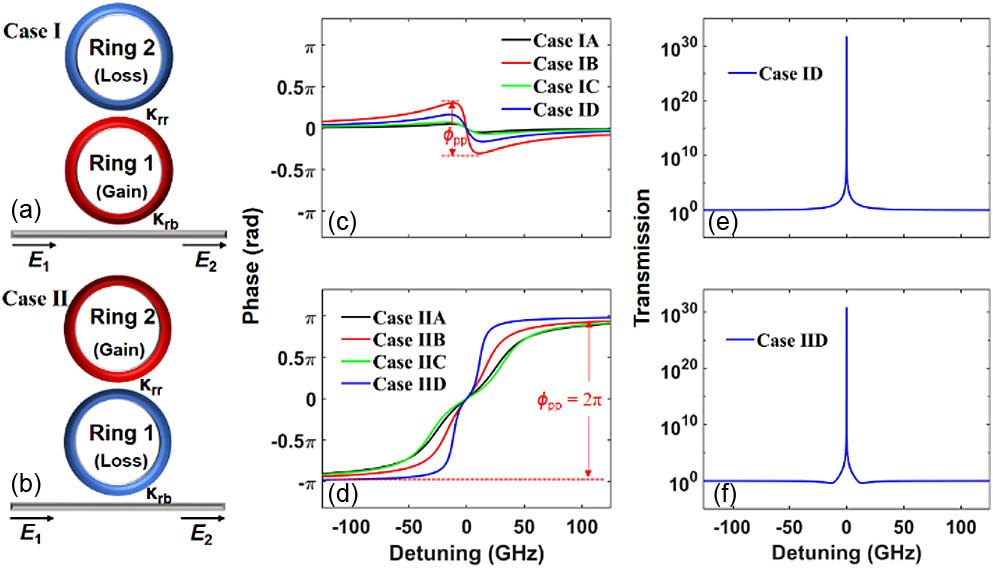
Fig. 1. (a) and (b) Schematics of the PT-symmetric systems in Case I and Case II. (c) and (d) four phase responses of Case I and Case II. ϕ pp
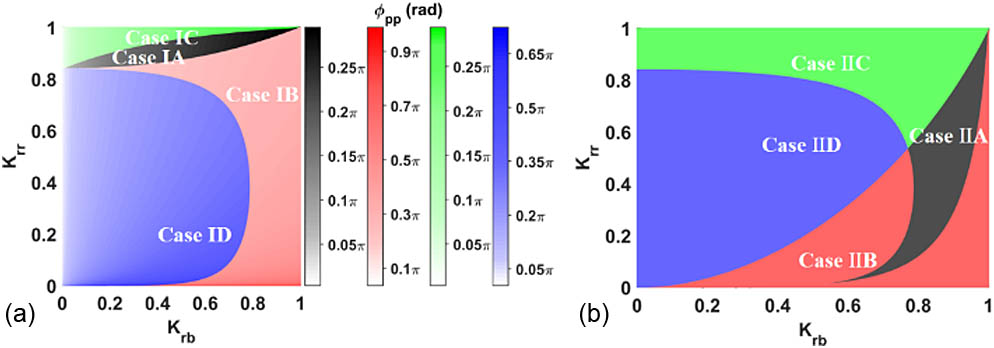
Fig. 2. ϕ pp
Fig. 3. (a) and (b) show d ψ / d ω ψ d ψ / d ω ψ
Fig. 4. When the gain of Ring 1 in Case I and Ring 2 in Case II increases by 1% compared with g th Q 1 (c) and 1 (d).
Fig. 5. When the gain of Ring 1 in Case I and Ring 2 in Case II increases by 1% compared with g th
| |||||||||||||||||||||||||||||||||||
Table 1. Coupling-Coefficient Combinations for Case I and Case II


Set citation alerts for the article
Please enter your email address

© Copyright 2018-2021 | Chinese Laser Press. All Rights Reserved 沪ICP备15018463号-20