Journals > > Topics > Spectroscopy
Spectroscopy|865 Article(s)

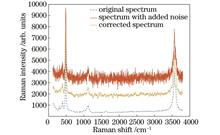
Spatial Heterodyne Raman Spectral Baseline Correction Based on Improved Adaptive Iterative Re-Weighted Penalized Least Square Method
Yunfei Bai, Haiyan Luo, Zhiwei Li, Yi Ding, and Wei Xiong
ObjectiveRaman spectroscopy is a non-destructive analytical technique based on the inelastic scattering of light by matter. While inducing Raman signals, the fluorescence background directly affects the characterization of sample Raman properties. The common approaches to reducing fluorescence background are primarily implemented through hardware and software methods. Hardware methods mainly involve techniques such as shifted excitation Raman difference spectroscopy, time-resolved Raman spectroscopy, and deep ultraviolet Raman spectroscopy. Although these methods exhibit effective outcomes, they often entail complex instrument setups and high costs. Software methods, on the other hand, refer to utilizing signal processing techniques to subtract fluorescence background from Raman spectra. Raman spectra are characterized by typically discontinuous with sharp peaks, contrasted with the continuous and smooth trends often present in fluorescence spectra. Given the difference in their spectral characteristics, when Raman spectroscopy analysis is carried out, employing baseline correction algorithms to eliminate fluorescence interference helps ensure the reliability and accuracy of Raman spectroscopy data. Common methods for mitigating fluorescence background include polynomial fitting, discrete wavelet transform, morphological algorithms, variational mode decomposition, least squares methods, and neural networks. However, due to the presence of Raman peaks, these methods typically result in varying degrees of baseline rise in the fitting outcomes. In the present study, we report an adaptive iterative re-weighted penalized least square (airPLS) method based on Raman peaks truncation. By identifying the positions of Raman peaks, truncating the corresponding regions, and employing the airPLS algorithm for baseline fitting, the method reduces the rise in the fitted baseline caused by abrupt changes in intensity within the Raman peak regions, making the fitted baseline approach closer to the true baseline. We hope that this improved method will further enhance the accuracy of Raman spectroscopy baseline fitting.MethodsBaseline fitting is conducted with airPLS based on Raman peaks truncation. Initially, the spectral signal is denoised by the Savitzky-Golay filter. Subsequently, we employ a peak-finding algorithm to identify Raman peaks within the denoised spectrum and use the first derivative of the spectrum to determine the left and right boundaries for each Raman peak. Following this, we truncate the Raman peaks within these defined boundaries to obtain the original baseline. An airPLS fitting is performed on this original baseline to derive a new baseline. At this stage, we compute the difference between the new baseline and the original baseline and truncate the regions where the absolute difference exceeds a threshold. We iterate this process by subjecting the truncated signal to successive airPLS fitting until the absolute difference between the baselines from two consecutive fittings is less than the threshold, concluding the iteration. The resulting fitted baseline is output. Here, the threshold represents the average of the absolute differences between the baselines from two consecutive fittings. Subtracting the fitted baseline from the original Raman spectrum yields the corrected Raman spectrum.Results and DiscussionsThe airPLS based on Raman peaks truncation has demonstrated outstanding performance in baseline fitting. Simulated Raman spectra and measured Raman spectra from lipstick are utilized to validate the proposed baseline fitting method, respectively. Comparative analyses are conducted against commonly used baseline fitting methods, including polynomial fitting, discrete wavelet transform, variational mode decomposition, and airPLS. As depicted in Figs. 6(a), 7(a), and 7(b), although the algorithm proposed in this article achieves a baseline fit closer to the theoretical baseline in regions with weak Raman peaks or without Raman peaks, the improvement compared to the aforementioned algorithms is not notably conspicuous. This indicates that the fitting capabilities of these algorithms are similar in spectra exhibiting gradual trends. However, near the Raman peak regions, as shown in Figs. 6(b), 6(c), and 7(c), these methods experience baseline elevation due to abrupt changes in spectral peak intensity. In contrast, the proposed baseline fitting method, which incorporates Raman peaks truncation, minimizes the influence of Raman peaks on the fitting results, resulting in the closest fit to the theoretical values. Table 3 presents the root mean square errors (RMSE) between the fitted baseline and the theoretical baseline for our method and the aforementioned commonly used methods, evaluating the performance of these methods in spectra exhibiting both single and complex trends. Comparative analysis indicates that under various signal-to-noise ratios of spectra, our method yields the lowest RMSE, showcasing its superior performance. The baseline fitting results of the lipstick Raman spectrum shown in Fig. 8 are consistent with the simulated analysis outcomes. In the region devoid of Raman peaks (800-1000 cm-1), the baseline fitting capabilities of each algorithm are similar. However, within the region with numerous Raman peaks (1100 to 1650 cm-1), the baseline fits of all algorithms are affected to varying degrees by the spectral peaks, resulting in baseline rises. Our baseline fitting method, employing spectral peak truncation and an iterative approach, significantly mitigates the influence of spectral peaks on the fitting outcomes. This method maximizes the preservation of Raman peak intensities and stands out as the optimal choice among the various methods evaluated.ConclusionsWe introduce the Raman peak-truncated airPLS baseline fitting method. The utilization of Raman peak truncation mitigates the influence of abrupt changes in Raman peak intensity on baseline fitting. The method not only inherits the effective baseline fitting performance of airPLS in peak-free regions but also resolves the issue of baseline elevation caused by Raman peak intensity, thereby enhancing the accuracy of baseline fitting. Comparative experiments conducted on simulated spectra demonstrate the superior baseline fitting performance of Raman peak-truncated airPLS. Under different spectral signal-to-noise ratios, the RMSE for Type 1 spectra fitted by our method is below 0.0042, and for Type 2 spectra, it is below 0.0052, which is the lowest among various methods. In experiments fitting Raman spectra from lipstick samples, airPLS based on Raman peaks truncation outperforms several commonly used algorithms. It accurately restores Raman peak intensities without distorting the corrected spectra, effectively removing fluorescence baseline trends and meeting the requirements of Raman spectroscopy data processing. ObjectiveRaman spectroscopy is a non-destructive analytical technique based on the inelastic scattering of light by matter. While inducing Raman signals, the fluorescence background directly affects the characterization of sample Raman properties. The common approaches to reducing fluorescence background are primarily implemented through hardware and software methods. Hardware methods mainly involve techniques such as shifted excitation Raman difference spectroscopy, time-resolved Raman spectroscopy, and deep ultraviolet Raman spectroscopy. Although these methods exhibit effective outcomes, they often entail complex instrument setups and high costs. Software methods, on the other hand, refer to utilizing signal processing techniques to subtract fluorescence background from Raman spectra. Raman spectra are characterized by typically discontinuous with sharp peaks, contrasted with the continuous and smooth trends often present in fluorescence spectra. Given the difference in their spectral characteristics, when Raman spectroscopy analysis is carried out, employing baseline correction algorithms to eliminate fluorescence interference helps ensure the reliability and accuracy of Raman spectroscopy data. Common methods for mitigating fluorescence background include polynomial fitting, discrete wavelet transform, morphological algorithms, variational mode decomposition, least squares methods, and neural networks. However, due to the presence of Raman peaks, these methods typically result in varying degrees of baseline rise in the fitting outcomes. In the present study, we report an adaptive iterative re-weighted penalized least square (airPLS) method based on Raman peaks truncation. By identifying the positions of Raman peaks, truncating the corresponding regions, and employing the airPLS algorithm for baseline fitting, the method reduces the rise in the fitted baseline caused by abrupt changes in intensity within the Raman peak regions, making the fitted baseline approach closer to the true baseline. We hope that this improved method will further enhance the accuracy of Raman spectroscopy baseline fitting.MethodsBaseline fitting is conducted with airPLS based on Raman peaks truncation. Initially, the spectral signal is denoised by the Savitzky-Golay filter. Subsequently, we employ a peak-finding algorithm to identify Raman peaks within the denoised spectrum and use the first derivative of the spectrum to determine the left and right boundaries for each Raman peak. Following this, we truncate the Raman peaks within these defined boundaries to obtain the original baseline. An airPLS fitting is performed on this original baseline to derive a new baseline. At this stage, we compute the difference between the new baseline and the original baseline and truncate the regions where the absolute difference exceeds a threshold. We iterate this process by subjecting the truncated signal to successive airPLS fitting until the absolute difference between the baselines from two consecutive fittings is less than the threshold, concluding the iteration. The resulting fitted baseline is output. Here, the threshold represents the average of the absolute differences between the baselines from two consecutive fittings. Subtracting the fitted baseline from the original Raman spectrum yields the corrected Raman spectrum.Results and DiscussionsThe airPLS based on Raman peaks truncation has demonstrated outstanding performance in baseline fitting. Simulated Raman spectra and measured Raman spectra from lipstick are utilized to validate the proposed baseline fitting method, respectively. Comparative analyses are conducted against commonly used baseline fitting methods, including polynomial fitting, discrete wavelet transform, variational mode decomposition, and airPLS. As depicted in Figs. 6(a), 7(a), and 7(b), although the algorithm proposed in this article achieves a baseline fit closer to the theoretical baseline in regions with weak Raman peaks or without Raman peaks, the improvement compared to the aforementioned algorithms is not notably conspicuous. This indicates that the fitting capabilities of these algorithms are similar in spectra exhibiting gradual trends. However, near the Raman peak regions, as shown in Figs. 6(b), 6(c), and 7(c), these methods experience baseline elevation due to abrupt changes in spectral peak intensity. In contrast, the proposed baseline fitting method, which incorporates Raman peaks truncation, minimizes the influence of Raman peaks on the fitting results, resulting in the closest fit to the theoretical values. Table 3 presents the root mean square errors (RMSE) between the fitted baseline and the theoretical baseline for our method and the aforementioned commonly used methods, evaluating the performance of these methods in spectra exhibiting both single and complex trends. Comparative analysis indicates that under various signal-to-noise ratios of spectra, our method yields the lowest RMSE, showcasing its superior performance. The baseline fitting results of the lipstick Raman spectrum shown in Fig. 8 are consistent with the simulated analysis outcomes. In the region devoid of Raman peaks (800-1000 cm-1), the baseline fitting capabilities of each algorithm are similar. However, within the region with numerous Raman peaks (1100 to 1650 cm-1), the baseline fits of all algorithms are affected to varying degrees by the spectral peaks, resulting in baseline rises. Our baseline fitting method, employing spectral peak truncation and an iterative approach, significantly mitigates the influence of spectral peaks on the fitting outcomes. This method maximizes the preservation of Raman peak intensities and stands out as the optimal choice among the various methods evaluated.ConclusionsWe introduce the Raman peak-truncated airPLS baseline fitting method. The utilization of Raman peak truncation mitigates the influence of abrupt changes in Raman peak intensity on baseline fitting. The method not only inherits the effective baseline fitting performance of airPLS in peak-free regions but also resolves the issue of baseline elevation caused by Raman peak intensity, thereby enhancing the accuracy of baseline fitting. Comparative experiments conducted on simulated spectra demonstrate the superior baseline fitting performance of Raman peak-truncated airPLS. Under different spectral signal-to-noise ratios, the RMSE for Type 1 spectra fitted by our method is below 0.0042, and for Type 2 spectra, it is below 0.0052, which is the lowest among various methods. In experiments fitting Raman spectra from lipstick samples, airPLS based on Raman peaks truncation outperforms several commonly used algorithms. It accurately restores Raman peak intensities without distorting the corrected spectra, effectively removing fluorescence baseline trends and meeting the requirements of Raman spectroscopy data processing.
Acta Optica Sinica
- Publication Date: Apr. 10, 2024
- Vol. 44, Issue 7, 0730001 (2024)

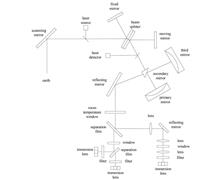
Measurement of Carbon Isotopes in Methane Based on Off-Axis Integrated Cavity Output Spectroscopy Technology with Booster Optical Amplifier
Runqing Yu, Hua Xia, Pengshuai Sun, Tao Pang, Bian Wu, and Zhirong Zhang
ObjectiveAs the main green energy, methane (CH4) has become increasingly important in human production and life. Meanwhile, as explosive and flammable harmful gas, it also causes significant problems such as production safety accidents and environmental pollution, it is particularly important to detect CH4 concentration in real time and online. Additionally, carbon isotopes in CH4 are also significant for environmental analysis of sources and sinks. Traditional isotope ratio measurement methods, such as mass spectrometry and gas chromatography, often require sample preprocessing and are difficult to achieve real-time online detection. At the same time, traditional absorption spectroscopy techniques often need large absorption cells and other devices to measure the gas isotopes, which results in difficult temperature and pressure control. We report a methane isotope measurement method based on off-axis integrated cavity output spectroscopy (OA-ICOS) technology, which eliminates residual mode noise in the measurement results by adding an RF white noise source and further expands the optical power of the incident laser using booster optical amplifier (BOA) to increase the effective optical path length of the measurement results. We hope our method can further reduce the minimum detection limit and provide solid theoretical and technical support for future measurement of isotope ratio changes in CH4 under atmospheric background concentration.MethodsWe establish a system for carbon isotope detection in CH4 based on OA-ICOS technology (Fig. 3), and the laser output laser changes the angle and position of the incident into the integration cavity through the fiber collimator fixed on the five-dimensional adjustment frame. Meanwhile, the outgoing light after multiple reflections is formed in the cavity by the lens to converge on the photosensitive surface of the detector, and the detector converts the collected integrated light signal for photoelectric conversion. The detected electrical signal is converted analog-to-digital via the data acquisition card and uploaded to the computer software by the USB serial port to realize gas concentration measurement. The opening ratio of the needle valve and the pumping speed of the vacuum pump are changed in the experiment to control the flow rate of the outlet end and thus ensure the measured pressure stability. Additionally, the mass flow controller is adopted to adjust the flow rate of the inlet in real time to realize the pressure control in the cavity. Radio frequency (RF) white noise is loaded on the current drive of the laser in the experiment and the laser linewidth is further widened, with eliminated remaining mode noise and improved signal-to-noise ratio (SNR) of the measurement results, which aims to minimize the mode noise interference in the cavity and improve the SNR of the measurement results. Additionally, to further improve the effective optical path length of the system and the signal-to-noise ratio of the measurement, we amplify the output power by adding a BOA after laser, after which the absorbance measured is greatly improved.Results and DiscussionsWhen the RF white noise power is greater than -30 dBm, the residual mode noise in the cavity is eliminated. When the RF white noise power is greater than -20 dBm, the absorption peak shows a significant decrease with the broadening linewidth (Fig. 5). Thus, the RF white noise with -30 dBm is adopted in the experiment. Meanwhile, the rising current of BOA leads to a significantly increasing absorption peak (Fig. 6) and effective optical path length. When the drive current is greater than 400 mA, the effective optical path length of the system at this time is approximately 6000 m, which increases by approximately 1.22 times. The SNR increase of 12CH4 is 1.16 times and of 13CH4 is 1.18 times, which is consistent with the rise in effective optical path length (Fig. 6). By employing the carbon isotope standard value given by NBS-20 [Rstandard (13C/12C)=0.0112253] as the standard value for calculating the isotope ratio changes, δ(13C) in the CH4 standard gas with a volume fraction of 494.14×10⁻⁶ and a volume fraction of 5.55×10⁻⁶ at a volume fraction of 13CH4 is continuously measured for 1 h, and the measurement results are shown in Fig. 8(a). To further analyze the stability and detection limit of the measurement system, we perform the Allan variance analysis of the measured δ(13C), with the results shown in Fig. 8(b). The analysis results indicate that the limit of detection (LoD) is 4.57‰ when the average time is 1 s, and its LoD decreases to 0.567‰ when the average measurement time increases to 663 s, at which time the detection accuracy of the system can be further improved by increasing the average time.ConclusionsTo realize the real-time measurement of the change of stable carbon isotope ratio in CH4, we establish a high-precision δ(13C) measurement system based on OA-ICOS technology. Meanwhile, for further improving the measured effective optical path length and reducing the measurement limit, we add the BOA behind the laser output to enhance the output laser power, increase the effective optical path length of the system from about 2700 m to about 6000 m, an increase of about 1.22 times, and increase the SNR of 12CH4 and 13CH4 by 1.16 times and 1.18 times respectively. By leveraging the gas distribution instrument, the system is calibrated by high-purity N2 and CH4 with a volume fraction of 5008×10-6 to configure different volume fractions of sample gases, and the calibration curve is obtained by fitting the relationship between the gas volume fraction and the absorption spectrum peak, with the volume fraction inverted by the calibration curve. After performing the stability test of CH4 with a volume fraction of 500×10-6 for 1 hour, Allan variance analysis shows that the minimum variance of the system stability for δ(13C) measurement in CH4 is 0.567‰. The utilization of this system can improve the SNR and reduce the minimum LoD to achieve long-term stable measurement of δ(13C) in CH4. Additionally, by further improving the stability of the optomechanical structure, reducing system noise, and increasing the effective optical path length, the minimum detection limit can be further reduced. Finally, solid theoretical and technical support can be provided for future measurement of methane-stabilized carbon isotope characteristic values at atmospheric background concentrations. ObjectiveAs the main green energy, methane (CH4) has become increasingly important in human production and life. Meanwhile, as explosive and flammable harmful gas, it also causes significant problems such as production safety accidents and environmental pollution, it is particularly important to detect CH4 concentration in real time and online. Additionally, carbon isotopes in CH4 are also significant for environmental analysis of sources and sinks. Traditional isotope ratio measurement methods, such as mass spectrometry and gas chromatography, often require sample preprocessing and are difficult to achieve real-time online detection. At the same time, traditional absorption spectroscopy techniques often need large absorption cells and other devices to measure the gas isotopes, which results in difficult temperature and pressure control. We report a methane isotope measurement method based on off-axis integrated cavity output spectroscopy (OA-ICOS) technology, which eliminates residual mode noise in the measurement results by adding an RF white noise source and further expands the optical power of the incident laser using booster optical amplifier (BOA) to increase the effective optical path length of the measurement results. We hope our method can further reduce the minimum detection limit and provide solid theoretical and technical support for future measurement of isotope ratio changes in CH4 under atmospheric background concentration.MethodsWe establish a system for carbon isotope detection in CH4 based on OA-ICOS technology (Fig. 3), and the laser output laser changes the angle and position of the incident into the integration cavity through the fiber collimator fixed on the five-dimensional adjustment frame. Meanwhile, the outgoing light after multiple reflections is formed in the cavity by the lens to converge on the photosensitive surface of the detector, and the detector converts the collected integrated light signal for photoelectric conversion. The detected electrical signal is converted analog-to-digital via the data acquisition card and uploaded to the computer software by the USB serial port to realize gas concentration measurement. The opening ratio of the needle valve and the pumping speed of the vacuum pump are changed in the experiment to control the flow rate of the outlet end and thus ensure the measured pressure stability. Additionally, the mass flow controller is adopted to adjust the flow rate of the inlet in real time to realize the pressure control in the cavity. Radio frequency (RF) white noise is loaded on the current drive of the laser in the experiment and the laser linewidth is further widened, with eliminated remaining mode noise and improved signal-to-noise ratio (SNR) of the measurement results, which aims to minimize the mode noise interference in the cavity and improve the SNR of the measurement results. Additionally, to further improve the effective optical path length of the system and the signal-to-noise ratio of the measurement, we amplify the output power by adding a BOA after laser, after which the absorbance measured is greatly improved.Results and DiscussionsWhen the RF white noise power is greater than -30 dBm, the residual mode noise in the cavity is eliminated. When the RF white noise power is greater than -20 dBm, the absorption peak shows a significant decrease with the broadening linewidth (Fig. 5). Thus, the RF white noise with -30 dBm is adopted in the experiment. Meanwhile, the rising current of BOA leads to a significantly increasing absorption peak (Fig. 6) and effective optical path length. When the drive current is greater than 400 mA, the effective optical path length of the system at this time is approximately 6000 m, which increases by approximately 1.22 times. The SNR increase of 12CH4 is 1.16 times and of 13CH4 is 1.18 times, which is consistent with the rise in effective optical path length (Fig. 6). By employing the carbon isotope standard value given by NBS-20 [Rstandard (13C/12C)=0.0112253] as the standard value for calculating the isotope ratio changes, δ(13C) in the CH4 standard gas with a volume fraction of 494.14×10⁻⁶ and a volume fraction of 5.55×10⁻⁶ at a volume fraction of 13CH4 is continuously measured for 1 h, and the measurement results are shown in Fig. 8(a). To further analyze the stability and detection limit of the measurement system, we perform the Allan variance analysis of the measured δ(13C), with the results shown in Fig. 8(b). The analysis results indicate that the limit of detection (LoD) is 4.57‰ when the average time is 1 s, and its LoD decreases to 0.567‰ when the average measurement time increases to 663 s, at which time the detection accuracy of the system can be further improved by increasing the average time.ConclusionsTo realize the real-time measurement of the change of stable carbon isotope ratio in CH4, we establish a high-precision δ(13C) measurement system based on OA-ICOS technology. Meanwhile, for further improving the measured effective optical path length and reducing the measurement limit, we add the BOA behind the laser output to enhance the output laser power, increase the effective optical path length of the system from about 2700 m to about 6000 m, an increase of about 1.22 times, and increase the SNR of 12CH4 and 13CH4 by 1.16 times and 1.18 times respectively. By leveraging the gas distribution instrument, the system is calibrated by high-purity N2 and CH4 with a volume fraction of 5008×10-6 to configure different volume fractions of sample gases, and the calibration curve is obtained by fitting the relationship between the gas volume fraction and the absorption spectrum peak, with the volume fraction inverted by the calibration curve. After performing the stability test of CH4 with a volume fraction of 500×10-6 for 1 hour, Allan variance analysis shows that the minimum variance of the system stability for δ(13C) measurement in CH4 is 0.567‰. The utilization of this system can improve the SNR and reduce the minimum LoD to achieve long-term stable measurement of δ(13C) in CH4. Additionally, by further improving the stability of the optomechanical structure, reducing system noise, and increasing the effective optical path length, the minimum detection limit can be further reduced. Finally, solid theoretical and technical support can be provided for future measurement of methane-stabilized carbon isotope characteristic values at atmospheric background concentrations.
Acta Optica Sinica
- Publication Date: Mar. 10, 2024
- Vol. 44, Issue 5, 0530001 (2024)
Prediction Model and Experimental Verification of Reflective Spectra of Responsive Colloidal Crystals
Jinying Zhang, Xinye Wang, Yulin Si, Bingnan Wang, Jiaxing Yang, and Yexiaotong Zhang
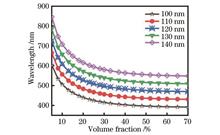
ObjectiveThe formation mechanism of colors can be divided into two types: chemical color and structural color. Structural color, also known as physical color, is a visual effect produced by the interaction between light and the microstructure inside the material. Compared with chemical colors, structural colors have been widely studied and paid attention to by researchers due to their advantages such as resistance to photobleaching, low-temperature sensitivity, and low pollution. Tunable structural colors have good application prospects in dynamic displays, optical camouflage, and other fields, becoming a research hotspot that researchers are committed to breaking through. Self-assembled technology is an important means to achieve the structural color of photonic crystals, which is achieved by assembling monodisperse organic or inorganic particles into ordered colloidal crystals to obtain the structural color in the visible light region. Responsive photonic crystals adjust the structural color by changing the lattice spacing of photonic crystals. This method has the advantages of convenient tuning and wide tuning range and has achieved many distinctive application effects in experiments. Researchers usually prepare particles of various sizes and then test the structural colors to select particles of appropriate sizes. Although good experimental results have been achieved, this method of particle selection somewhat lacks guidance and is time-consuming and labor-intensive. A high-precision theoretical prediction model is required to guide the design of particle material and structural parameters, as well as the optimization range of tunable range.MethodsAfter summarizing typical experimental measurement data and theoretical calculation data of self-assembled structural colors that have been reported, we compare and analyze the errors between the measured and calculated results. We propose a finite element method prediction model based on face centered cubic three-dimensional photonic crystals. In addition, we study the effects of parameters such as the refractive index of nanoparticles, solvent refractive index, particle diameter, and particle spacing on reflection spectra. Based on the predicted model, Fe3O4@SiO2 nanoparticles of optimized size and an electrically-tuned device are prepared. The central wavelength of the reflection spectrum of the device is tested and compared with the finite element method prediction model for verification.Results and DiscussionsThe calculation results of the finite element method prediction model indicate that the central wavelength of the reflection spectrum of photonic crystals red-shifts with the increase in particle refractive index and solvent refractive index. Compared with the refractive index of nanoparticles, the influence of solvent refractive index is more significant (Fig. 4). The central wavelength of the reflection spectrum of photonic crystals will red-shift with the increase in particle size (Fig. 5). The tuning range of the central wavelength of the reflection spectrum is mainly contributed by changes in longitudinal spacing, while changes in transverse spacing have a negative effect (Fig. 7). Optimized parameters are obtained by the prediction model. Nanoparticles of the optimized parameters are experimentally prepared. The tested results are well consistent with the prediction, indicating that the central wavelength of the reflection spectrum shifts in the range of 680 nm to 455 nm (Fig. 11). Compared with the analytical prediction model, our three-dimensional finite element method prediction model has higher accuracy in predicting the central wavelength of the reflection spectrum. For mono-core shell structures, the prediction error ranges of the two models are 0.49%-1.70% and 0.82%-1.49%, respectively, showing comparable performance. For core-shell structures, the prediction error ranges of the two models are 3.51%-6.11% and 0.28%-1.34%, respectively. Our three-dimensional finite element method prediction model reduces the typical prediction error value to 1/5.9 of the original value (Table 2).ConclusionsWe propose a finite element method prediction model for predicting the dynamic tuning characteristics of reflection spectra of self-assembled photonic crystal structures in colloidal systems. Based on this model, we calculate and analyze the effects of material and structural parameters on the tuning characteristics of the reflection spectrum. A set of self-assembled photonic crystals that can cover the entire visible spectral range are designed and optimized for material and structural parameters. Fe3O4@SiO2 nanoparticles are synthesized with this optimized parameter as the target, and sandwich-structure color-changing samples are prepared. The tested results are consistent with that of the finite element method prediction model in terms of the central wavelength of the reflection spectrum. Experiments show that the finite element method prediction model can accurately predict the central wavelength of the reflection spectrum of self-assembled photonic crystals in colloidal systems. The model is simple with a wide range of applications, and the typical value of prediction error is reduced to 1/5.9 of the original value. The prediction strategy based on this finite element method prediction model helps to avoid the blind synthesis of nanoparticles, shorten the development cycle, and obtain the optimal filling coefficient to ensure the implementation of a large tuning range. The improvement research of prediction models should also focus on two aspects. 1) The self-assembled photonic crystal structure in colloidal systems may have the characteristics of short-range order and long-range disorder, allowing it to obtain very little change in reflection color at different incident angles. Therefore, finite element method models with higher accuracy prediction ability should also consider introducing perturbation variables into the crystal structure sequence, to obtain a high matching degree of the central wavelength, amplitude, and spectral width of the reflection spectrum between the prepared sample and the theoretical model at different incident angles. 2) The structural perfection and size consistency of synthesized nanoparticles need to be further improved to achieve high matching with theoretical models. The color display of high contrast also requires the nanoparticles to have better ball shape and homogeneous size. ObjectiveThe formation mechanism of colors can be divided into two types: chemical color and structural color. Structural color, also known as physical color, is a visual effect produced by the interaction between light and the microstructure inside the material. Compared with chemical colors, structural colors have been widely studied and paid attention to by researchers due to their advantages such as resistance to photobleaching, low-temperature sensitivity, and low pollution. Tunable structural colors have good application prospects in dynamic displays, optical camouflage, and other fields, becoming a research hotspot that researchers are committed to breaking through. Self-assembled technology is an important means to achieve the structural color of photonic crystals, which is achieved by assembling monodisperse organic or inorganic particles into ordered colloidal crystals to obtain the structural color in the visible light region. Responsive photonic crystals adjust the structural color by changing the lattice spacing of photonic crystals. This method has the advantages of convenient tuning and wide tuning range and has achieved many distinctive application effects in experiments. Researchers usually prepare particles of various sizes and then test the structural colors to select particles of appropriate sizes. Although good experimental results have been achieved, this method of particle selection somewhat lacks guidance and is time-consuming and labor-intensive. A high-precision theoretical prediction model is required to guide the design of particle material and structural parameters, as well as the optimization range of tunable range.MethodsAfter summarizing typical experimental measurement data and theoretical calculation data of self-assembled structural colors that have been reported, we compare and analyze the errors between the measured and calculated results. We propose a finite element method prediction model based on face centered cubic three-dimensional photonic crystals. In addition, we study the effects of parameters such as the refractive index of nanoparticles, solvent refractive index, particle diameter, and particle spacing on reflection spectra. Based on the predicted model, Fe3O4@SiO2 nanoparticles of optimized size and an electrically-tuned device are prepared. The central wavelength of the reflection spectrum of the device is tested and compared with the finite element method prediction model for verification.Results and DiscussionsThe calculation results of the finite element method prediction model indicate that the central wavelength of the reflection spectrum of photonic crystals red-shifts with the increase in particle refractive index and solvent refractive index. Compared with the refractive index of nanoparticles, the influence of solvent refractive index is more significant (Fig. 4). The central wavelength of the reflection spectrum of photonic crystals will red-shift with the increase in particle size (Fig. 5). The tuning range of the central wavelength of the reflection spectrum is mainly contributed by changes in longitudinal spacing, while changes in transverse spacing have a negative effect (Fig. 7). Optimized parameters are obtained by the prediction model. Nanoparticles of the optimized parameters are experimentally prepared. The tested results are well consistent with the prediction, indicating that the central wavelength of the reflection spectrum shifts in the range of 680 nm to 455 nm (Fig. 11). Compared with the analytical prediction model, our three-dimensional finite element method prediction model has higher accuracy in predicting the central wavelength of the reflection spectrum. For mono-core shell structures, the prediction error ranges of the two models are 0.49%-1.70% and 0.82%-1.49%, respectively, showing comparable performance. For core-shell structures, the prediction error ranges of the two models are 3.51%-6.11% and 0.28%-1.34%, respectively. Our three-dimensional finite element method prediction model reduces the typical prediction error value to 1/5.9 of the original value (Table 2).ConclusionsWe propose a finite element method prediction model for predicting the dynamic tuning characteristics of reflection spectra of self-assembled photonic crystal structures in colloidal systems. Based on this model, we calculate and analyze the effects of material and structural parameters on the tuning characteristics of the reflection spectrum. A set of self-assembled photonic crystals that can cover the entire visible spectral range are designed and optimized for material and structural parameters. Fe3O4@SiO2 nanoparticles are synthesized with this optimized parameter as the target, and sandwich-structure color-changing samples are prepared. The tested results are consistent with that of the finite element method prediction model in terms of the central wavelength of the reflection spectrum. Experiments show that the finite element method prediction model can accurately predict the central wavelength of the reflection spectrum of self-assembled photonic crystals in colloidal systems. The model is simple with a wide range of applications, and the typical value of prediction error is reduced to 1/5.9 of the original value. The prediction strategy based on this finite element method prediction model helps to avoid the blind synthesis of nanoparticles, shorten the development cycle, and obtain the optimal filling coefficient to ensure the implementation of a large tuning range. The improvement research of prediction models should also focus on two aspects. 1) The self-assembled photonic crystal structure in colloidal systems may have the characteristics of short-range order and long-range disorder, allowing it to obtain very little change in reflection color at different incident angles. Therefore, finite element method models with higher accuracy prediction ability should also consider introducing perturbation variables into the crystal structure sequence, to obtain a high matching degree of the central wavelength, amplitude, and spectral width of the reflection spectrum between the prepared sample and the theoretical model at different incident angles. 2) The structural perfection and size consistency of synthesized nanoparticles need to be further improved to achieve high matching with theoretical models. The color display of high contrast also requires the nanoparticles to have better ball shape and homogeneous size.
Acta Optica Sinica
- Publication Date: Feb. 25, 2024
- Vol. 44, Issue 4, 0430001 (2024)
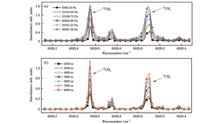
Application of Improved Symmetric Zero-Area Conversion Peak-Seeking Algorithm in Raman Spectroscopy
Hai Wang, Ning Huang, Ze He, Peng Wang, and Jingxi Yuan
ObjectiveRaman spectroscopy is an efficient and non-destructive analytical method for obtaining chemical information. The characteristic peaks in a Raman spectrum contain chemical information about the substance. The symmetric zero-area conversion is a commonly employed peak-seeking method. However, before peak seeking, various parameters related to the spectral line should be input, such as window width, Lorentz function half-width, and Gaussian function half-width. For different Raman spectra, these parameters to be input may be different, and if the input parameters do not match the current Raman spectrum, the obtained peak positions may be inaccurate. Currently, some open Raman databases only contain raw Raman spectral data without corresponding peak information. Preprocessing the raw spectral data and obtaining the corresponding peak positions and intensities by peak-seeking algorithms lead to better and more convenient utilization. Although the symmetric zero-area conversion method has advantages in automatic peak seeking and can obtain the intensity information corresponding to the spectral peaks, this peak-seeking algorithm requires various parameters related to the spectral data, such as window width, Lorentz function half-width, and Gaussian function half-width. Therefore, the universality of the symmetric zero-area conversion method is relatively limited during processing different Raman spectra in the database. We propose an improved symmetric zero-area method to reduce the input of parameters related to spectral data and adapt it to data with different spectral resolutions. We hope that this algorithm can automatically search peaks in batches for many raw Raman spectral data in the Raman database to generate a more concise and convenient database.MethodsThis algorithm improves the peak-seeking algorithm of symmetric zero-area conversion by combining noise reduction and baseline removal algorithms. First, the Whittaker Smoother algorithm is employed to remove noise from the raw Raman spectrum, which can quickly and easily remove noise without producing peak position shifts. Then, the asymmetrically weighted penalized least squares (arPLS) algorithm is utilized to remove the spectrum baseline. Next, we improve the symmetric zero-area method by normalizing the half-width of the Raman spectrum peaks, thus reducing the number of required input parameters and suppressing peak-seeking offsets. After peak seeking, the found peak positions are further corrected to reduce offsets and accurately locate peaks. Finally, the WALPSZ peak-seeking algorithm is formed by combining the Whittaker Smoother and arPLS. Additionally, the algorithm is leveraged to automatically search for peaks in ROD's raw Raman spectral data and adopted for experimental Raman spectral analysis of Anhydrite, Pyrite, and Moissanite. The obtained peak positions are compared with the literature's data to verify their reliability and universality for different Raman spectral data.Results and DiscussionsFirst, the traditional symmetric zero-area conversion method and the WALPSZ algorithm are applied to analyze the peak seeking of ROD's Calcite, Analcime, Bindheimite, and Brookite original spectral data. When utilizing the traditional symmetric zero-area peak-seeking algorithm with fixed parameters, it has the best peak-seeking effect on Calcite [Fig. 3(a)] and a better peak-seeking effect on Analcime, but there is a situation where a peak is searched twice at 1000-1500 cm-1 [Fig. 3(b)]. The peak seeking of Bindheimite shows an obvious peak-seeking offset and a situation where one peak is searched twice [Fig. 3(c)]. The peak seeking of Brookite exhibits a clear missing peak case [Fig. 3(d)]. By employing the WALPSZ peak-seeking algorithm, it maintains a sound peak-seeking effect on Calcite and solves the above inaccurate peak-seeking problems when facing other Raman spectra, which indicates that the WALPSZ peak-seeking algorithm has better universality. To further verify the universality and accuracy of the WALPSZ peak-seeking algorithm and explore whether the algorithm can still be applied in actual measured Raman spectra, Anhydrite, Pyrite, and Moissanite are prepared for Raman spectral measurement, and the WALPSZ peak-seeking algorithm is adopted for peak-seeking analysis (Fig. 12). The found peaks are compared with those found by the WALPSZ peak-seeking algorithm in the original spectral data of these three samples in ROD and RRUFF and literature data, and we find that these peaks can correspond to each other (Table 2).ConclusionsThe symmetric zero-area conversion method is improved by reducing the input parameters and then is combined with the Whittaker Smoother and arPLS baseline removal algorithm to form the WAPLSZ peak-seeking algorithm, which enhances its universality. The WAPLSZ peak-seeking algorithm is compared with the traditional symmetric zero-area conversion method and the peak-seeking results of other original Raman spectra of ROD by the WAPLSZ peak-seeking algorithm. The results show that reducing the input parameters makes this algorithm capable of automatically batch searching for spectral data in open Raman databases. Meanwhile, we employ the WALPSZ peak-seeking algorithm to obtain the peak positions of Anhydrite, Pyrite, and Moissanite in ROD and RRUFF's Raman spectra, obtain the peak positions of the measured Raman spectra of these samples by this algorithm, and compare them with the peak positions in literature. The results reveal that the WALPSZ peak-seeking algorithm is effective for automatically searching for peaks in measured Raman spectral data and original data in ROD and that the obtained peak positions can correspond to each other and are consistent with the data recorded in the literature. Then, the reliability and accuracy of the WALPSZ peak-seeking algorithm are verified for automatically searching for peaks in Raman original data. Finally, this algorithm can help establish a database of automatically searched peak positions in ROD and correspond to data recorded in literature to analyze chemical information from measured Raman spectra. ObjectiveRaman spectroscopy is an efficient and non-destructive analytical method for obtaining chemical information. The characteristic peaks in a Raman spectrum contain chemical information about the substance. The symmetric zero-area conversion is a commonly employed peak-seeking method. However, before peak seeking, various parameters related to the spectral line should be input, such as window width, Lorentz function half-width, and Gaussian function half-width. For different Raman spectra, these parameters to be input may be different, and if the input parameters do not match the current Raman spectrum, the obtained peak positions may be inaccurate. Currently, some open Raman databases only contain raw Raman spectral data without corresponding peak information. Preprocessing the raw spectral data and obtaining the corresponding peak positions and intensities by peak-seeking algorithms lead to better and more convenient utilization. Although the symmetric zero-area conversion method has advantages in automatic peak seeking and can obtain the intensity information corresponding to the spectral peaks, this peak-seeking algorithm requires various parameters related to the spectral data, such as window width, Lorentz function half-width, and Gaussian function half-width. Therefore, the universality of the symmetric zero-area conversion method is relatively limited during processing different Raman spectra in the database. We propose an improved symmetric zero-area method to reduce the input of parameters related to spectral data and adapt it to data with different spectral resolutions. We hope that this algorithm can automatically search peaks in batches for many raw Raman spectral data in the Raman database to generate a more concise and convenient database.MethodsThis algorithm improves the peak-seeking algorithm of symmetric zero-area conversion by combining noise reduction and baseline removal algorithms. First, the Whittaker Smoother algorithm is employed to remove noise from the raw Raman spectrum, which can quickly and easily remove noise without producing peak position shifts. Then, the asymmetrically weighted penalized least squares (arPLS) algorithm is utilized to remove the spectrum baseline. Next, we improve the symmetric zero-area method by normalizing the half-width of the Raman spectrum peaks, thus reducing the number of required input parameters and suppressing peak-seeking offsets. After peak seeking, the found peak positions are further corrected to reduce offsets and accurately locate peaks. Finally, the WALPSZ peak-seeking algorithm is formed by combining the Whittaker Smoother and arPLS. Additionally, the algorithm is leveraged to automatically search for peaks in ROD's raw Raman spectral data and adopted for experimental Raman spectral analysis of Anhydrite, Pyrite, and Moissanite. The obtained peak positions are compared with the literature's data to verify their reliability and universality for different Raman spectral data.Results and DiscussionsFirst, the traditional symmetric zero-area conversion method and the WALPSZ algorithm are applied to analyze the peak seeking of ROD's Calcite, Analcime, Bindheimite, and Brookite original spectral data. When utilizing the traditional symmetric zero-area peak-seeking algorithm with fixed parameters, it has the best peak-seeking effect on Calcite [Fig. 3(a)] and a better peak-seeking effect on Analcime, but there is a situation where a peak is searched twice at 1000-1500 cm-1 [Fig. 3(b)]. The peak seeking of Bindheimite shows an obvious peak-seeking offset and a situation where one peak is searched twice [Fig. 3(c)]. The peak seeking of Brookite exhibits a clear missing peak case [Fig. 3(d)]. By employing the WALPSZ peak-seeking algorithm, it maintains a sound peak-seeking effect on Calcite and solves the above inaccurate peak-seeking problems when facing other Raman spectra, which indicates that the WALPSZ peak-seeking algorithm has better universality. To further verify the universality and accuracy of the WALPSZ peak-seeking algorithm and explore whether the algorithm can still be applied in actual measured Raman spectra, Anhydrite, Pyrite, and Moissanite are prepared for Raman spectral measurement, and the WALPSZ peak-seeking algorithm is adopted for peak-seeking analysis (Fig. 12). The found peaks are compared with those found by the WALPSZ peak-seeking algorithm in the original spectral data of these three samples in ROD and RRUFF and literature data, and we find that these peaks can correspond to each other (Table 2).ConclusionsThe symmetric zero-area conversion method is improved by reducing the input parameters and then is combined with the Whittaker Smoother and arPLS baseline removal algorithm to form the WAPLSZ peak-seeking algorithm, which enhances its universality. The WAPLSZ peak-seeking algorithm is compared with the traditional symmetric zero-area conversion method and the peak-seeking results of other original Raman spectra of ROD by the WAPLSZ peak-seeking algorithm. The results show that reducing the input parameters makes this algorithm capable of automatically batch searching for spectral data in open Raman databases. Meanwhile, we employ the WALPSZ peak-seeking algorithm to obtain the peak positions of Anhydrite, Pyrite, and Moissanite in ROD and RRUFF's Raman spectra, obtain the peak positions of the measured Raman spectra of these samples by this algorithm, and compare them with the peak positions in literature. The results reveal that the WALPSZ peak-seeking algorithm is effective for automatically searching for peaks in measured Raman spectral data and original data in ROD and that the obtained peak positions can correspond to each other and are consistent with the data recorded in the literature. Then, the reliability and accuracy of the WALPSZ peak-seeking algorithm are verified for automatically searching for peaks in Raman original data. Finally, this algorithm can help establish a database of automatically searched peak positions in ROD and correspond to data recorded in literature to analyze chemical information from measured Raman spectra.
Acta Optica Sinica
- Publication Date: Feb. 10, 2024
- Vol. 44, Issue 3, 0330001 (2024)
Pre-Launch Spectral Calibration of FY-3F/HIRAS-Ⅱ
Chunyuan Shao, Mingjian Gu, Chengli Qi, Lu Li, Tianhang Yang, and Xing Chen
ObjectiveThe infrared Fourier spectrometer is based on interferometric spectroscopy, which features high spectral resolution and high sensitivity. Due to the ultra-fine spectral resolution of infrared hyperspectral atmospheric detection instruments, minor errors in spectral calibration can cause radiation measurement errors. High precision spectral calibration is an important prerequisite for quantitative inversion and the application of infrared remote sensing. The spectral calibration accuracy is affected by the limited field of view and off-axis effect. The traditional method is to obtain the spectral calibration coefficient by fitting multiple spectral lines. However, for issues such as ultra-high spectral resolution and wide observation spectral bands, most spaceborne infrared hyperspectral instruments employ forward modeling methods to build instrument spectral response models and remove various spectral effects.MethodsBased on the optical field of view characteristics, we conduct spectral simulations of limited field of view and off-axis effect, and study spectral correction methods for the plane array Fourier spectrometer. Firstly, the influence of instrument line shape function (ILS) is analyzed to determine the analysis methods for different influencing factors (such as finite optical path difference, finite field of view, and off-axis effect). Next, by taking a planar circular detector as an example, the ILS function is constructed by combining the optical characteristics of the instrument itself. Then, the spectral calibration error and spectral sensitivity caused by the off-axis effect are simulated by gas absorption spectroscopy. Finally, test data of the optical field of view is obtained via slit scanning. Based on the pre-launch spectral calibration data of FY-3F/HIRAS-Ⅱ, spectral correction and calibration accuracy verification are carried out.Results and DiscussionsThe experimental results indicate that the limited field of view and off-axis effect cause the spectrum to broaden and shift to a low wavenumber direction. There is a quadratic relationship between the off-axis angle θrc and the pixel field of view angle θR and the spectral calibration accuracy. The off-axis angle is more sensitive, and its contribution to the spectral calibration accuracy is much greater than that to the pixel field of view angle. When θR =60′, the error caused by measurement accuracy of 2′ is approximately 1.3×10⁻⁶. When θrc =101.82′(-72′, 72′), the error caused by the measurement accuracy of 2′ in a certain direction is about 12×10-6. After spectral calibration and correction, the spectral calibration accuracy of the center worst pixel decreases from -24.69×10⁻⁶ to 0.54×10⁻⁶, and the edge worst pixel reduces from -513.38×10⁻⁶ to -0.15×10⁻⁶. All pixels in the three bands meet the indicator requirement of less than 7×10⁻⁶.ConclusionsBased on the characteristics of the infrared hyperspectral atmospheric detector for the FY-3F satellite, the ILS function and spectral comprehensive effect matrix are constructed. The sensitivity analysis is conducted on the spectral calibration accuracy. By adopting the simulated results of HITRAN as the standard spectral line, the spectral calibration accuracy of long-wave NH3 absorption spectral lines under different off-axis angles and pixel field of view angles is studied. There is a quadratic function relationship between the spectral calibration accuracy and the angles. The sensitivity to off-axis angles is much higher than that to the pixel field of view angles, the spectral calibration accuracy of the central pixel is -18.84×10⁻⁶, and the spectral calibration accuracy of the outermost pixel is -451×10-6. Meanwhile, the spectral calibration accuracy caused by position error and pixel size error under the existing optical field of view testing conditions is 1.3×10⁻⁶ and 12×10-6 respectively. We have studied pre-launch spectral calibration and calibration methods based on instrument optical characteristics and completed the pre-launch spectral performance evaluation of FY-3F/HIRAS-Ⅱ. After spectral correction, the maximum spectral calibration accuracy of each pixel in the three bands is 2.23×10⁻⁶, which meets the spectral calibration index requirement of 7×10⁻⁶. Additionally, our study also has guiding significance for designing and testing optical field parameters in the future and improving spectral calibration accuracy. ObjectiveThe infrared Fourier spectrometer is based on interferometric spectroscopy, which features high spectral resolution and high sensitivity. Due to the ultra-fine spectral resolution of infrared hyperspectral atmospheric detection instruments, minor errors in spectral calibration can cause radiation measurement errors. High precision spectral calibration is an important prerequisite for quantitative inversion and the application of infrared remote sensing. The spectral calibration accuracy is affected by the limited field of view and off-axis effect. The traditional method is to obtain the spectral calibration coefficient by fitting multiple spectral lines. However, for issues such as ultra-high spectral resolution and wide observation spectral bands, most spaceborne infrared hyperspectral instruments employ forward modeling methods to build instrument spectral response models and remove various spectral effects.MethodsBased on the optical field of view characteristics, we conduct spectral simulations of limited field of view and off-axis effect, and study spectral correction methods for the plane array Fourier spectrometer. Firstly, the influence of instrument line shape function (ILS) is analyzed to determine the analysis methods for different influencing factors (such as finite optical path difference, finite field of view, and off-axis effect). Next, by taking a planar circular detector as an example, the ILS function is constructed by combining the optical characteristics of the instrument itself. Then, the spectral calibration error and spectral sensitivity caused by the off-axis effect are simulated by gas absorption spectroscopy. Finally, test data of the optical field of view is obtained via slit scanning. Based on the pre-launch spectral calibration data of FY-3F/HIRAS-Ⅱ, spectral correction and calibration accuracy verification are carried out.Results and DiscussionsThe experimental results indicate that the limited field of view and off-axis effect cause the spectrum to broaden and shift to a low wavenumber direction. There is a quadratic relationship between the off-axis angle θrc and the pixel field of view angle θR and the spectral calibration accuracy. The off-axis angle is more sensitive, and its contribution to the spectral calibration accuracy is much greater than that to the pixel field of view angle. When θR =60′, the error caused by measurement accuracy of 2′ is approximately 1.3×10⁻⁶. When θrc =101.82′(-72′, 72′), the error caused by the measurement accuracy of 2′ in a certain direction is about 12×10-6. After spectral calibration and correction, the spectral calibration accuracy of the center worst pixel decreases from -24.69×10⁻⁶ to 0.54×10⁻⁶, and the edge worst pixel reduces from -513.38×10⁻⁶ to -0.15×10⁻⁶. All pixels in the three bands meet the indicator requirement of less than 7×10⁻⁶.ConclusionsBased on the characteristics of the infrared hyperspectral atmospheric detector for the FY-3F satellite, the ILS function and spectral comprehensive effect matrix are constructed. The sensitivity analysis is conducted on the spectral calibration accuracy. By adopting the simulated results of HITRAN as the standard spectral line, the spectral calibration accuracy of long-wave NH3 absorption spectral lines under different off-axis angles and pixel field of view angles is studied. There is a quadratic function relationship between the spectral calibration accuracy and the angles. The sensitivity to off-axis angles is much higher than that to the pixel field of view angles, the spectral calibration accuracy of the central pixel is -18.84×10⁻⁶, and the spectral calibration accuracy of the outermost pixel is -451×10-6. Meanwhile, the spectral calibration accuracy caused by position error and pixel size error under the existing optical field of view testing conditions is 1.3×10⁻⁶ and 12×10-6 respectively. We have studied pre-launch spectral calibration and calibration methods based on instrument optical characteristics and completed the pre-launch spectral performance evaluation of FY-3F/HIRAS-Ⅱ. After spectral correction, the maximum spectral calibration accuracy of each pixel in the three bands is 2.23×10⁻⁶, which meets the spectral calibration index requirement of 7×10⁻⁶. Additionally, our study also has guiding significance for designing and testing optical field parameters in the future and improving spectral calibration accuracy.
Acta Optica Sinica
- Publication Date: Jun. 25, 2024
- Vol. 44, Issue 12, 1230001 (2024)

Broadband Spectral Reflectance Reconstruction Based on Improved Principal Component Analysis
Hai Zhao, Hongning Li, Hao Chen, Yaru Gao, and Xin Yang
ObjectiveSpectral imaging technology, capable of integrating images and spectra, is widely used and has developed rapidly in the fields of color imaging, cultural heritage, artwork research, etc. Traditional color replication technology uses related equipment for direct replication through RGB values, which is affected by the isochromatic spectrum and results in inaccurate color replication. For more accurate color reproduction, spectral reflectance can be used as a medium for color information transmission to ensure that the reproduced color is the same as the actual color. Spectral reflectance reconstruction is an important research topic in optics. Its purpose is to reconstruct the spectral reflectance of an object through the equipment-related RGB values obtained by various imaging equipment, which is independent of equipment and illumination. Some traditional reflectance reconstruction methods, such as the principal component analysis and the pseudo-inverse method, are still insufficient in accuracy. There are also some improved methods based on them. For instance, the reflectance reconstruction method using a single lighting image combined with the weighted pseudo-inverse method can reduce the collected lighting images, but the matching information between colors is less. Therefore, the requirements for experimental conditions become higher, and there may be a homochromatic phenomenon affecting the reconstruction accuracy. To reduce the complexity and cost of spectral reflectance reconstruction equipment and achieve more accurate reflectance reconstruction on the wideband spectra, this study improves the principal component analysis and reconstructs spectral reflectance by combining the weighting coefficient and error correction function.MethodsIn this paper, a wideband multispectral imaging method is adopted. The red, green, and blue light of a projector is used as the light source to illuminate the surface of an object, and the spectral images are sampled by a color digital camera. According to the Euclidean distance relation, the experimental samples are sorted, and the 31 samples most relevant to the test samples are selected as the locally optimal training samples. The weight factor is added on the basis of the principal component analysis, and an error correction item is introduced according to the pseudo-inverse method to correct the reflectance reconstructed by the weighted principal component analysis. The corrected reflectance is used as the final output. The improved method is used to reconstruct the reflectance of SG140 color cards, dyed paper, and oil painting surfaces to verify the accuracy.Results and DiscussionsThe improved method, principal component analysis, and weighted pseudo-inverse method are employed to reconstruct the reflectance separately. The results show that the experimental method has improved the accuracy of the reflectance reconstruction to different degrees after comparison. According to the reflectance of the reconstructed four pieces of dyed paper (Fig. 7), three kinds of data representing the reconstruction accuracy (Table 2), and the reflectance of some points on the reconstructed oil painting surfaces (Fig. 9) and its accuracy data (Table 3), the reflectance reconstruction accuracy of the painting and oil painting surfaces can also meet the expected requirements. According to the root-mean-square error data on the reflectance of the reconstructed SG140 color cards (Fig. 10), the root-mean-square error of the method in this paper is 2.4995, and that of the principal component analysis is 4.5812, while that of the weighted pseudo-inverse method is 3.4851. The proposed method significantly improves the reflectance reconstruction accuracy upon the improvement in the principal component analysis.ConclusionsIn the experimental analysis, three indexes (root-mean-square error, fitting coefficient, and spectral matching skewness index) are used to characterize the reflectance reconstruction accuracy and measure the reconstruction effect. The comparison with the principal component analysis and weighted pseudo-inverse method shows that the spectral reflectance reconstruction accuracy of the method in this experiment increases by about 45% on the basis of the principal component analysis. The color difference of SG140 color cards reconstructed by the three methods is further calculated, and the average value of the color difference is also smaller than that of the method proposed in this paper. The Euclidean distance between the training sample and the test sample is used to select the locally optimal training sample. When the number of samples is large, the amount of computation will be increased, which is not suitable for the situation requiring rapid reflectivity reconstruction. ObjectiveSpectral imaging technology, capable of integrating images and spectra, is widely used and has developed rapidly in the fields of color imaging, cultural heritage, artwork research, etc. Traditional color replication technology uses related equipment for direct replication through RGB values, which is affected by the isochromatic spectrum and results in inaccurate color replication. For more accurate color reproduction, spectral reflectance can be used as a medium for color information transmission to ensure that the reproduced color is the same as the actual color. Spectral reflectance reconstruction is an important research topic in optics. Its purpose is to reconstruct the spectral reflectance of an object through the equipment-related RGB values obtained by various imaging equipment, which is independent of equipment and illumination. Some traditional reflectance reconstruction methods, such as the principal component analysis and the pseudo-inverse method, are still insufficient in accuracy. There are also some improved methods based on them. For instance, the reflectance reconstruction method using a single lighting image combined with the weighted pseudo-inverse method can reduce the collected lighting images, but the matching information between colors is less. Therefore, the requirements for experimental conditions become higher, and there may be a homochromatic phenomenon affecting the reconstruction accuracy. To reduce the complexity and cost of spectral reflectance reconstruction equipment and achieve more accurate reflectance reconstruction on the wideband spectra, this study improves the principal component analysis and reconstructs spectral reflectance by combining the weighting coefficient and error correction function.MethodsIn this paper, a wideband multispectral imaging method is adopted. The red, green, and blue light of a projector is used as the light source to illuminate the surface of an object, and the spectral images are sampled by a color digital camera. According to the Euclidean distance relation, the experimental samples are sorted, and the 31 samples most relevant to the test samples are selected as the locally optimal training samples. The weight factor is added on the basis of the principal component analysis, and an error correction item is introduced according to the pseudo-inverse method to correct the reflectance reconstructed by the weighted principal component analysis. The corrected reflectance is used as the final output. The improved method is used to reconstruct the reflectance of SG140 color cards, dyed paper, and oil painting surfaces to verify the accuracy.Results and DiscussionsThe improved method, principal component analysis, and weighted pseudo-inverse method are employed to reconstruct the reflectance separately. The results show that the experimental method has improved the accuracy of the reflectance reconstruction to different degrees after comparison. According to the reflectance of the reconstructed four pieces of dyed paper (Fig. 7), three kinds of data representing the reconstruction accuracy (Table 2), and the reflectance of some points on the reconstructed oil painting surfaces (Fig. 9) and its accuracy data (Table 3), the reflectance reconstruction accuracy of the painting and oil painting surfaces can also meet the expected requirements. According to the root-mean-square error data on the reflectance of the reconstructed SG140 color cards (Fig. 10), the root-mean-square error of the method in this paper is 2.4995, and that of the principal component analysis is 4.5812, while that of the weighted pseudo-inverse method is 3.4851. The proposed method significantly improves the reflectance reconstruction accuracy upon the improvement in the principal component analysis.ConclusionsIn the experimental analysis, three indexes (root-mean-square error, fitting coefficient, and spectral matching skewness index) are used to characterize the reflectance reconstruction accuracy and measure the reconstruction effect. The comparison with the principal component analysis and weighted pseudo-inverse method shows that the spectral reflectance reconstruction accuracy of the method in this experiment increases by about 45% on the basis of the principal component analysis. The color difference of SG140 color cards reconstructed by the three methods is further calculated, and the average value of the color difference is also smaller than that of the method proposed in this paper. The Euclidean distance between the training sample and the test sample is used to select the locally optimal training sample. When the number of samples is large, the amount of computation will be increased, which is not suitable for the situation requiring rapid reflectivity reconstruction.
Acta Optica Sinica
- Publication Date: May. 10, 2023
- Vol. 43, Issue 9, 0930002 (2023)
Temperature Spectrum Optimization of Mixed White LED Cluster Comprising Red/Green/Blue/Warm White LED
Huijuan Tian, Xinhua Zhang, and Jin Zhang
ObjectiveLight emitting diode (LED) features high luminous efficiency, adjustable luminance and color temperature, fast response, and long life, and it is widely applied in various fields. During the operation of LED light sources, the temperature change exerts an impact on its emission spectrum and energy efficiency. In previous studies, the designs of heat dissipation structures are mainly adopted to reduce the impact of temperature on LED luminous efficiency and performance. Some researchers have also employed other methods to study the impact. A closed-loop negative feedback system is designed to reduce the influence of temperature on the spectrum of the light source, and the temperature spectrum compensation method of RGBY four-color LED light source is proposed based on visual and non-visual effects. The white LED for lighting is mostly obtained by blue excited yttrium aluminum garnet phosphor. However, its color temperature cannot be adjusted and color rendering is poor. A mixed white LED cluster can achieve dynamic adjustment of color temperature and high color rendering index. Therefore, the optimization method of multi-channel LED white light with tunable color temperature and high color rendering index has been extensively studied. However, the influence of the thermal effect on the optical parameters of a mixed white LED is rarely considered. Thus, this paper studies the impact of temperature on the spectrum of red/green/blue/warm-white (R/G/B/WW) four-color LED and obtains the spectral model with temperature change. Additionally, the spectral optimization model of R/G/B/WW LED mixed white light is built by the adaptive differential evolution (JADE) algorithm based on the temperature and duty ratio, and it is verified through experiments.MethodsThe experimental setup mainly consists of microcontroller (MCU), R/G/B/WW LED light source, integrating sphere, HASS-2000 spectral radiometer, and CL-200 temperature control device.Two R/G/B/WW four-color LED clusters are connected in series. The MCU can generate four different pulse width modulation (PWM) signals with specific duty ratios (DR, DG, DB and DWW) to achieve four-color LED mixed white light. The HASS-2000 spectral analysis system is adopted to measure the spectral power distribution (SPD) of each LED in the R/G/B/WW LED clusters, and the parameters of mixed white light including the luminous flux, color rendering index, and correlated color temperature. The stability of LED temperature is controlled by the CL-200 temperature control device. The temperature range is from 20 ℃ to 90 ℃ with error margin of ±0.1 ℃, and the temperature interval is 10 ℃. In addition, the driving output current of the R/G/B/WW four-color LED clusters is 350 mA and the driving voltage is 6 V. Eight groups of spectral power distribution curves of each monochrome LED light source with temperature between 20 ℃ and 90 ℃ and the interval of 10 ℃ are measured by experiments when the duty ratio is 1. Three modes of Gaussian, Gauss-Lorentz, and Bigaussian are utilized to study the temperature spectral model of LED light source respectively. Additionally, the spectral model changing with temperature can be obtained.Results and DiscussionsThe four-color LED mixed white light with color temperatures of 3000 K, 5000 K, and 6500 K is employed to verify the accuracy of the temperature spectrum model (Fig. 3). Based on the temperature spectral model, the SPDs at temperatures of 20 ℃, 60 ℃, and 90 ℃ are calculated, respectively. The results show that the SPD of the model with temperature change is approximately the same as the measured results (Fig. 4). According to the temperature spectrum model, the parameters of light source containing illuminance (EV), color rendering index (Ra), correlation color temperature (TC), blue light hazard factor (ηB), circadian action factor (CAF), and considering visual/non-visual effects can be calculated at different temperatures. Meanwhile, the calculation results are compared with the measured parameters of the light source at different temperatures (Table 2). The maximum deviation between the model parameters and measured parameters in the three LED light sources is 3.79%, and the chromaticity difference is less than 5.4×10⁻³. The light source spectrum and parameter values can change with the rising temperature (Fig. 5). Finally, the JADE algorithm is adopted to acquire the single channel duty ratio to optimize the light source spectrum and related parameters. At the above three LED light sources, the optimization duty ratio obtained by the JADE algorithm shows a linear relationship with the temperature. Based on the optimization model, the SPDs and parameter values of light source at different temperatures after optimization can be obtained. The optimized SPD is approximately the same as the light source spectrum at the initial temperature (Fig. 6), and the maximum relative error of the parameter values is 2.62% (Table 3).ConclusionsIn this paper, according to PWM dimming technology, the JADE algorithm is leveraged to study the spectrum optimization of R/G/B/WW LED mixed white cluster with temperature change. According to the temperature spectral model, the R/G/B/WW LED mixed white spectra changing with temperature are obtained. Based on the obtained mixed white light spectra at different temperatures, the spectral optimization model that can effectively adjust the spectrum of the light source at different temperatures is built in accordance with the compensation results of the JADE algorithm. After compensation, the measured spectra are basically consistent with those of the optimization model, and the maximum relative error of LED light source parameter values is 2.62%. This method can compensate for parameters of light source caused by temperature, and guide the optimal design of health lighting system. In future studies, the method of obtaining real-time junction temperature of LED chips should be further explored, and the feedback control system should be constructed to realize the dynamical compensation of the light source parameters. ObjectiveLight emitting diode (LED) features high luminous efficiency, adjustable luminance and color temperature, fast response, and long life, and it is widely applied in various fields. During the operation of LED light sources, the temperature change exerts an impact on its emission spectrum and energy efficiency. In previous studies, the designs of heat dissipation structures are mainly adopted to reduce the impact of temperature on LED luminous efficiency and performance. Some researchers have also employed other methods to study the impact. A closed-loop negative feedback system is designed to reduce the influence of temperature on the spectrum of the light source, and the temperature spectrum compensation method of RGBY four-color LED light source is proposed based on visual and non-visual effects. The white LED for lighting is mostly obtained by blue excited yttrium aluminum garnet phosphor. However, its color temperature cannot be adjusted and color rendering is poor. A mixed white LED cluster can achieve dynamic adjustment of color temperature and high color rendering index. Therefore, the optimization method of multi-channel LED white light with tunable color temperature and high color rendering index has been extensively studied. However, the influence of the thermal effect on the optical parameters of a mixed white LED is rarely considered. Thus, this paper studies the impact of temperature on the spectrum of red/green/blue/warm-white (R/G/B/WW) four-color LED and obtains the spectral model with temperature change. Additionally, the spectral optimization model of R/G/B/WW LED mixed white light is built by the adaptive differential evolution (JADE) algorithm based on the temperature and duty ratio, and it is verified through experiments.MethodsThe experimental setup mainly consists of microcontroller (MCU), R/G/B/WW LED light source, integrating sphere, HASS-2000 spectral radiometer, and CL-200 temperature control device.Two R/G/B/WW four-color LED clusters are connected in series. The MCU can generate four different pulse width modulation (PWM) signals with specific duty ratios (DR, DG, DB and DWW) to achieve four-color LED mixed white light. The HASS-2000 spectral analysis system is adopted to measure the spectral power distribution (SPD) of each LED in the R/G/B/WW LED clusters, and the parameters of mixed white light including the luminous flux, color rendering index, and correlated color temperature. The stability of LED temperature is controlled by the CL-200 temperature control device. The temperature range is from 20 ℃ to 90 ℃ with error margin of ±0.1 ℃, and the temperature interval is 10 ℃. In addition, the driving output current of the R/G/B/WW four-color LED clusters is 350 mA and the driving voltage is 6 V. Eight groups of spectral power distribution curves of each monochrome LED light source with temperature between 20 ℃ and 90 ℃ and the interval of 10 ℃ are measured by experiments when the duty ratio is 1. Three modes of Gaussian, Gauss-Lorentz, and Bigaussian are utilized to study the temperature spectral model of LED light source respectively. Additionally, the spectral model changing with temperature can be obtained.Results and DiscussionsThe four-color LED mixed white light with color temperatures of 3000 K, 5000 K, and 6500 K is employed to verify the accuracy of the temperature spectrum model (Fig. 3). Based on the temperature spectral model, the SPDs at temperatures of 20 ℃, 60 ℃, and 90 ℃ are calculated, respectively. The results show that the SPD of the model with temperature change is approximately the same as the measured results (Fig. 4). According to the temperature spectrum model, the parameters of light source containing illuminance (EV), color rendering index (Ra), correlation color temperature (TC), blue light hazard factor (ηB), circadian action factor (CAF), and considering visual/non-visual effects can be calculated at different temperatures. Meanwhile, the calculation results are compared with the measured parameters of the light source at different temperatures (Table 2). The maximum deviation between the model parameters and measured parameters in the three LED light sources is 3.79%, and the chromaticity difference is less than 5.4×10⁻³. The light source spectrum and parameter values can change with the rising temperature (Fig. 5). Finally, the JADE algorithm is adopted to acquire the single channel duty ratio to optimize the light source spectrum and related parameters. At the above three LED light sources, the optimization duty ratio obtained by the JADE algorithm shows a linear relationship with the temperature. Based on the optimization model, the SPDs and parameter values of light source at different temperatures after optimization can be obtained. The optimized SPD is approximately the same as the light source spectrum at the initial temperature (Fig. 6), and the maximum relative error of the parameter values is 2.62% (Table 3).ConclusionsIn this paper, according to PWM dimming technology, the JADE algorithm is leveraged to study the spectrum optimization of R/G/B/WW LED mixed white cluster with temperature change. According to the temperature spectral model, the R/G/B/WW LED mixed white spectra changing with temperature are obtained. Based on the obtained mixed white light spectra at different temperatures, the spectral optimization model that can effectively adjust the spectrum of the light source at different temperatures is built in accordance with the compensation results of the JADE algorithm. After compensation, the measured spectra are basically consistent with those of the optimization model, and the maximum relative error of LED light source parameter values is 2.62%. This method can compensate for parameters of light source caused by temperature, and guide the optimal design of health lighting system. In future studies, the method of obtaining real-time junction temperature of LED chips should be further explored, and the feedback control system should be constructed to realize the dynamical compensation of the light source parameters.
Acta Optica Sinica
- Publication Date: May. 10, 2023
- Vol. 43, Issue 9, 0930001 (2023)
Effect of Spatial Confinement on Plasma Evolution and Spectrum in Laser-Induced Breakdown Spectroscopy
Yachao Cai, Yang Bu, Yuanhang Wang, Fang Wu, and Xiaona Yan
ObjectiveLaser-induced breakdown spectroscopy (LIBS) is a valuable element analysis method that has been widely applied in many fields including biomedical, industrial, and environmental analysis. It uses a pulsed laser beam to interact with the sample and produces a plasma plume above the sample surface. The emission spectra of the specific elements can be obtained from the plasma, and element compositions and contents of the sample can be gained by spectral analysis. The properties of plasma and sample analysis depend on the related parameters of the LIBS system, which includes the laser pulse and physical situation of the sample. Related works have been carried out to describe the effects of such conditions on laser-induced plasma through numerical simulation. Spatial confinement is an effective method to enhance LIBS signals. The plasma evolution, including its morphological characteristics, is affected by the presence of the cavity. The plasma confined by the cavity is physically modified, with its morphology changed, because of its interaction with the cavity walls. In this work, the effects of spatial confinement on plasma evolution and spectra in LIBS are investigated by the model. The laser-induced plasma plume of Al with or without the cavity is analyzed, and numerical information on the plasma particles is acquired during the expansion of plasma. In addition, the distributions of electron number density and electron temperature are studied. According to the plasma evolution data, the specific spectral signal intensities of the cases with different cavity widths are calculated. Under the same conditions as the simulation, experiments are performed to show the enhancement effect on signal intensity with the presence of the cavity and make a comparison with the simulation.MethodsIn this study, Al is employed as the sample material for the laser-induced plasma. Firstly, the initial conditions of the simulation process are determined, including relevant parameters of the incident laser, the spatial state of the sample (cavities with different sizes), and the boundary conditions of the simulation region. Given the state equation of the plasma evolution process and the simulation program FLASH, relevant data of the plasma can be obtained, including the plasma morphology and the spatial and temporal distributions of electron number density and electron temperature. Then, through the Saha equation and Boltzmann equation, the electron distribution information on the specific energy level can be further calculated. On the basis of the electron transition probability and absorption coefficient equation, the spectral intensity per unit can be acquired. After that, the overall spectral signal intensity is gained by the integration of the spectral signal of the acquisition region. In addition, experiments are conducted according to the parameters of the simulation, and the spectral signal intensities under different cavity widths are collected for further analysis combined with the simulation.Results and DiscussionsThe plasma evolution is significantly different in the case with or without the cavity. When the cavity exists, the expansion of plasma is affected by cavity walls, and the plasma morphology varies (Fig. 3). At the position of 1.0 cm above the Al surface, both the electron temperature and electron number density are enhanced (Fig. 5). This is because the shock wave produced by the laser-induced plasma is reflected by the wall, and then the reflected shock wave acts on the plasma and raises collision probabilities of particles in the plasma, which increases the electron number density and electron temperature and eventually leads to improvement of the spectral signal. The spatial confinement effect on plasma also contributes to the increase in the spectral signal intensity, the enhancement effect depends heavily on cavity width, and the maximum signal intensity is obtained at the width of 1.4 cm (Fig. 8). In addition, the tendency of the spectral signal intensity collected by the experiments is in good agreement with the simulation, which demonstrates good reliability of the simulation (Fig. 9).ConclusionsIn the present study, a two-dimension thermal model for nanosecond pulsed laser ablation of Al is developed to investigate the effect of spatial confinement on plasma evolution. The simulation yields numerical information on the spatial and temporal distributions of the plasma affected by cavities with different sizes. It can provide a reference for selecting the appropriate optical signal acquisition time and location in the experiments and a credible interpretation of the experimental data. When a cavity is present, the temperature and density of the plasma are enhanced, and the enhancement degrades as the cavity enlarges. The spatial and temporal distributions of electron temperature and electron number density are also studied for the calculation of signal intensity. Compared with the situation without the cavity, the signal intensity is significantly improved when a proper cavity exists. The maximum signal intensity is obtained at the cavity width of 1.4 cm, and this value is drastically improved compared to the case without the cavity. The variation trend of signal intensity with cavity widths obtained by the experiments matches well with the simulation. Moreover, it is shown that the presence of a cavity does not improve the signal intensity in all cases. A larger cavity width leads to weaker enhancement of plasma temperature and density, and signal acquisition is slightly affected by the presence of the walls. Both the simulation and experimental results suggest that the intensity is lower than that of the situation without a cavity when the cavity width is set to 2.0 cm. ObjectiveLaser-induced breakdown spectroscopy (LIBS) is a valuable element analysis method that has been widely applied in many fields including biomedical, industrial, and environmental analysis. It uses a pulsed laser beam to interact with the sample and produces a plasma plume above the sample surface. The emission spectra of the specific elements can be obtained from the plasma, and element compositions and contents of the sample can be gained by spectral analysis. The properties of plasma and sample analysis depend on the related parameters of the LIBS system, which includes the laser pulse and physical situation of the sample. Related works have been carried out to describe the effects of such conditions on laser-induced plasma through numerical simulation. Spatial confinement is an effective method to enhance LIBS signals. The plasma evolution, including its morphological characteristics, is affected by the presence of the cavity. The plasma confined by the cavity is physically modified, with its morphology changed, because of its interaction with the cavity walls. In this work, the effects of spatial confinement on plasma evolution and spectra in LIBS are investigated by the model. The laser-induced plasma plume of Al with or without the cavity is analyzed, and numerical information on the plasma particles is acquired during the expansion of plasma. In addition, the distributions of electron number density and electron temperature are studied. According to the plasma evolution data, the specific spectral signal intensities of the cases with different cavity widths are calculated. Under the same conditions as the simulation, experiments are performed to show the enhancement effect on signal intensity with the presence of the cavity and make a comparison with the simulation.MethodsIn this study, Al is employed as the sample material for the laser-induced plasma. Firstly, the initial conditions of the simulation process are determined, including relevant parameters of the incident laser, the spatial state of the sample (cavities with different sizes), and the boundary conditions of the simulation region. Given the state equation of the plasma evolution process and the simulation program FLASH, relevant data of the plasma can be obtained, including the plasma morphology and the spatial and temporal distributions of electron number density and electron temperature. Then, through the Saha equation and Boltzmann equation, the electron distribution information on the specific energy level can be further calculated. On the basis of the electron transition probability and absorption coefficient equation, the spectral intensity per unit can be acquired. After that, the overall spectral signal intensity is gained by the integration of the spectral signal of the acquisition region. In addition, experiments are conducted according to the parameters of the simulation, and the spectral signal intensities under different cavity widths are collected for further analysis combined with the simulation.Results and DiscussionsThe plasma evolution is significantly different in the case with or without the cavity. When the cavity exists, the expansion of plasma is affected by cavity walls, and the plasma morphology varies (Fig. 3). At the position of 1.0 cm above the Al surface, both the electron temperature and electron number density are enhanced (Fig. 5). This is because the shock wave produced by the laser-induced plasma is reflected by the wall, and then the reflected shock wave acts on the plasma and raises collision probabilities of particles in the plasma, which increases the electron number density and electron temperature and eventually leads to improvement of the spectral signal. The spatial confinement effect on plasma also contributes to the increase in the spectral signal intensity, the enhancement effect depends heavily on cavity width, and the maximum signal intensity is obtained at the width of 1.4 cm (Fig. 8). In addition, the tendency of the spectral signal intensity collected by the experiments is in good agreement with the simulation, which demonstrates good reliability of the simulation (Fig. 9).ConclusionsIn the present study, a two-dimension thermal model for nanosecond pulsed laser ablation of Al is developed to investigate the effect of spatial confinement on plasma evolution. The simulation yields numerical information on the spatial and temporal distributions of the plasma affected by cavities with different sizes. It can provide a reference for selecting the appropriate optical signal acquisition time and location in the experiments and a credible interpretation of the experimental data. When a cavity is present, the temperature and density of the plasma are enhanced, and the enhancement degrades as the cavity enlarges. The spatial and temporal distributions of electron temperature and electron number density are also studied for the calculation of signal intensity. Compared with the situation without the cavity, the signal intensity is significantly improved when a proper cavity exists. The maximum signal intensity is obtained at the cavity width of 1.4 cm, and this value is drastically improved compared to the case without the cavity. The variation trend of signal intensity with cavity widths obtained by the experiments matches well with the simulation. Moreover, it is shown that the presence of a cavity does not improve the signal intensity in all cases. A larger cavity width leads to weaker enhancement of plasma temperature and density, and signal acquisition is slightly affected by the presence of the walls. Both the simulation and experimental results suggest that the intensity is lower than that of the situation without a cavity when the cavity width is set to 2.0 cm.
Acta Optica Sinica
- Publication Date: Apr. 10, 2023
- Vol. 43, Issue 7, 0730001 (2023)
Water Sample Classification and Fluorescence Component Identification Based on Fluorescence Spectrum
Qing Chen, Bin Tang, Junfeng Miao, Yan Zhou, Zourong Long, Jinfu Zhang, Jianxu Wang, Mi Zhou, Binqiang Ye, Mingfu Zhao, and Nianbing Zhong
ObjectiveThe treatment of organic pollutants in surface water, drinking water, and wastewater is one of the urgent social problems to be solved in the development of human society. Three-dimensional excitation-emission matrix (3D-EEM) fluorescence spectroscopy technology has been widely used to detect fluorescence components in surface water, sewage, and other samples. There are a lot of interference noises and fluorescence overlap information in the original 3D-EEM data, so there is an urgent need for a fast and accurate method to extract and analyze the useful information in 3D-EEM spectra. At present, parallel factor analysis (PARAFAC) is commonly used to decompose the overlapping fluorescence signals in 3D-EEM, but the analysis process of this method is complex, and the data set is strict, which greatly limits the on-line monitoring and analysis of samples. In this study, according to the results of PARAFAC, we propose a convolutional fast classification and recognition network model, which can quickly obtain water sample types, mass concentration grades, and fluorescent component maps by using only two convolutional neural network (CNN) models. As a result, it provides effective technical means for rapid detection of scenes such as surface water, drinking water, wastewater monitoring, and so on.MethodsIn this study, a method of water sample classification and fluorescence component fitting based on MobileNetV2, VGG11 component fitting (CF-VGG11) CNN, and PARAFAC is proposed. The 3D-EEM data of four types of water samples including surface water (DB), treated industrial wastewater (FS), sewage treatment plant inlet and outlet water (WS), and rural drinking water (XCYY) are collected, and the multi-output classification model of different water samples and the prediction and fitting model of fluorescence component maps are established with the results of PARAFAC as labels. The prediction of types and components is completed in two steps. In the first step, the MobileNetV2 algorithm is used to predict and classify different water samples. The second step is to use the CF-VGG11 network to fit the fluorescence component map.Results and DiscussionsThe data sets of all kinds of water samples are analyzed by PARAFAC, and four fluorescence components are shown (Fig. 6). Then, the PARAFAC results are uploaded to the OpenFluor database to obtain possible substances of various types of fluorescence components in water samples (Table 2). The similarity comparison scores of all components are more than 95%. Combined with the PARAFAC results as network labels, the MobileNetV2 classification network and CF-VGG11 component fitting network obtain a classification accuracy of 95.83% and a component fitting accuracy of 98.11%, respectively (Table 3). In order to show that the trained model has good classification and fitting performance, a part of untrained 3D-EEM data is selected for the test, and the results show that MobileNetV2 and CF-VGG11 can classify and fit the 3D-EEM of water samples very well (Fig. 7), and MobileNetV2 and CF-VGG11 network models have certain advantages compared with PARAFAC in terms of time cost, data requirement, and analysis process (Table 4).ConclusionsIn this study, a fast CNN classification and recognition algorithm based on fluorescence spectrum is proposed to predict the types and mass concentrations of different water samples, as well as the overlapping fluorescence components in 3D-EEM. This study relies on PARAFAC for preliminary data preparation and MobileNetV2 network for classification of water sample types and mass concentration grades, which can achieve water pollution traceability and exceedance warning, and the CF-VGG11 network is used to fit the fluorescence component map of water samples. The results show that the fast classification and identification network model based on the results of PARAFAC can quickly predict the types and mass concentration grades of water samples and fit their specific fluorescence components by inputting 3D-EEM data of a single water sample, and there is no need to repeat the complex PARAFAC. Therefore, this study provides certain theoretical support for detecting water pollution by three-dimensional fluorescence spectrometry and is of a certain practical significance. ObjectiveThe treatment of organic pollutants in surface water, drinking water, and wastewater is one of the urgent social problems to be solved in the development of human society. Three-dimensional excitation-emission matrix (3D-EEM) fluorescence spectroscopy technology has been widely used to detect fluorescence components in surface water, sewage, and other samples. There are a lot of interference noises and fluorescence overlap information in the original 3D-EEM data, so there is an urgent need for a fast and accurate method to extract and analyze the useful information in 3D-EEM spectra. At present, parallel factor analysis (PARAFAC) is commonly used to decompose the overlapping fluorescence signals in 3D-EEM, but the analysis process of this method is complex, and the data set is strict, which greatly limits the on-line monitoring and analysis of samples. In this study, according to the results of PARAFAC, we propose a convolutional fast classification and recognition network model, which can quickly obtain water sample types, mass concentration grades, and fluorescent component maps by using only two convolutional neural network (CNN) models. As a result, it provides effective technical means for rapid detection of scenes such as surface water, drinking water, wastewater monitoring, and so on.MethodsIn this study, a method of water sample classification and fluorescence component fitting based on MobileNetV2, VGG11 component fitting (CF-VGG11) CNN, and PARAFAC is proposed. The 3D-EEM data of four types of water samples including surface water (DB), treated industrial wastewater (FS), sewage treatment plant inlet and outlet water (WS), and rural drinking water (XCYY) are collected, and the multi-output classification model of different water samples and the prediction and fitting model of fluorescence component maps are established with the results of PARAFAC as labels. The prediction of types and components is completed in two steps. In the first step, the MobileNetV2 algorithm is used to predict and classify different water samples. The second step is to use the CF-VGG11 network to fit the fluorescence component map.Results and DiscussionsThe data sets of all kinds of water samples are analyzed by PARAFAC, and four fluorescence components are shown (Fig. 6). Then, the PARAFAC results are uploaded to the OpenFluor database to obtain possible substances of various types of fluorescence components in water samples (Table 2). The similarity comparison scores of all components are more than 95%. Combined with the PARAFAC results as network labels, the MobileNetV2 classification network and CF-VGG11 component fitting network obtain a classification accuracy of 95.83% and a component fitting accuracy of 98.11%, respectively (Table 3). In order to show that the trained model has good classification and fitting performance, a part of untrained 3D-EEM data is selected for the test, and the results show that MobileNetV2 and CF-VGG11 can classify and fit the 3D-EEM of water samples very well (Fig. 7), and MobileNetV2 and CF-VGG11 network models have certain advantages compared with PARAFAC in terms of time cost, data requirement, and analysis process (Table 4).ConclusionsIn this study, a fast CNN classification and recognition algorithm based on fluorescence spectrum is proposed to predict the types and mass concentrations of different water samples, as well as the overlapping fluorescence components in 3D-EEM. This study relies on PARAFAC for preliminary data preparation and MobileNetV2 network for classification of water sample types and mass concentration grades, which can achieve water pollution traceability and exceedance warning, and the CF-VGG11 network is used to fit the fluorescence component map of water samples. The results show that the fast classification and identification network model based on the results of PARAFAC can quickly predict the types and mass concentration grades of water samples and fit their specific fluorescence components by inputting 3D-EEM data of a single water sample, and there is no need to repeat the complex PARAFAC. Therefore, this study provides certain theoretical support for detecting water pollution by three-dimensional fluorescence spectrometry and is of a certain practical significance.
Acta Optica Sinica
- Publication Date: Mar. 25, 2023
- Vol. 43, Issue 6, 0630001 (2023)
Theoretical Investigation of Hole and Electron Transport Properties for Hydroxy-Tetraphenylimidazole Derivatives
Fan Liao, Xiaoying Cui, Chungang Min, and Aimin Ren
ObjectiveOrganic light-emitting diode (OLED) technology has attracted extensive attention due to its increasing demand in the fields of full-color flat-panel display and lighting. In general, the primary colors, i.e., red, green, and blue, are required for full-color display or white OLED (including solid-state lighting). In particular, the material that can emit blue light plays an important role in color temperature management and the color rendering index. Therefore, many studies on new blue light materials have been conducted for higher efficiency and better performance. In recent years, a new class of imidazolyl materials, hydroxyl-substituted tetraphenylimidazole (HPI) and its analogs, have attracted more and more attention because they can be used not only as a blue light material but also as a probe to detect hydrogen sulfide, arsenite ions, and fluoride ions. In this paper, the electron donor substituents, 9,9-dimethyl-9,10-dihydroacridine (DMAC), triphenylamine (TPA), 10H-phenothiazine (PTZ), 10H-phenoxazine (PXZ), phenyl carbazole (PCz), and 5H-indole [3,2,1-de] phenazine (InPz) are used to disubstitute the 3,5 positions of N-phenyl of hydroxy-tetraphenylimidazole. As a result, six hydroxy-tetraphenylimidazole derivatives are obtained. After that, their electronic structures and photophysical properties are studied with density-functional theory (DFT) and time-dependent density-functional theory (TDDFT). In addition, as the compounds containing electron-rich groups, such as triphenylamine and carbazole, are often used as hole transport materials, we also investigate the possibility of the six derivatives as hole and electron transport materials.MethodsThe first step is to verify the accuracy of functionals. Specifically, B3LYP, PBE0, and CAM-B3LYP functionals combined with the 6-31G(d, p) basis set are used to optimize the ground-state and the first single-excited-state geometries of experimentally synthesized HPI-TPA and HPI-PCz. The absorption and emission spectra are calculated. For HPI-TPA and HPI-PCz, the calculated results obtained by B3LYP and CAM-B3LYP functionals are significantly different from the experimental values, while those obtained by PBE0 are close to the experimental values. The same trends are reflected in emission spectra. Therefore, the PBE0 functional is used in the subsequent calculations. Then, the PBE0 functional combined with the 6-31G(d, p) basis set is used to optimize the geometries of the six hydroxy-tetraphenylimidazole derivatives. Given the optimized geometry, the ionization potentials (IP), electron affinity potentials (EA), hole extraction potentials (HEP), electron extraction potentials (EEP), hole reorganization energy λhole, and electron reorganization energy λelectron can be calculated. Finally, the excited-state geometries of the six derivatives are optimized by the TD PBE0/6-31G(d, p) method, and the absorption and emission spectra of the studied molecules are calculated by the same method.Results and DiscussionsAccording to the Kohn-Sham frontier orbitals and the contribution of electron density for HPI-TPA, HPI-PTZ, HPI-PXZ, and HPI-InPz, the electron clouds of the highest occupied molecular orbits (HOMOs) are mainly located on the R-down group, and the HPI and R-up groups almost do not contribute to HOMOs. For HPI-PCz, the contribution of the HPI group to HOMOs is 99.3%, while the contributions of the R-up and R-down groups are almost zero. For HPI-DMAC, the contribution of the R-up group to HOMOs is 100.0%, while the contributions of the HPI and R-down groups are zero. In contrast, for HPI-TPA, HPI-PTZ, HPI-PXZ, and HPI-InPz, the contributions of the R-down group decrease from 98.8%, 100.0%, 99.9%, and 100.0% in HOMOs to 42.7%, 22.1%, 23.0%, and 23.4% in lowest unoccupied molecular orbits (LUMOs), respectively. For HPI-PCz, the contribution of HPI decreases from 99.3% in HOMO to 53.4% in LUMO. For HPI-DMAC, the contribution of the R-up group decreases from 100.0% in HOMO to 24.5% in LUMO. This shows that there is a lot of electron transfer from HOMO to LUMO. In addition, the results of HOMO energies, LUMO energies, HOMO-LUMO gaps, ionization potentials, and electron affinities demonstrate that HPI-TPA, HPI-DMAC, HPI-PTZ, HPI-PXZ, and HPI-InPz show good hole transport ability, and HPI-PTZ, HPI-PXZ, and HPI-InPz also show good electron injection ability. Moreover, it is found that the HOMO-LUMO energy gaps of the studied compounds gradually narrow along the order of TPA, PCz, DMAC, PTZ, PXZ, and InPz. This indicates that the electronic transition ability of hydroxy-tetraphenylimidazole derivatives can be regulated by substituents. The absorption and emission spectra show that for HPI-DMAC, HPI-PTZ, HPI-PXZ, and HPI-InPz, the S1→S0 electronic transition is forbidden because the oscillator strengths are almost zero. HPI-TPA and HPI-PCz can emit bright blue light.ConclusionsIn this paper, the photophysical properties of six disubstituted hydroxy-tetraphenylimidazole derivatives are studied by the TD PBE0/6-31G(d, p) method. The results show that there is a lot of electron transfer in all molecules during the transition from HOMO to LUMO. HPI-PTZ, HPI-PXZ, and HPI-InPZ have strong hole and electron injection abilities. The HOMO-LUMO energy gaps gradually narrow along the order of TPA, PCz, DMAC, PTZ, PXZ, and InPz. This indicates that the electronic transition capacity of hydroxy-tetraphenylimidazole derivatives can be regulated by substituents. ObjectiveOrganic light-emitting diode (OLED) technology has attracted extensive attention due to its increasing demand in the fields of full-color flat-panel display and lighting. In general, the primary colors, i.e., red, green, and blue, are required for full-color display or white OLED (including solid-state lighting). In particular, the material that can emit blue light plays an important role in color temperature management and the color rendering index. Therefore, many studies on new blue light materials have been conducted for higher efficiency and better performance. In recent years, a new class of imidazolyl materials, hydroxyl-substituted tetraphenylimidazole (HPI) and its analogs, have attracted more and more attention because they can be used not only as a blue light material but also as a probe to detect hydrogen sulfide, arsenite ions, and fluoride ions. In this paper, the electron donor substituents, 9,9-dimethyl-9,10-dihydroacridine (DMAC), triphenylamine (TPA), 10H-phenothiazine (PTZ), 10H-phenoxazine (PXZ), phenyl carbazole (PCz), and 5H-indole [3,2,1-de] phenazine (InPz) are used to disubstitute the 3,5 positions of N-phenyl of hydroxy-tetraphenylimidazole. As a result, six hydroxy-tetraphenylimidazole derivatives are obtained. After that, their electronic structures and photophysical properties are studied with density-functional theory (DFT) and time-dependent density-functional theory (TDDFT). In addition, as the compounds containing electron-rich groups, such as triphenylamine and carbazole, are often used as hole transport materials, we also investigate the possibility of the six derivatives as hole and electron transport materials.MethodsThe first step is to verify the accuracy of functionals. Specifically, B3LYP, PBE0, and CAM-B3LYP functionals combined with the 6-31G(d, p) basis set are used to optimize the ground-state and the first single-excited-state geometries of experimentally synthesized HPI-TPA and HPI-PCz. The absorption and emission spectra are calculated. For HPI-TPA and HPI-PCz, the calculated results obtained by B3LYP and CAM-B3LYP functionals are significantly different from the experimental values, while those obtained by PBE0 are close to the experimental values. The same trends are reflected in emission spectra. Therefore, the PBE0 functional is used in the subsequent calculations. Then, the PBE0 functional combined with the 6-31G(d, p) basis set is used to optimize the geometries of the six hydroxy-tetraphenylimidazole derivatives. Given the optimized geometry, the ionization potentials (IP), electron affinity potentials (EA), hole extraction potentials (HEP), electron extraction potentials (EEP), hole reorganization energy λhole, and electron reorganization energy λelectron can be calculated. Finally, the excited-state geometries of the six derivatives are optimized by the TD PBE0/6-31G(d, p) method, and the absorption and emission spectra of the studied molecules are calculated by the same method.Results and DiscussionsAccording to the Kohn-Sham frontier orbitals and the contribution of electron density for HPI-TPA, HPI-PTZ, HPI-PXZ, and HPI-InPz, the electron clouds of the highest occupied molecular orbits (HOMOs) are mainly located on the R-down group, and the HPI and R-up groups almost do not contribute to HOMOs. For HPI-PCz, the contribution of the HPI group to HOMOs is 99.3%, while the contributions of the R-up and R-down groups are almost zero. For HPI-DMAC, the contribution of the R-up group to HOMOs is 100.0%, while the contributions of the HPI and R-down groups are zero. In contrast, for HPI-TPA, HPI-PTZ, HPI-PXZ, and HPI-InPz, the contributions of the R-down group decrease from 98.8%, 100.0%, 99.9%, and 100.0% in HOMOs to 42.7%, 22.1%, 23.0%, and 23.4% in lowest unoccupied molecular orbits (LUMOs), respectively. For HPI-PCz, the contribution of HPI decreases from 99.3% in HOMO to 53.4% in LUMO. For HPI-DMAC, the contribution of the R-up group decreases from 100.0% in HOMO to 24.5% in LUMO. This shows that there is a lot of electron transfer from HOMO to LUMO. In addition, the results of HOMO energies, LUMO energies, HOMO-LUMO gaps, ionization potentials, and electron affinities demonstrate that HPI-TPA, HPI-DMAC, HPI-PTZ, HPI-PXZ, and HPI-InPz show good hole transport ability, and HPI-PTZ, HPI-PXZ, and HPI-InPz also show good electron injection ability. Moreover, it is found that the HOMO-LUMO energy gaps of the studied compounds gradually narrow along the order of TPA, PCz, DMAC, PTZ, PXZ, and InPz. This indicates that the electronic transition ability of hydroxy-tetraphenylimidazole derivatives can be regulated by substituents. The absorption and emission spectra show that for HPI-DMAC, HPI-PTZ, HPI-PXZ, and HPI-InPz, the S1→S0 electronic transition is forbidden because the oscillator strengths are almost zero. HPI-TPA and HPI-PCz can emit bright blue light.ConclusionsIn this paper, the photophysical properties of six disubstituted hydroxy-tetraphenylimidazole derivatives are studied by the TD PBE0/6-31G(d, p) method. The results show that there is a lot of electron transfer in all molecules during the transition from HOMO to LUMO. HPI-PTZ, HPI-PXZ, and HPI-InPZ have strong hole and electron injection abilities. The HOMO-LUMO energy gaps gradually narrow along the order of TPA, PCz, DMAC, PTZ, PXZ, and InPz. This indicates that the electronic transition capacity of hydroxy-tetraphenylimidazole derivatives can be regulated by substituents.
Acta Optica Sinica
- Publication Date: Mar. 10, 2023
- Vol. 43, Issue 5, 0530001 (2023)
Topics
© Copyright 2018-2021 | Chinese Laser Press. All Rights Reserved 沪ICP备15018463号-20