• Photonics Research
  • Vol. 6, Issue 4, 282 (2018)
Jin Hou1、*, Chunyong Yang1, Xiaohang Li2, Zhenzhou Cao1, and Shaoping Chen1
Author Affiliations
  • 1Hubei Key Laboratory of Intelligent Wireless Communications, College of Electronics and Information Engineering, South-Central University for Nationalities, Wuhan 430074, China
  • 2King Abdullah University of Science and Technology (KAUST), Advanced Semiconductor Laboratory, Thuwal 23955-6900, Saudi Arabia
  • show less
    DOI: 10.1364/PRJ.6.000282 Cite this Article Set citation alerts
    Jin Hou, Chunyong Yang, Xiaohang Li, Zhenzhou Cao, Shaoping Chen. Enhanced complete photonic bandgap in a moderate refractive index contrast chalcogenide-air system with connected-annular-rods photonic crystals[J]. Photonics Research, 2018, 6(4): 282 Copy Citation Text show less
    Schematic structures of the proposed CARPCs. The black color represents chalcogenide glass, and the white color represents air. (a) Triangular-lattice CARPC. (b) Square-lattice CARPC.
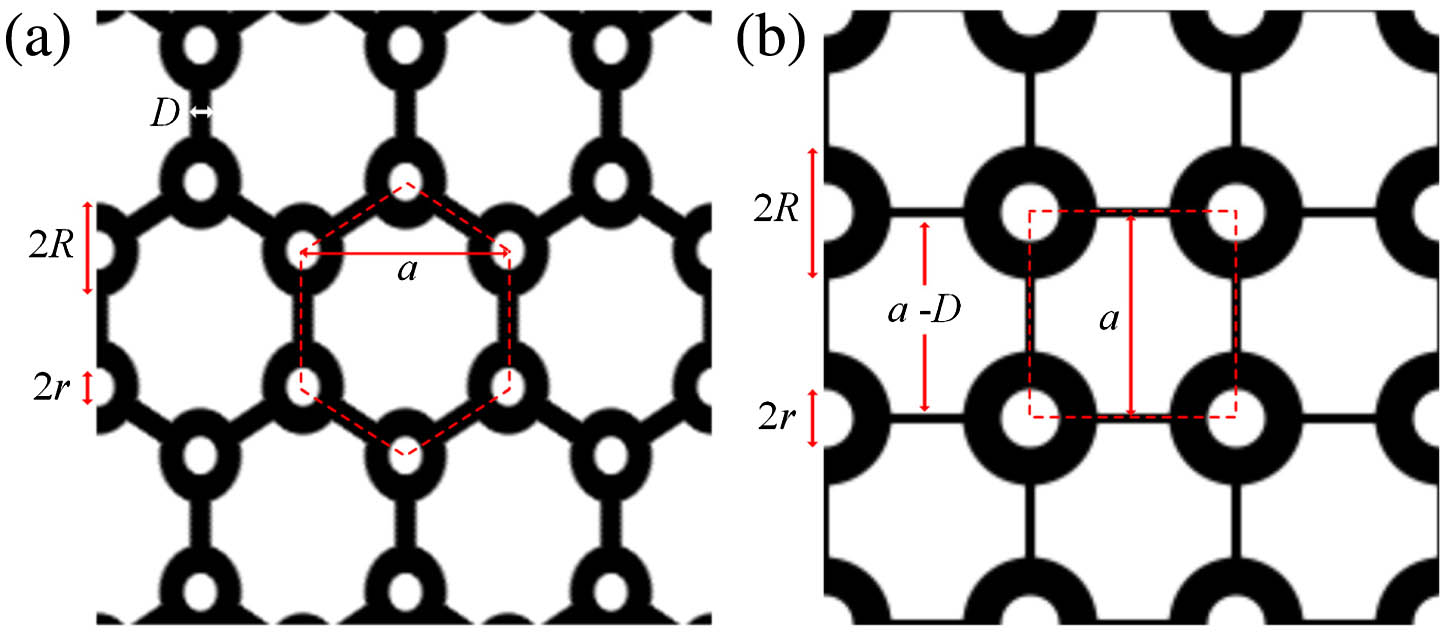
    Fig. 1. Schematic structures of the proposed CARPCs. The black color represents chalcogenide glass, and the white color represents air. (a) Triangular-lattice CARPC. (b) Square-lattice CARPC.
    Typical normalized CPBG bandwidth contour maps for CARPC with the triangular lattice. (a)–(c) Contour maps as functions of outer radius (R) and inner radius (r) for vein thickness (D) of 0, 0.06a and 0.12a, respectively. (d) Contour map as a function of vein thickness (D) and inner radius (r) for an optimized outer radius (R) of 0.175a.
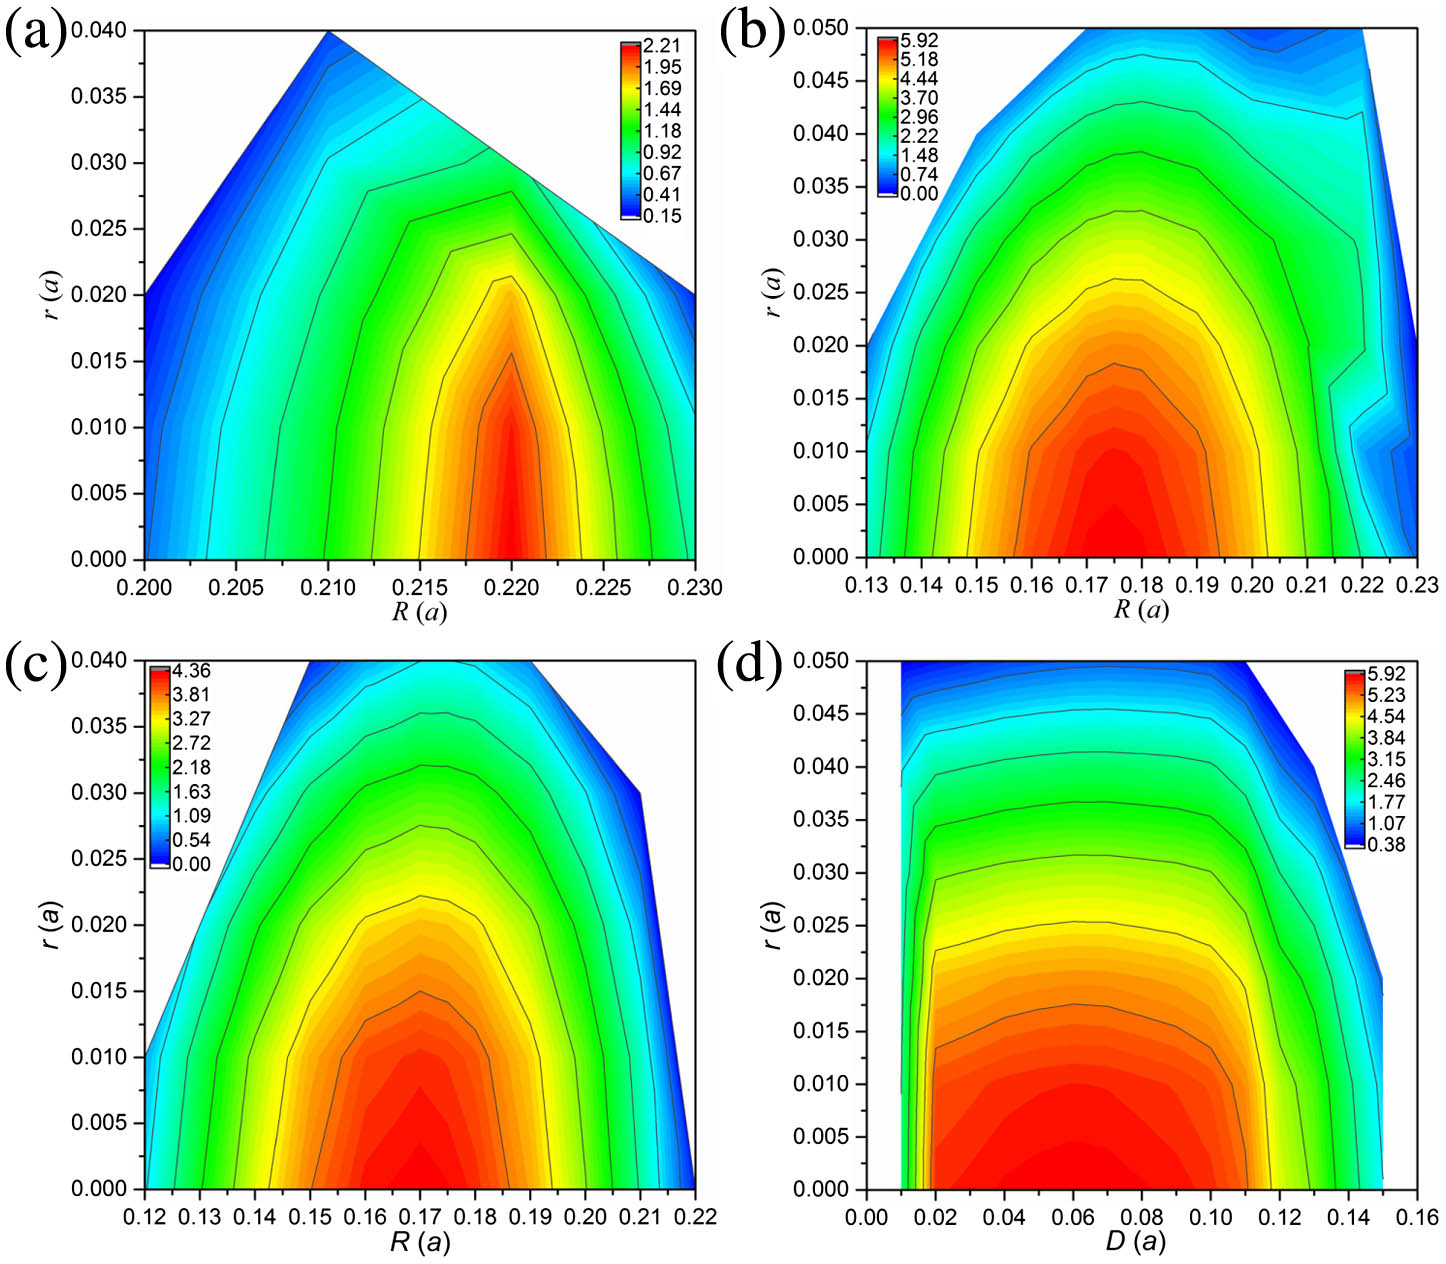
    Fig. 2. Typical normalized CPBG bandwidth contour maps for CARPC with the triangular lattice. (a)–(c) Contour maps as functions of outer radius (R) and inner radius (r) for vein thickness (D) of 0, 0.06a and 0.12a, respectively. (d) Contour map as a function of vein thickness (D) and inner radius (r) for an optimized outer radius (R) of 0.175a.
    Typical normalized CPBG bandwidth contour maps for CARPC with the square lattice. (a)–(c) Contour maps as functions of outer radius (R) and inner radius (r) for vein thickness (D) of 0, 0.05a, and 0.10a, respectively. (d) Contour map as a function of vein thickness (D) and inner radius (r) for an optimized outer radius (R) of 0.175a.
    Fig. 3. Typical normalized CPBG bandwidth contour maps for CARPC with the square lattice. (a)–(c) Contour maps as functions of outer radius (R) and inner radius (r) for vein thickness (D) of 0, 0.05a, and 0.10a, respectively. (d) Contour map as a function of vein thickness (D) and inner radius (r) for an optimized outer radius (R) of 0.175a.
    Photonic band structures for the optimized CARPCs with maximum normalized 2D CPBGs. (a) Triangular lattice CARPC with D=0.06a, R=0.175a, and r=0, which is the same with the maximum normalized 2D CPBG shown in Figs. 2(b) and 2(d). (b) Square-lattice CARPC with D=0.05a, R=0.33a, and r=0.13a, which is the same with the maximum normalized 2D CPBG shown in Figs. 3(b) and 3(d). The yellow and green shadows together denote the PBG for TM modes, the yellow and cyan shadows together denote the PBG for TE modes, and the yellow shadow denotes the 2D CPBG.
    Fig. 4. Photonic band structures for the optimized CARPCs with maximum normalized 2D CPBGs. (a) Triangular lattice CARPC with D=0.06a, R=0.175a, and r=0, which is the same with the maximum normalized 2D CPBG shown in Figs. 2(b) and 2(d). (b) Square-lattice CARPC with D=0.05a, R=0.33a, and r=0.13a, which is the same with the maximum normalized 2D CPBG shown in Figs. 3(b) and 3(d). The yellow and green shadows together denote the PBG for TM modes, the yellow and cyan shadows together denote the PBG for TE modes, and the yellow shadow denotes the 2D CPBG.
    Typical extreme normalized frequencies (the top extreme points in the lower dielectric band and bottom extreme points in the upper air band which fix the CPBG widths) at CPBG edges and the corresponding normalized CPBG width as functions of r. (a) Triangular lattice CARPCs with R=0.175a and D=0.06a. (b) Square-lattice CARPCs with R=0.33a and D=0.05a.
    Fig. 5. Typical extreme normalized frequencies (the top extreme points in the lower dielectric band and bottom extreme points in the upper air band which fix the CPBG widths) at CPBG edges and the corresponding normalized CPBG width as functions of r. (a) Triangular lattice CARPCs with R=0.175a and D=0.06a. (b) Square-lattice CARPCs with R=0.33a and D=0.05a.
    Evolution of the typical key photonic bands (band 5 and band 6 that determine the CPBG widths) for square-lattice CARPCs with fixed R=0.33a and D=0.05a, but different r. The yellow shadow denotes the maximum normalized CPBG width that obtained with r=0.13a, which is the same as that shown in Fig. 4(b).
    Fig. 6. Evolution of the typical key photonic bands (band 5 and band 6 that determine the CPBG widths) for square-lattice CARPCs with fixed R=0.33a and D=0.05a, but different r. The yellow shadow denotes the maximum normalized CPBG width that obtained with r=0.13a, which is the same as that shown in Fig. 4(b).
    Typical field distributions of the extreme CPBG edge modes for triangular lattice CARPCs with fixed R=0.175a and D=0.06a, but different r. (a) and (d) are with the same r=0. (b) and (e) are with the same r=0.02a. (c) and (f) are with the same r=0.04a. (a)–(c) are Ez field distributions of lower extreme CPBG edge modes at top of band 3 with a wave vector at Γ. (d)–(f) are Hz field distributions of upper extreme CPBG edge modes at bottom of band 4 with a wave vector at M.
    Fig. 7. Typical field distributions of the extreme CPBG edge modes for triangular lattice CARPCs with fixed R=0.175a and D=0.06a, but different r. (a) and (d) are with the same r=0. (b) and (e) are with the same r=0.02a. (c) and (f) are with the same r=0.04a. (a)–(c) are Ez field distributions of lower extreme CPBG edge modes at top of band 3 with a wave vector at Γ. (d)–(f) are Hz field distributions of upper extreme CPBG edge modes at bottom of band 4 with a wave vector at M.
    Typical field distributions of the extreme CPBG edge modes for square-lattice CARPCs with fixed R=0.33a and D=0.05a, but different r. (a) and (e) are for r=0. (b) and (f) are for r=0.13a. (c) and (g) are for r=0.15a. (d) and (h) are for r=0.20a. (a)–(d) are Ez field distributions of extreme lower CPBG edge modes at top of band 5 with a wave vector at X. (e) and (f) are Hz field distributions of extreme upper CPBG edge modes at bottom of band 6 with a wave vector at M. (g) and (h) are Ez field distributions of extreme upper CPBG edge modes at bottom of band 6 with a wave vector at M.
    Fig. 8. Typical field distributions of the extreme CPBG edge modes for square-lattice CARPCs with fixed R=0.33a and D=0.05a, but different r. (a) and (e) are for r=0. (b) and (f) are for r=0.13a. (c) and (g) are for r=0.15a. (d) and (h) are for r=0.20a. (a)–(d) are Ez field distributions of extreme lower CPBG edge modes at top of band 5 with a wave vector at X. (e) and (f) are Hz field distributions of extreme upper CPBG edge modes at bottom of band 6 with a wave vector at M. (g) and (h) are Ez field distributions of extreme upper CPBG edge modes at bottom of band 6 with a wave vector at M.
    Normalized CPBG as a function of refractive index of material for three different optimized square-lattice PCs. The black curve is for the referenced connected-solid-rods chalcogenide PC with r=0, R=0.33a, and D=0.1a, which obtained the maximum normalized CPBG reported in Ref. [15]. The red curve with solid circles denotes the CARPC with r=0.13a, R=0.33a, and D=0.05a, which obtains the maximum normalized CPBG for chalcogenide glass of index 2.8 and that is corresponding to Fig. 4(b). The blue curve with void circles is for the CARPC with structural parameters r=0.16a, R=0.37a, and D=0.1a, which obtains the maximum normalized CPBG for chalcogenide glass of index 2.34.
    Fig. 9. Normalized CPBG as a function of refractive index of material for three different optimized square-lattice PCs. The black curve is for the referenced connected-solid-rods chalcogenide PC with r=0, R=0.33a, and D=0.1a, which obtained the maximum normalized CPBG reported in Ref. [15]. The red curve with solid circles denotes the CARPC with r=0.13a, R=0.33a, and D=0.05a, which obtains the maximum normalized CPBG for chalcogenide glass of index 2.8 and that is corresponding to Fig. 4(b). The blue curve with void circles is for the CARPC with structural parameters r=0.16a, R=0.37a, and D=0.1a, which obtains the maximum normalized CPBG for chalcogenide glass of index 2.34.
    Photonic band structure, reflectivity spectra, and key configuration of the time domain simulation for the optimized square-lattice CARPC of index contrast 2.34:1. (a) Photonic band structure for CARPC with D=0.1a, R=0.37a, and r=0.16a. (b) TE and TM reflectivity spectra of the square-lattice CARPC reflector. (c) Key configurations of the time domain simulation of the reflector. Black region denotes chalcogenide, while white region denotes air. S denotes the Gaussian line optical source, and D1 and D2 are two flux detectors, respectively.
    Fig. 10. Photonic band structure, reflectivity spectra, and key configuration of the time domain simulation for the optimized square-lattice CARPC of index contrast 2.34:1. (a) Photonic band structure for CARPC with D=0.1a, R=0.37a, and r=0.16a. (b) TE and TM reflectivity spectra of the square-lattice CARPC reflector. (c) Key configurations of the time domain simulation of the reflector. Black region denotes chalcogenide, while white region denotes air. S denotes the Gaussian line optical source, and D1 and D2 are two flux detectors, respectively.
    Quality factor of the square-lattice CARPC cavity as a function of the number of square rings surrounding the defect and field distributions of the cavity modes for the two polarizations. (a) Quality factor of the square-lattice CARPC cavity as a function of the number of square rings surrounding the defect, and the left upper inset shows a schematic structure of the square-lattice CARPC cavity with N of 7. (b) The Hz field for TE cavity mode having a Q value of 19,234 (see Visualization 1 for a movie of the resonance). (c) The Ez field for TM cavity mode having a Q value of 3,989 (see Visualization 2 for a movie of the resonance).
    Fig. 11. Quality factor of the square-lattice CARPC cavity as a function of the number of square rings surrounding the defect and field distributions of the cavity modes for the two polarizations. (a) Quality factor of the square-lattice CARPC cavity as a function of the number of square rings surrounding the defect, and the left upper inset shows a schematic structure of the square-lattice CARPC cavity with N of 7. (b) The Hz field for TE cavity mode having a Q value of 19,234 (see Visualization 1 for a movie of the resonance). (c) The Ez field for TM cavity mode having a Q value of 3,989 (see Visualization 2 for a movie of the resonance).
    Jin Hou, Chunyong Yang, Xiaohang Li, Zhenzhou Cao, Shaoping Chen. Enhanced complete photonic bandgap in a moderate refractive index contrast chalcogenide-air system with connected-annular-rods photonic crystals[J]. Photonics Research, 2018, 6(4): 282
    Download Citation