1Hubei Key Laboratory of Intelligent Wireless Communications, College of Electronics and Information Engineering, South-Central University for Nationalities, Wuhan 430074, China
2King Abdullah University of Science and Technology (KAUST), Advanced Semiconductor Laboratory, Thuwal 23955-6900, Saudi Arabia
Jin Hou, Chunyong Yang, Xiaohang Li, Zhenzhou Cao, Shaoping Chen, "Enhanced complete photonic bandgap in a moderate refractive index contrast chalcogenide-air system with connected-annular-rods photonic crystals," Photonics Res. 6, 282 (2018)
Copy Citation Text
Connected-annular-rods photonic crystals (CARPCs) in both triangular and square lattices are proposed to enhance the two-dimensional complete photonic bandgap (CPBG) for chalcogenide material systems with moderate refractive index contrast. For the typical chalcogenide-glass–air system with an index contrast of 2.8:1, the optimized square lattice CARPC exhibits a significantly larger normalized CPBG of about 13.50%, though the use of triangular lattice CARPC is unable to enhance the CPBG. It is almost twice as large as our previously reported result [IEEE J. Sel. Top. Quantum Electron.22, 4900108 (2016)IJSQEN1077-260X10.1109/JSTQE.2015.2422997]. Moreover, the CPBG of the square-lattice CARPC could remain until an index contrast as low as 2.24:1. The result not only favors wideband CPBG applications for index contrast systems near 2.8:1, but also makes various optical applications that are dependent on CPBG possible for more widely refractive index contrast systems.
Chalcogenide materials with a moderate refractive index are fascinating due to their unique features of both broad infrared transparency and highly nonlinear properties [1–5]. Making use of the photonic band gap (PBG) property of chalcogenide photonic crystals (PCs), various powerful functional optical devices have been designed or fabricated [2,3,6–14]. If the PBG is increased, the performance of these PC devices would be further improved. However, currently both the theoretical design and fabrication of three-dimensional (3D) PCs are challenging. Therefore, much attention has been put into the two-dimensional (2D) chalcogenide PC [2,3,6–14]. In the 2D PC, the modes of light waves could be decomposed into transverse-electric (TE) and transverse-magnetic (TM) polarizations. Thus, a 2D PBG that overlaps with TE and TM modes, or the 2D complete PBG (CPBG), is especially desirable for applications [15]. However, compared to high-index materials such as silicon or GaAs, it is hard to obtain a wide 2D CPBG with chalcogenide materials due to their moderate refractive index, which are typically within the range of 2 to 3 [16]. Therefore, various geometry-adjusting methods have been proposed to enhance the 2D CPBG [15,17,18]. Previous investigations have suggested that while the isolated dielectric rods structure favors TM PBGs, the connected air-hole structure is more desirable for TE PBGs [19]. Thus connected-solid-rods chalcogenide PCs with a triangular lattice that benefits from both characteristics has been proposed to enhance the 2D CPBG, which leads to a normalized CPBG (defined as the gap-to-midgap ratio) of 5.4% with a chalcogenide air index contrast of 2.8:1 [17]. Recently, using a square lattice, the connected-solid-rods chalcogenide PC is found to be able to support a large normalized CPBG of 7.4%, and the CPBG could remain existing until a lower index of 2.4:1 [15]. Although improvements have been achieved, further extending the CPBG width and reducing the index contrast still needs to be investigated compared to either the broad transparent spectral width or their corresponding refractive index ranges of the chalcogenide materials.
In this paper, connected-annular-rods photonic crystals (CARPCs) in both triangular and square lattices are proposed to enhance the 2D CPBG for moderate refractive index contrast material systems. The CARPC is proposed based on previous research of the connected-solid-rods chalcogenide PCs [15,17] and also the well-known annular PCs [20–23]. The latter was first proposed to obtain a large CPBG with high refractive index materials [20,22]. Here, by introducing the annular PC into the connected-solid-rods chalcogenide PCs, the proposed CARPC could further enhance the 2D CPBG with moderate contrast. We find that for typical chalcogenide-glass–air systems with index contrast of 2.8:1, which could be found in AMTIR-2 (arsenic selenide glass) near the wavelength of 2.3 μm, the square-lattice CARPC could effectively enhance the normalized CPBG, although the triangular-lattice CARPC is not able to enhance the CPBG. Through mapping the structural parameters of square-lattice CARPC, a maximum normalized CPBG of 13.50% could be obtained. This value is almost twice as large as the record that we previously reported [15]. Moreover, the CPBG of the square-lattice CARPC could remain until an index contrast as low as 2.24:1. The proposed structure not only favors wideband CPBG applications for index contrast systems near 2.8:1, but also makes various optical applications based on CPBG possible for lower moderate index contrast systems [24–26].
2. STRUCTURES OF CARPC
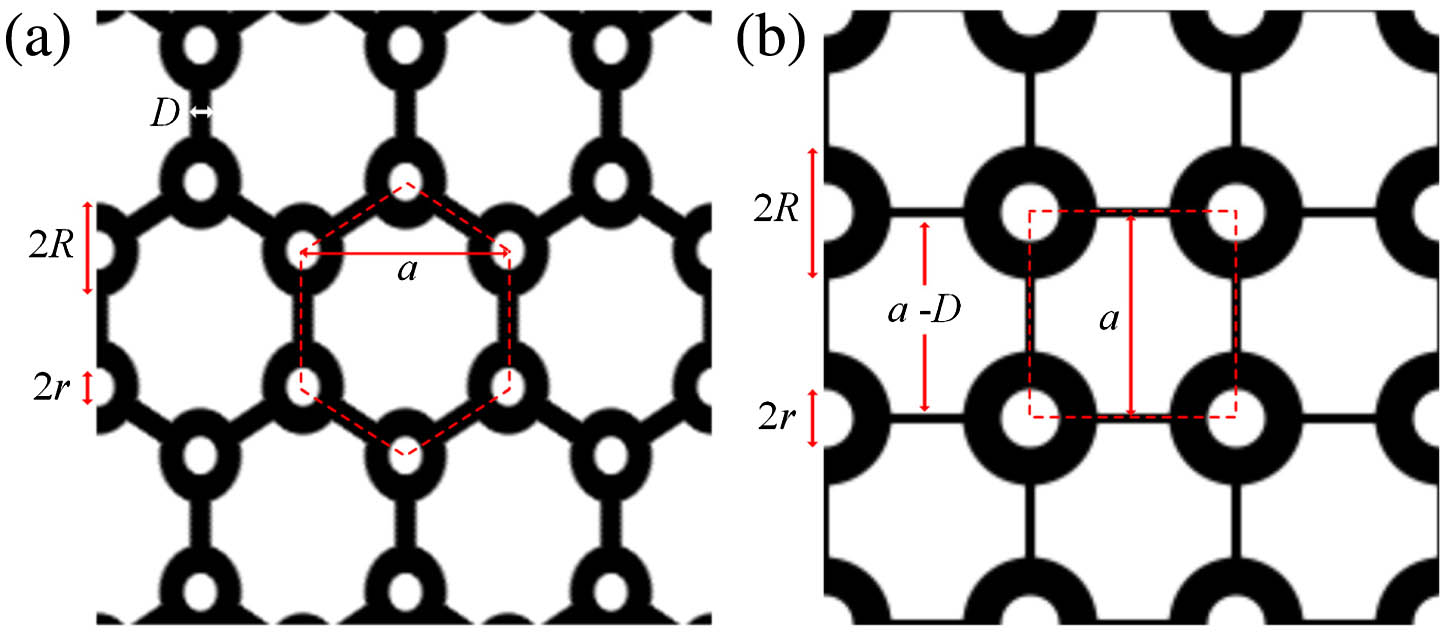
The schematic structures of the proposed CARPC are shown in Fig. 1. The CARPC with a triangular lattice is shown in Fig. 1(a), and Fig. 1(b) shows the CARPC with a square lattice. The black color represents chalcogenide glass and the white color represents air. To be consistent with the previous reports [15,17], the refractive index of the chalcogenide glass is assumed to be of a moderate value of 2.8, and that of air is always 1. Also, as denoted in Fig. 1, is the lattice constant. The outer and inner radii of the chalcogenide glass–air annular rods are and , respectively. The thickness of the chalcogenide veins that connect the annular rods is .
Sign up for Photonics Research TOC. Get the latest issue of Photonics Research delivered right to you!Sign up now
Figure 1.Schematic structures of the proposed CARPCs. The black color represents chalcogenide glass, and the white color represents air. (a) Triangular-lattice CARPC. (b) Square-lattice CARPC.
As shown in Fig. 1, there are three key structural parameters for the triangular- and square-lattice CARPCs. They are , , and . To obtain the CPBG characteristics of the proposed two types of PCs with these three structural parameters, the fully vectorial eigenmodes of Maxwell’s equations are calculated by a preconditioned conjugate-gradient minimization of the block Rayleigh quotient in a planewave basis with periodic boundary conditions [27]. In the computations, each of the three key structural parameters is first scanned with a step of to obtain a preliminary view of the normalized CPBG distribution characteristics. Then to make sure the maximum normalized CPBG would not be missed, the parameter step is reduced to for the interested structural parameter zones where extremely large CPBGs are located. Therefore, to distinguish small changes of structural parameters and also to obtain reasonable accuracy, a high resolution of 64 grids with a mesh size of 3 for a lattice period is adopted.
3. CPBG ENGINEERING
Based on the previous investigations, the maximum normalized CPBG for connected chalcogenide-rod triangular-lattice PC is obtained between band 3 and band 4 [15,17]. Therefore, the CPBGs between these two bands are also selected as the optimized object for the proposed CARPC with triangular lattice. Because the focus of this research is to investigate whether using the feature of annular PCs in addition with the connected PCs could further enhance the CPBG, we focus on the structural parameters related to annular chalcogenide–air rods, which are and . As shown in Figs. 2(a)–2(c), typical normalized CPBG contour maps as functions of and are plotted for of , , and , respectively. In addition, to know how and together influence the CPBG, a contour map as a function of these two parameters is plotted for the optimized of in Fig. 2(d). From systematically sweeping the structural parameters of the triangular lattice CARPC, a maximum normalized CPBG of 5.9% is obtained with , , and , as shown in Figs. 2(b) and 2(d). The normalized PBG is defined as the gap-to-midgap ratio, in which gap is the normalized frequency difference between the two boundary bands, and the midgap means the middle normalized frequency of the PBG. Because of the optimized PC is , that structure is actually the same with the case of connected-solid-rods chalcogenide PC with the triangular lattice, and the obtained maximum normalized CPBG here is also the same as the previously reported [15]. From Figs. 2(a)–2(c), for each there exists an optimized pair of and to support a maximum CPBG. It indicates that introducing annular rods does have an influence on the CPBG. However, one could easily find that, as increases from zero, the normalized CPBG widths all become narrower. Similar phenomena would be also observed in Fig. 2(d). Hence, for the proposed CARPC with triangular lattice, unfortunately, it would not enhance the CPBG in contrary to the expectation.
Figure 2.Typical normalized CPBG bandwidth contour maps for CARPC with the triangular lattice. (a)–(c) Contour maps as functions of outer radius () and inner radius () for vein thickness () of , and , respectively. (d) Contour map as a function of vein thickness () and inner radius () for an optimized outer radius () of .
On the other hand, for square-lattice CARPC, how could the annular structure influence the CPBG, and will it also not enhance the CPBG? The three key structural parameters of square-lattice CARPC are also tailored to obtain the normalized CPBG distribution characteristics. In this PC, based on previous investigations [15], the CPBGs between band 5 and band 6 are selected as the optimizing subjects. As shown in Figs. 3(a)–3(c), typical normalized CPBG contour maps as functions of and are plotted for of , , and , respectively. And Fig. 3(d) also shows a contour map as a function of and for an optimized of . From scanning of the structural parameters of square-lattice CARPC, a maximum normalized CPBG of 13.50% is obtained for , , and , as shown in Figs. 3(b) and 3(d). This value is almost twice as large as the record that we previously found in a connected-solid-rods PC [15], with which only and were tailored to enhance the CPBG. Actually, the connected-solid-rods PC of maximum normalized CPBG bandwidth in Ref. [15] is a special case of our proposed square-lattice CARPC, with unchanged . From Fig. 3, we could find that the maximum normalized CPBGs are all located in the center of the figures. It indicates that to obtain the maximum normalized CPBG in square-lattice CARPC, all three key structural parameters including should be carefully chosen. And the use of annular rods in square-lattice CARPC indeed could enhance the CPBG for an index contrast system of 2.8:1. Thus, for a moderate refractive-index contrast of 2.8:1, the largest CPBG could be obtained in CARPC with square lattice other than with triangular lattice.
Figure 3.Typical normalized CPBG bandwidth contour maps for CARPC with the square lattice. (a)–(c) Contour maps as functions of outer radius () and inner radius () for vein thickness () of , , and , respectively. (d) Contour map as a function of vein thickness () and inner radius () for an optimized outer radius () of .
To understand the physics behind different characteristics of CPBG enhancement for triangular-lattice and square-lattice CARPCs, the photonic band structures with maximum normalized 2D CPBGs for the optimized two types of CARPCs are compared. As shown in Fig. 4, the yellow and green shadows together denote the PBG for TM modes, the yellow and cyan shadows denote the PBG for TE modes, and the yellow shadow denotes the 2D CPBG.
Figure 4.Photonic band structures for the optimized CARPCs with maximum normalized 2D CPBGs. (a) Triangular lattice CARPC with , , and , which is the same with the maximum normalized 2D CPBG shown in Figs. 2(b) and 2(d). (b) Square-lattice CARPC with , , and , which is the same with the maximum normalized 2D CPBG shown in Figs. 3(b) and 3(d). The yellow and green shadows together denote the PBG for TM modes, the yellow and cyan shadows together denote the PBG for TE modes, and the yellow shadow denotes the 2D CPBG.
Figure 4(a) shows the photonic band structure with the maximum normalized 2D CPBG for triangular-lattice CARPC. The band structure is obtained with , , and , which is corresponding to the maximum normalized 2D CPBG shown in Figs. 2(b) and 2(d). For the optimized triangular lattice CARPC, the TE PBG ranges from normalized frequency 0.391390485146213 (with a wave vector at point) to 0.497226160747991 (with a wave vector at point), which denotes a large normalized TE PBG of about 23.82%. Meanwhile, the TM PBG ranges from normalized frequency 0.468717620098929 (with a wave vector at point) to 0.520301536238606 (with a wave vector at point), which also denotes a large normalized TM PBG of about 10.43%. Desperately, for this optimized triangular lattice CARPC, only about half of the TM PBG could be overlaid with a fourth portion of the TE PBG. Therefore, the CPBG for the triangular-lattice CARPC only ranges from normalized frequency 0.468717620098929 to 0.497226160747991, which implies a maximum normalized CPBG of only 5.90% [15].
In comparison, Fig. 4(b) shows the photonic band structure with the maximum normalized 2D CPBG for square-lattice CARPC. The band structure is obtained with , , and , which is corresponding to the maximum normalized 2D CPBG shown in Figs. 3(b) and 3(d). For the optimized square-lattice CARPC, the TE PBG ranges from normalized frequency 0.471926285706863 (with a wave vector at the point) to 0.548004710647034 (with a wave vector at the point), which denotes a large normalized TE PBG of about 14.92%. Meantime, the TM PBG ranges from normalized frequency 0.478696469439636 (with a wave vector at the point) to 0.549261474599597 (with a wave vector at the point), which also denotes a large normalized TM PBG of about 13.73%. More interestingly, most parts of the TM PBG and those of the TE PBG for square-lattice CARPC are overlaid, and thus a broad common normalized frequency zone for CPBG that ranges from normalized frequency 0.478696469439636 to 0.548004710647034 could be observed, which means a maximum normalized CPBG of about 13.50%.
To understand the different CPBG enhancement characteristics of annular holes between triangular-lattice and square-lattice CARPCs, the typical extreme normalized frequencies (the top extreme points in the lower dielectric band and bottom extreme points in the upper air band that fix the CPBG widths) at CPBG edges and the corresponding normalized CPBG widths as functions of are plotted in Fig. 5. Except the changing structural parameter , the other two parameters, and , are fixed with the correspondingly optimized CARPC that supports the maximum CPBG. As shown in Fig. 5(a), the changing of the CPBG edge frequencies with is relatively simple for the triangular lattice CARPCs with and . Amid the increasing of , the extreme frequency (top point) of lower dielectric band (band 3) always has a larger increase rate than the extreme frequency (bottom point) of upper air band (band 4), thus narrowing the normalized CPBG.
Figure 5.Typical extreme normalized frequencies (the top extreme points in the lower dielectric band and bottom extreme points in the upper air band which fix the CPBG widths) at CPBG edges and the corresponding normalized CPBG width as functions of . (a) Triangular lattice CARPCs with and . (b) Square-lattice CARPCs with and .
On the other hand, as shown in Fig. 5(b), for square-lattice CARPCs with and , one may easily find that there exists a kink point at in the normalized CPBG curve. When is below , the extreme frequency (top point) of lower dielectric band (band 5) has a smaller increase rate than the extreme frequency (bottom point) of upper air band (band 6) as increases, which results in widening of normalized CPBG. When is higher than , oppositely, the top of band 5 has a larger increase rate than the bottom of band 6, which causes a decrease of normalized CPBG width. The phenomena could be better observed in the Fig. 6, which shows the evolution of the typical key photonic bands (band 5 and band 6 that determine the CPBG widths) for square-lattice CARPCs with fixed and , but different . From Fig. 6, while the top extreme frequencies in the lower dielectric band (band 5) always have the same wave vector at the point, the bottom extreme frequencies in the upper air band (band 6) always have the same wave vector at the point. And as increases, the air filling factor for the CARPC gets larger accordingly, thus making all the bands go upward. Specifically, when is increased from to and , the top point in band 5 has a smaller increase than the bottom point in band 6, which results in widening of the normalized CPBG. When is further increased from to and , oppositely, the top of band 5 has a larger increase rate than the bottom of band 6, which causes a decrease of normalized CPBG width. Thus, the maximum normalized CPBG width is obtained at the kink point of . Moreover, focusing on the bottom of the air band (band 6) curve in Fig. 5(b), a huge turning near could also be easily found. Therefore, there also would be a transition happening near the kink point.
Figure 6.Evolution of the typical key photonic bands (band 5 and band 6 that determine the CPBG widths) for square-lattice CARPCs with fixed and , but different . The yellow shadow denotes the maximum normalized CPBG width that obtained with , which is the same as that shown in Fig. 4(b).
To further understand the different CPBG enhancement characteristics of annular holes between triangular-lattice and square-lattice CARPCs, the field distributions of the extreme CPBG edge modes for typical inner radii are plotted and investigated. Figure 7 shows the typical field distributions of the extreme CPBG edge modes for the triangular-lattice CARPCs with fixed and , but different . One may easily find that while the Ez (the out-of-plane component of the electric field) field distributions of the extreme lower CPBG edge modes at top of band 3 shown in Figs. 7(a)–7(c) have similar shapes, the Hz (the out-of-plane component of the magnetic field) field distributions of the extreme upper CPBG edge modes at bottom of band 4 shown in Figs. 7(d)–7(f) are also similar. Actually, for triangular lattice CARPCs, as a typical band structure shown in Fig. 4(a), the investigated extreme frequency modes of lower CPBG edge (top of dielectric band) are all with TM polarization, and those of upper CPBG edge (bottom of air band) are all with TE polarization. Thus, amid increased , the extreme frequencies at both the CPBG edges are monotonically changed. Therefore, as shown in the Fig. 5(a), the CPBG edge frequencies and the corresponding normalized CPBG width curves are very polished, and their changing is also relatively simple. Moreover, compared with the Figs. 7(d)–7(f), the Ez fields shown in the Figs. 7(a)–7(c) are intensely located at the annular rods, especially at both the outer chalcogenide material zone and the inner air zone. Thus the modes at the top of dielectric band are more influenced by the annular holes than the modes at the bottom of air band. Therefore as shown in the Fig. 5(a), with the increasing of , the extreme frequency of lower CPBG band (band 3) has a larger increase rate than that of upper CPBG band (band 4).
Figure 7.Typical field distributions of the extreme CPBG edge modes for triangular lattice CARPCs with fixed and , but different . (a) and (d) are with the same . (b) and (e) are with the same . (c) and (f) are with the same . (a)–(c) are Ez field distributions of lower extreme CPBG edge modes at top of band 3 with a wave vector at . (d)–(f) are Hz field distributions of upper extreme CPBG edge modes at bottom of band 4 with a wave vector at .
Relatively, the typical field distributions of the extreme CPBG edge modes for the square-lattice CARPCs shown in Fig. 8 are of more complexity. Although the Ez field distributions of the extreme lower CPBG edge modes at the top of dielectric band shown in Figs. 8(a)–8(d) have similar shapes, the field distributions of the extreme upper CPBG edge modes at the bottom of the air band shown in Figs. 8(e)–8(h) are not in the same form. Actually, when is smaller than , the extreme CPBG edge modes are first with TE polarization, as shown in Figs. 8(e) and 8(f). When is over , the modes change to TM polarization, as shown in Figs. 8(g) and 8(h). Therefore, as we expected previously, a mode transition happens near .
Figure 8.Typical field distributions of the extreme CPBG edge modes for square-lattice CARPCs with fixed and , but different . (a) and (e) are for . (b) and (f) are for . (c) and (g) are for . (d) and (h) are for . (a)–(d) are Ez field distributions of extreme lower CPBG edge modes at top of band 5 with a wave vector at . (e) and (f) are Hz field distributions of extreme upper CPBG edge modes at bottom of band 6 with a wave vector at . (g) and (h) are Ez field distributions of extreme upper CPBG edge modes at bottom of band 6 with a wave vector at .
More specifically, as shown in the Figs. 8(a)–8(d), all the Ez fields tend to be more likely located at the outer chalcogenide dielectric zone. So, as increases from zero, firstly because is with small values, a small increase of does not affect much. Thus, the extreme frequency of lower dielectric band (band 5) shown in Fig. 5(b) has only a smaller increase rate. When is bigger, a small increase of would mean a large decrease of chalcogenide dielectric volume, which would result in considerable change of the extreme frequency of the lower dielectric band (band 5), as we also have observed in Fig. 5(b). On the other hand, for the Figs. 8(e)–8(h), when is not larger than , although the Hz fields are more likely focused on the annular chalcogenide dielectric zone, there are also considerable Hz field distributions in the surrounding air zone. As increases, the amplitude of the surrounding Hz field is getting large faster. So in Fig. 5(b), the extreme frequency of the upper air band (band 6) has a larger increase rate than that of the lower dielectric band (band 5). When is beyond , mode transition occurs, and the extreme frequency of the upper air band is all with TM polarization. In that situation, Ez fields are more likely focused on the surrounding air zone, and only a small portion of Ez fields retain in the annular chalcogenide rods. Amid the increasing of , the Ez field amplitude in the surrounding air zone does not change much, and only that in the annular chalcogenide dielectric zone has a small increase. Thus, as observed in Fig. 5(b), the extreme frequency of band 5 has a larger increase rate than that of band 6, which leads to a decrease of the normalized CPBG width. All these phenomena are in accordance with previous reports about the photonic band: if the fields are more focused on air of smaller index or are less accumulated in the dielectric of higher index, then the dispersion curves would be pulled up to higher frequency more quickly [28,29].
5. ENHANCED CPBG FOR LOWER REFRACTIVE-INDEX CONTRAST CHALCOGENIDE-AIR SYSTEMS
As presented in the previous sections, what is also worth noting is that the CPBG widths are highly enhanced by using annular structure in the square-lattice CARPC with a chalcogenide–air refractive index contrast of 2.8:1. Could this favorable enhancement of the CPBG in the proposed square-lattice CARPC be further extended to lower chalcogenide–air refractive-index contrast? As shown in Fig. 9, normalized CPBGs as a function of refractive index of material for different optimized square-lattice PCs are plotted. The black curve is for the referenced connected-solid-rods chalcogenide PC with structural parameters of , , and , which obtained the maximum CPBG in Ref. [15]. The red curve with solid circles is for the CARPC with structural parameters of , , and , which supports the maximum normalized CPBG for chalcogenide glass index of 2.8 and is also corresponding to Fig. 4(b). From Fig. 9, although the referenced connected-solid-rods chalcogenide PC closes its CPBG with a higher refractive-index contrast of 2.48:1 [15], the CPBG for the CARPC, which was optimized for the index contrast of 2.8:1, can extend to a lower refractive-index contrast of 2.33:1. More specifically, for the refractive index contrast ranging from 2.33 to 4, the proposed optimized CARPCs with a square lattice all possess a larger CPBG width.
Figure 9.Normalized CPBG as a function of refractive index of material for three different optimized square-lattice PCs. The black curve is for the referenced connected-solid-rods chalcogenide PC with , , and , which obtained the maximum normalized CPBG reported in Ref. [15]. The red curve with solid circles denotes the CARPC with , , and , which obtains the maximum normalized CPBG for chalcogenide glass of index 2.8 and that is corresponding to Fig. 4(b). The blue curve with void circles is for the CARPC with structural parameters , , and , which obtains the maximum normalized CPBG for chalcogenide glass of index 2.34.
Then, with a chalcogenide–air index contrast of 2.34:1, which is only 0.01 larger than the close index contrast for the previously optimized square-lattice CARPC, a further tailoring of the structural parameters of the square-lattice CARPC was performed to explore if the CPBG could be further enhanced. The index of 2.34 could be found in near the wavelength of 1535 nm. In this case, an optimized maximum normalized CPBG of 2.22% could be obtained with , , and , and its band structure is shown in Fig. 10(a). As the yellow long shadow zone shown in the figure, the CPBG is just the same as the TM PBG, and it ranges from normalized frequency 0.540976218045288 (with a wave vector at the point) to 0.553136564955634 (with a wave vector at the point). Meantime, a larger TE PBG of about 5.61% also could be observed, which ranges from normalized frequency 0.527381544557749 (with a wave vector at the point) to 0.55781019442515 (with a wave vector at the point). The partial PBGs in the square direction are also labeled in Fig. 10(a). The yellow and green short shadows together denote the partial PBG for TM modes, the yellow and cyan short shadows together denote the partial PBG for TE modes, and the yellow shadow denotes the 2D partial CPBG. By using the structural parameters of the new optimized square-lattice CARPC, normalized CPBG as a function of refractive index of material is also plotted in Fig. 9. As shown by the blue curve with void circles, the close refractive-index contrast to support CPBG can be further reduced to as low as 2.24:1. Compared to the other two curves in Fig. 10, these new structural parameters are powerful to obtain larger CPBG with index contrasts that are below 2.42:1. However, for an index contrast larger than 2.42:1 but lower than 2.62, the CPBGs for the new optimized PC are only larger than the reference PC but narrower than the optimized CARPC for 2.8:1.
Figure 10.Photonic band structure, reflectivity spectra, and key configuration of the time domain simulation for the optimized square-lattice CARPC of index contrast 2.34:1. (a) Photonic band structure for CARPC with , , and . (b) TE and TM reflectivity spectra of the square-lattice CARPC reflector. (c) Key configurations of the time domain simulation of the reflector. Black region denotes chalcogenide, while white region denotes air. denotes the Gaussian line optical source, and and are two flux detectors, respectively.
To further confirm how reliable the CPBGs obtained in the square-lattice CARPC are, as an example, the polarization-independent reflector is theoretically demonstrated by directly making use of the optimized square-lattice CARPC of low index contrast 2.34:1. As shown in Fig. 10(b), TE and TM reflectivity spectra of the reflector are calculated by the MEEP software [30]. Figure 10(c) shows the key configurations of the time domain simulations. The reflectivity spectra are calculated by doing two simulations. One is performed for the structure without the PC reflector, which is used for normalizing the reflectivity. The other simulation is performed with the whole structure exactly the same with that shown in Fig. 10(c), in which the PC reflector is added in the center. For the latter, when the Gaussian line optical source excites, light will propagate in the chalcogenide glass zone, then suffering reflection and coupling at the PC interface. As the light propagation is along the direction, the propagation light will therefore suffer partial PBGs [29,31]. Although there are only 5 periods in the direction, high reflectivities of nearly unity for frequency band widths of () and () are obtained for TE and TM polarizations, respectively. The boundary frequencies of the high reflectivity bandwidth shown in Fig. 10(b) match very well with the partial PBGs shown in Fig. 10(a). Similarly, we have also compared the band structure of partial PBGs with the reflectivity bandwidth obtained by light propagation along the direction of the PC, and they also match very well. Those phenomena prove our investigation results are reliable.
In addition, a point cavity center in a square-lattice CARPC with index contrast of 2.34:1 is also theoretically demonstrated. It is shown that the cavity could support both TE and TM resonance modes in the CPBG. Figure 11 shows the quality factors of the resonance cavity modes as a function of the number of square rings surrounding the defect, and it also shows the field distributions of the cavity modes for the two polarizations. The left upper inset of Fig. 11(a) also shows a schematic structure of the square-lattice CARPC cavity. The cavity is formed by filling the center zone of CARPC with chalcogenide glass. For simplification, we only consider the cavity with a fixed defect, which is surrounded by the first square ring of annular rods. Outside the cavity zone, there are totally seven square rings of annular rods surrounding the defect. Actually during our investigation, we vary the number of the outer square rings of annular rods , from 4 to 12 with a step 1. As shown in Fig. 11(a), increasing the number , the value hugely increases due to existing CPBG of the CARPC. Similar behavior was previously explained in MIT’s photonic crystal book [29]. And when is 12, high values of 1,559,395 (with normalized frequency of 0.549451784753774) and of 209,870 (with normalized frequency of 0.548481964312863) are obtained in the square-lattice CARPC cavity for TE and TM resonance modes, respectively. In our investigation, the values are obtained by using the Harminv command in the MEEP software [30], accompanied by running very narrow-bandwidth point sources. Figures 11(b) and 11(c) show the Hz and Ez field distributions (snapshots) of the resonance cavity with of 7 for TE and TM polarization modes, respectively. From these two figures, both fields are clearly localized around the defect in the center. We have also made two movies showing TE and TM resonances in one period time in the cavity. You may check Visualization 1 and Visualization 2 for clearer observation. Thus, we could make sure that the CPBG obtained by CARPC with index contrast 2.34:1 also offers tight optical confinement.
Figure 11.Quality factor of the square-lattice CARPC cavity as a function of the number of square rings surrounding the defect and field distributions of the cavity modes for the two polarizations. (a) Quality factor of the square-lattice CARPC cavity as a function of the number of square rings surrounding the defect, and the left upper inset shows a schematic structure of the square-lattice CARPC cavity with of 7. (b) The Hz field for TE cavity mode having a value of 19,234 (see Visualization 1 for a movie of the resonance). (c) The Ez field for TM cavity mode having a value of 3,989 (see Visualization 2 for a movie of the resonance).
In conclusion, CARPCs inheriting characteristics from both annular PC and connected-solid-rods PCs are proposed and investigated to enhance the 2D CPBG for moderate refractive index contrast material systems. For typical index contrast of 2.8:1, while the triangular lattice CARPC is not able to enhance the CPBG, the optimized square lattice CARPC exhibits significantly larger normalized CPBG of about 13.50%. The value is almost twice as large as our previously reported result [15]. Moreover, the CPBG of the square-lattice CARPC could remain existing until a record low index contrast of 2.24:1. The result not only favors wideband CPBG applications for index contrast systems near 2.8:1, but also makes various optical applications that rely on CPBG possible for moderate index contrast systems. Immediately making use of the large CPBG obtained by square-lattice CARPC of a low index contrast 2.34:1, both the polarization-independent reflector and the point defect microcavity are theoretically demonstrated. Based on our study in this paper, other useful applications like polarization-independent waveguide devices and emitters and slow light fibers in moderate index contrast systems also can be suitably designed. We also notice that although the lowest index contrast (2.24:1) to support the 2D CPBG obtained in this paper is still bigger than the typical lower boundary chalcogenide–air index contrast (about 2:1), the steady progress of reduced refractive-index contrast for a CPBG also suggests that further reducing this contrast in the future would be possible.
[6] F. Koohi-Kamali, M. K. Moravvej-Farshi, M. Ebnali-Heidari. Dispersion compensation of 40 Gb/s data by phase conjugation in slow light engineered chalcogenide and silicon photonic crystal waveguides. 23rd Iranian Conference on Electrical Engineering, 1209-1214(2015).
[18] A. Labbani, L. Jouablia, A. Benghalia. Analysis of absolute photonic band gaps in two-dimensional photonic crystals based on CdSe rods embedded in TiO2 matrix. 21st IEEE International Conference on Electronics, Circuits and Systems (ICECS), 726-729(2014).