• Journal of Semiconductors
  • Vol. 41, Issue 10, 102401 (2020)
Elyes Garoudja1, Walid Filali1, Slimane Oussalah2, Noureddine Sengouga3, and Mohamed Henini4
Author Affiliations
  • 1Plateforme Technologique de Microfabrication, Centre de Développement des Technologies Avancées, cité 20 août 1956, Baba Hassen, Algiers, Algeria
  • 2Microelectronics and Nanotechnology Division, Centre de Développement des Technologies Avancées, cité 20 août 1956, Baba Hassen, Algiers, Algeria
  • 3Laboratory of Metallic and Semiconducting Materials, Université de Biskra, B.P 455, 07000 Biskra RP, Algeria
  • 4School of Physics and Astronomy, Nottingham Nanotechnology and Nanoscience Center, University of Nottingham, Nottingham, NG7 2RD, UK
  • show less
    DOI: 10.1088/1674-4926/41/10/102401 Cite this Article
    Elyes Garoudja, Walid Filali, Slimane Oussalah, Noureddine Sengouga, Mohamed Henini. Comparative study of various methods for extraction of multi- quantum wells Schottky diode parameters[J]. Journal of Semiconductors, 2020, 41(10): 102401 Copy Citation Text show less
    (Color online) The Schottky diode parameters extraction strategy.
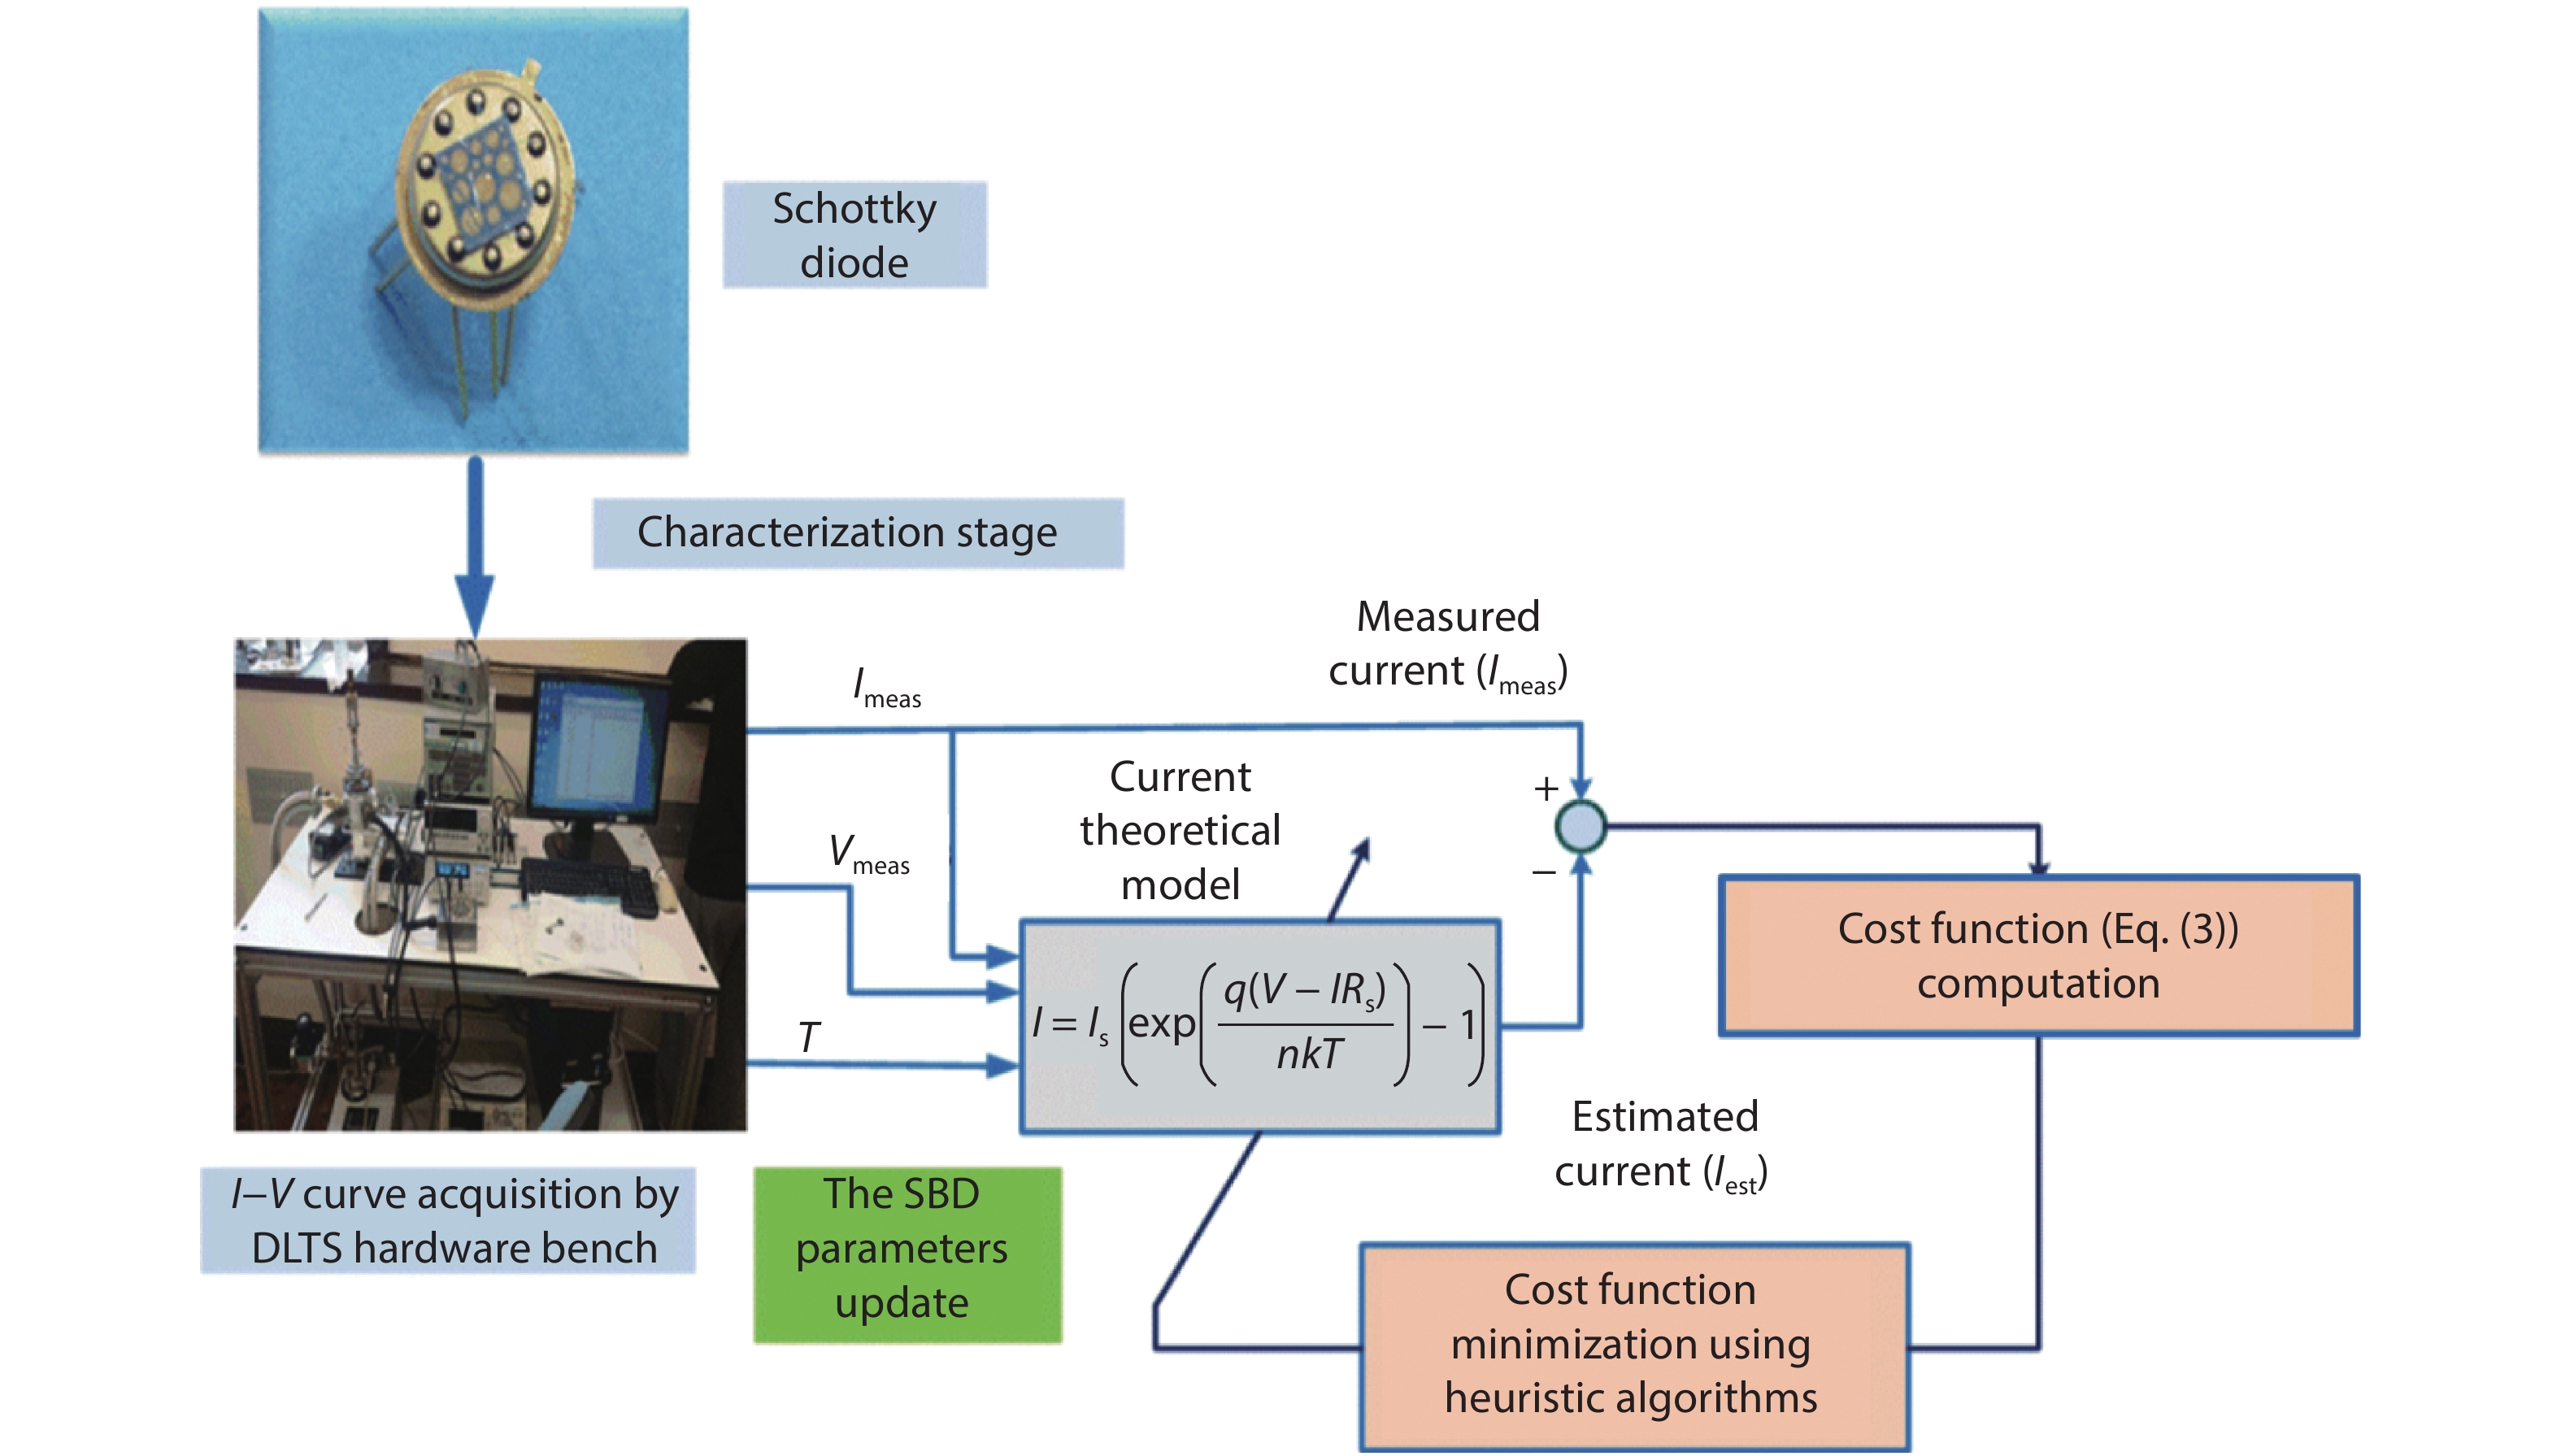
    Fig. 1. (Color online) The Schottky diode parameters extraction strategy.
    (Color online) The DLTS characterization bench at Nottingham University.
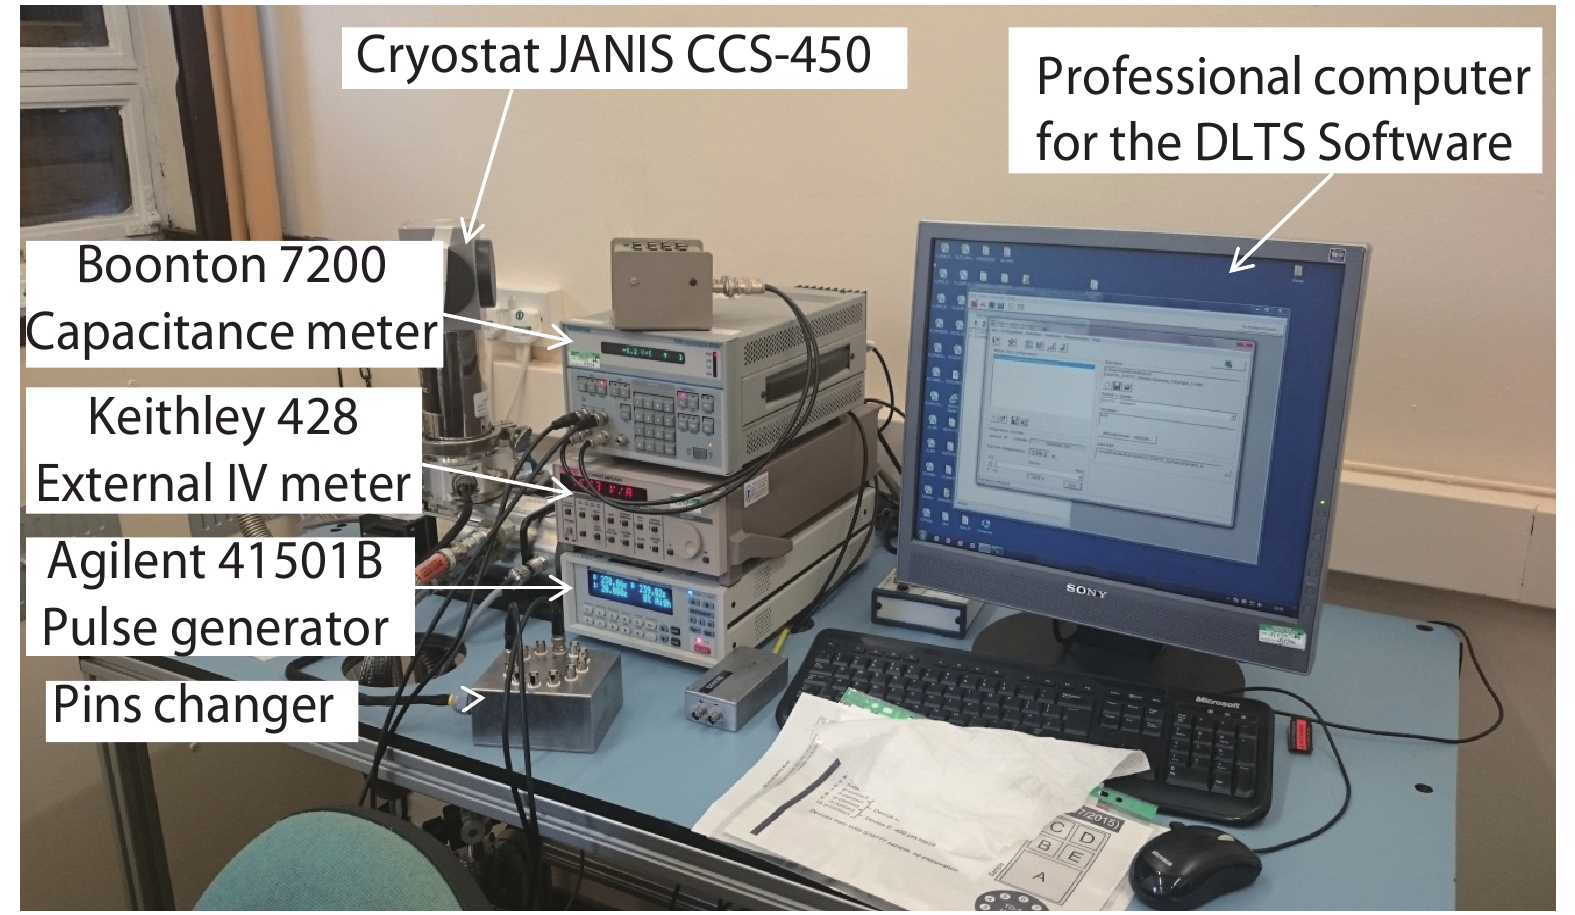
    Fig. 2. (Color online) The DLTS characterization bench at Nottingham University.
    (Color online) The I–V characteristics of n-type Al0.33Ga0.67As Schottky diode for different temperatures.
    Fig. 3. (Color online) The I–V characteristics of n-type Al0.33Ga0.67As Schottky diode for different temperatures.
    (Color online) Experimental and simulated I–V characteristics from 0 to 0.7 V at 100 K.
    Fig. 4. (Color online) Experimental and simulated I–V characteristics from 0 to 0.7 V at 100 K.
    (Color online) Experimental and simulated I–V characteristics from 0 to 0.7 V at 300 K.
    Fig. 5. (Color online) Experimental and simulated I–V characteristics from 0 to 0.7 V at 300 K.
    (Color online) Convergence characteristics of DE, PSO and ABC algorithms for T = 100 K.
    Fig. 6. (Color online) Convergence characteristics of DE, PSO and ABC algorithms for T = 100 K.
    (Color online) Variation of RMSE at each running cycle for DE, PSO and ABC algorithm for T = 100 K.
    Fig. 7. (Color online) Variation of RMSE at each running cycle for DE, PSO and ABC algorithm for T = 100 K.
    DEPSOABC
    Population size: 40 CR: 0.2 MF: 0.5 Swarm size: 100 Inertia weight: 0.4–0.7 C1, C2: 1.2,1.6 Colony size: 160 Limit: 3 × 160 = 480 Cycle: 5000
    Table 1. The setting parameters of DE, PSO and ABC algorithms.
    ParameterIs (A) nRs (Ω)
    Variation boundary[10–9, 10–6] [0, 20][0, 104]
    Table 2. The variation range of SBD parameters.
    TemparatureParameterDEPSOABCCheung
    T = 100 K Is1.069 × 10–71.352 × 10–74.816 × 10–75.00 × 10⁻⁸
    n9.60210.07613.288.61
    Rs1.717 × 1031.633 × 1031.286 × 1032217.09
    фb0.1760.1740.1630.20
    RMSE1.816 × 10–72.715 × 10–72.131 × 10–61.064 × 10⁻⁵
    Mean1.816 × 10–71.086 × 10–72.693 × 10–6
    STD8.050 × 10–221.487 × 10–74.180 × 10–7
    T = 120 K Is1.105 × 10–71.083 × 10–71.784 × 10–75.00 × 10⁻⁸
    n7.9077.8758.6647.12
    Rs1.630 × 1031.637 × 1031.520 × 1032.114 × 103
    фb0.2140.2150.200.24
    RMSE1.679 × 10–71.690 × 10–71.498 × 10–61.305 × 10⁻⁵
    Mean1.679 × 10–76.763 × 10–82.635 × 10–6
    STD2.813 × 10–229.261 × 10–84.234 × 10–7
    T = 160 K Is1.437 × 10–71.402 × 10–79.953 × 10–76.00 × 10⁻⁸
    n5.9625.9379.9355.27
    Rs1.483 × 1031.482 × 1034.58 × 1021.875 × 103
    фb0.2900.2910.260.33
    RMSE4.011 × 10–74.116 × 10–72.601 × 10–61.394 × 10⁻⁵
    Mean4.011 × 10–71.646 × 10–72.831 × 10–6
    STD1.123 × 10–212.254 × 10–74.306 × 10–7
    Table 3. The obtained results for the temperature range (100–160 K).
    TemparatureParameterDEPSOABCCheung
    T = 200 K Is2.347 × 10–72.304 × 10–75.560 × 10–77.00 × 10⁻⁸
    n5.0645.0516.2044.19
    Rs1.282 × 1031.280 × 1031.017 × 1031.758 × 103
    фb0.3620.3630.3470.42
    RMSE7.96 × 10–78.005 × 10–71.441 × 10–61.829 × 10⁻⁵
    Mean7.968 × 10–73.202 × 10–72.970 × 10–6
    STD5.989 × 10–224.384 × 10–78.012 × 10–7
    T = 220 K Is9.245 × 10–79.165 × 10–71 × 10–68.00 × 10⁻⁸
    n6.6236.6046.7993.79
    Rs4.871 × 1024.92 × 1024.405 × 1021.736 × 103
    фb0.3760.3760.3750.46
    RMSE2.119 × 10–62.149 × 10–62.211 × 10–62.315 × 10⁻⁵
    Mean2.119 × 10–68.596 × 10–73.134 × 10–6
    STD9.470 × 10–221.177 × 10–62.519 × 10–7
    T = 240 K Is1.212 × 10-71.364 × 10–78.229 × 10–71.00 × 10⁻⁷
    n3.3723.4866.0783.46
    Rs1.799 × 1031.622 × 103100.231.693 × 103
    фb0.4560.4540.4160.51
    RMSE1.768 × 10–85.763 × 10–84.810 × 10–64.147 × 10⁻⁵
    Mean1.768 × 10–82.307 × 10–86.223 × 10–6
    STD1.544 × 10–223.159 × 10–86.973 × 10–7
    T = 300 K Is2.063 × 10–74.208 × 10–78.450 × 10–81.00 × 10⁻⁷
    n2.7623.4682.8742.82
    Rs1.560 × 1036.496 × 10217.6761.480 × 103
    фb0.5680.5490.5910.63
    RMSE2.539 × 10–83.959 × 10–79.856 × 10–61.971 × 10⁻⁴
    Mean2.539 × 10–81.583 × 10–71.329 × 10–5
    STD3.766 × 10–222.168 × 10–71.170 × 10–5
    Table 4. The obtained results for the temperature range (200–300 K).
    Elyes Garoudja, Walid Filali, Slimane Oussalah, Noureddine Sengouga, Mohamed Henini. Comparative study of various methods for extraction of multi- quantum wells Schottky diode parameters[J]. Journal of Semiconductors, 2020, 41(10): 102401
    Download Citation