• Chinese Optics Letters
  • Vol. 20, Issue 3, 031302 (2022)
Liping Zhou1、2, Chengli Wang1、2, Ailun Yi1、3, Chen Shen1, Yifan Zhu1、2, Kai Huang1, Min Zhou1, Jiaxiang Zhang1、2、*, and Xin Ou1、2、**
Author Affiliations
  • 1State Key Laboratory of Functional Materials for Informatics, Shanghai Institute of Microsystem and Information Technology, Chinese Academy of Sciences, Shanghai 200050, China
  • 2Center of Materials Science and Optoelectronics Engineering, University of Chinese Academy of Sciences, Beijing 100049, China
  • 3XOI Technology Co., Ltd., Shanghai 201899, China
  • show less
    DOI: 10.3788/COL202220.031302 Cite this Article Set citation alerts
    Liping Zhou, Chengli Wang, Ailun Yi, Chen Shen, Yifan Zhu, Kai Huang, Min Zhou, Jiaxiang Zhang, Xin Ou. Photonic crystal nanobeam cavities based on 4H-silicon carbide on insulator[J]. Chinese Optics Letters, 2022, 20(3): 031302 Copy Citation Text show less
    (a) Scanning electron microscope image of a suspended 1D nanobeam PhC cavity. (b) Zoom-in side view image of the PhC cavity, where th is the slab thickness. (c) Zoom-in top view image of the 1D-PhC cavity. The nominal unit cell is parameterized by a (lattice constant, hole to hole distance), w (beam width), hx (air hole length), and hy(air hole width).
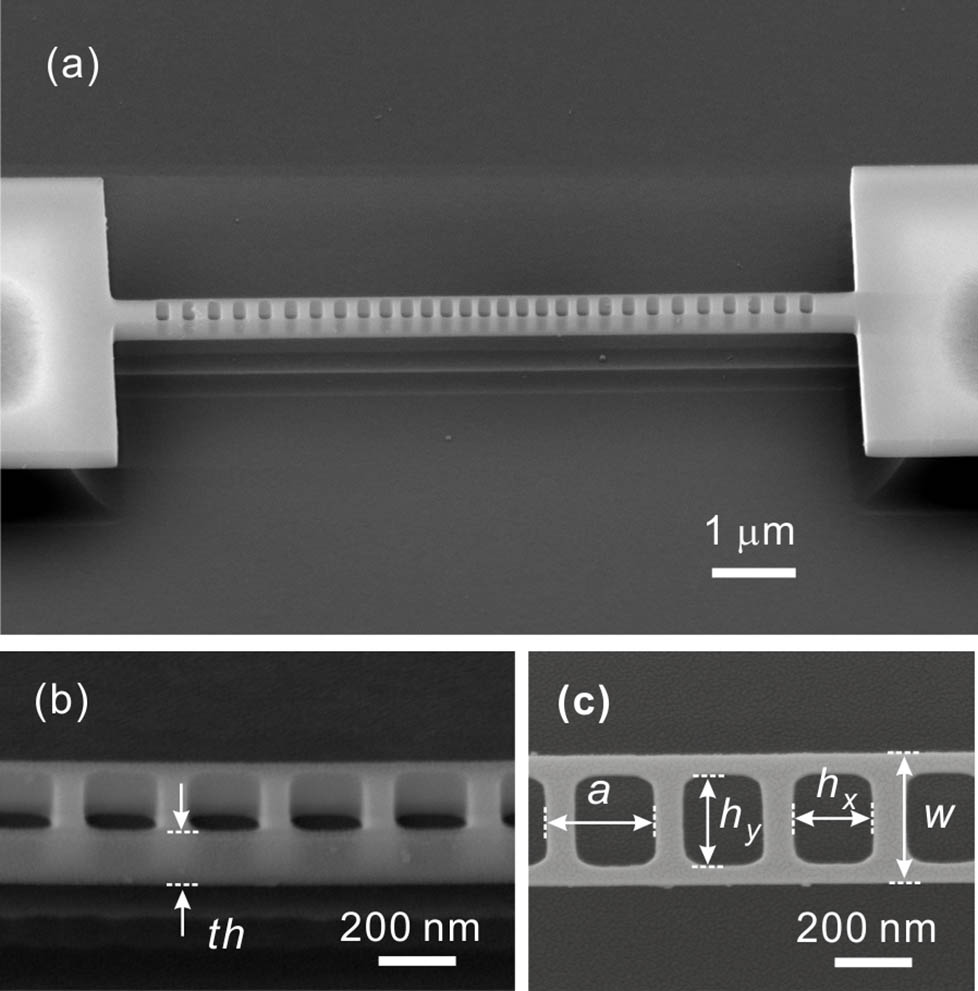
    Fig. 1. (a) Scanning electron microscope image of a suspended 1D nanobeam PhC cavity. (b) Zoom-in side view image of the PhC cavity, where th is the slab thickness. (c) Zoom-in top view image of the 1D-PhC cavity. The nominal unit cell is parameterized by a (lattice constant, hole to hole distance), w (beam width), hx (air hole length), and hy(air hole width).
    (a) Experimentally measured PL spectrum (blue line) and 3D-FDTD simulation spectrum (purple line) from a PhC with a lattice constant of 290 nm. Resonance peaks in the simulated spectrum show a good consistence with the experimental results at room temperature, especially the TE-like polarized modes. (b)–(d) 3D finite-element-method (FEM) simulated optical profiles (Ey component) of the (b) TE0, (c) TE1, and (d) TE2 modes.
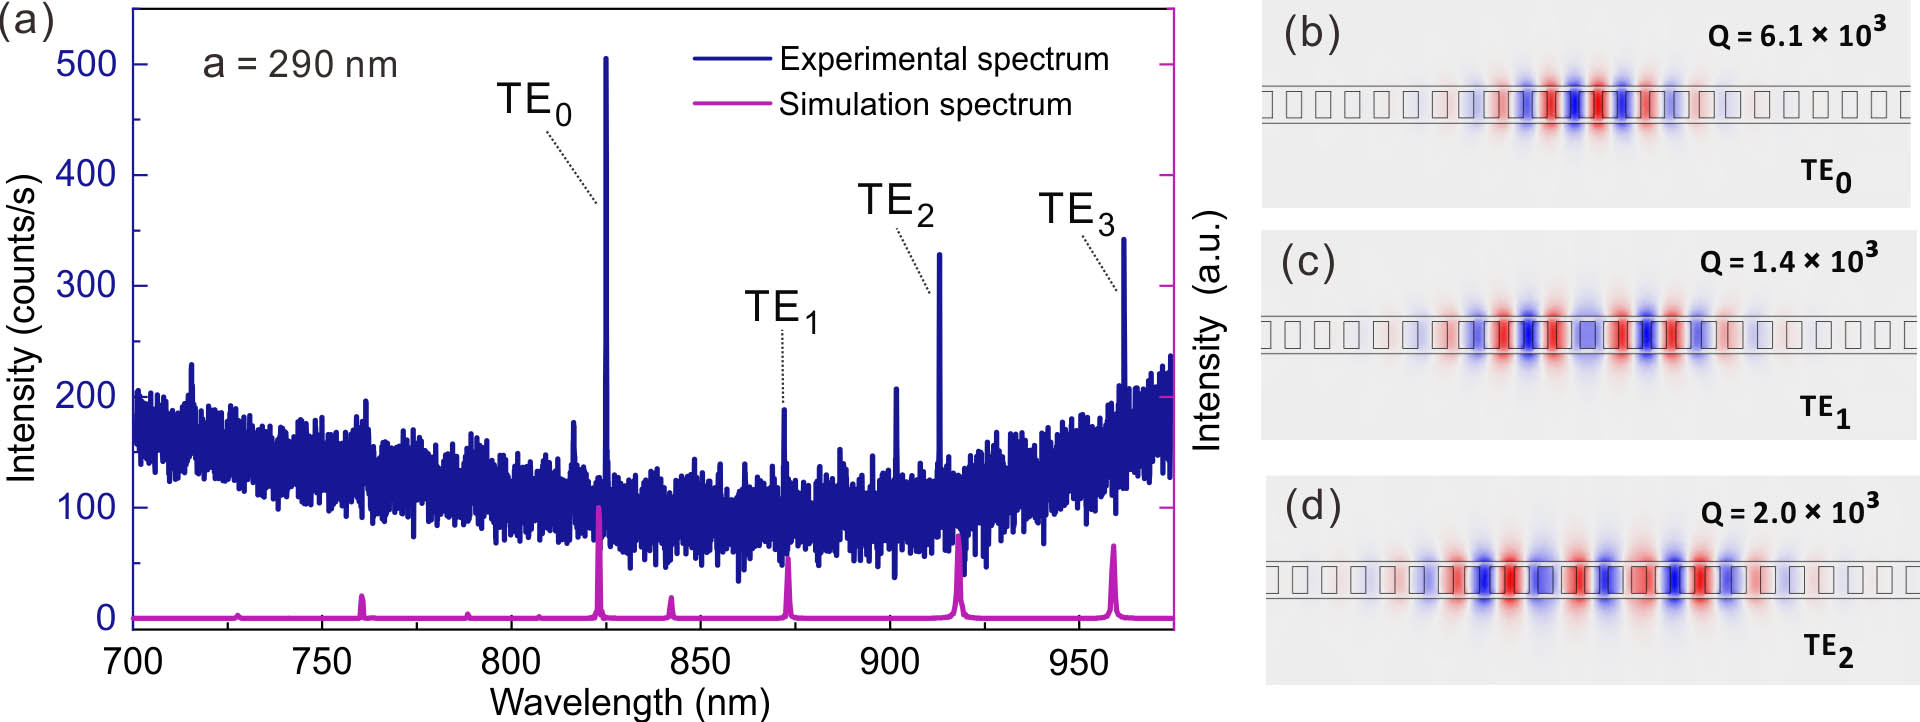
    Fig. 2. (a) Experimentally measured PL spectrum (blue line) and 3D-FDTD simulation spectrum (purple line) from a PhC with a lattice constant of 290 nm. Resonance peaks in the simulated spectrum show a good consistence with the experimental results at room temperature, especially the TE-like polarized modes. (b)–(d) 3D finite-element-method (FEM) simulated optical profiles (Ey component) of the (b) TE0, (c) TE1, and (d) TE2 modes.
    (a) PL spectra of 1D-PhC cavities with lattice constants of 270 nm and 290 nm. The fundamental TE-like modes are located at 753.8 nm and 825.4 nm, respectively. (b), (c) Normalized PL spectra and theoretical fitting (red lines) of the TE0 modes for cavities with lattice constants of (b) 270 nm and (c) 290 nm.
    Fig. 3. (a) PL spectra of 1D-PhC cavities with lattice constants of 270 nm and 290 nm. The fundamental TE-like modes are located at 753.8 nm and 825.4 nm, respectively. (b), (c) Normalized PL spectra and theoretical fitting (red lines) of the TE0 modes for cavities with lattice constants of (b) 270 nm and (c) 290 nm.
    (a) Measured PL spectra as a function of the excitation power. (b) Resonance shift of the TE-like modes (rectangle for TE0, circle for TE2, triangle for TE3) as a function of excitation power.
    Fig. 4. (a) Measured PL spectra as a function of the excitation power. (b) Resonance shift of the TE-like modes (rectangle for TE0, circle for TE2, triangle for TE3) as a function of excitation power.
    Liping Zhou, Chengli Wang, Ailun Yi, Chen Shen, Yifan Zhu, Kai Huang, Min Zhou, Jiaxiang Zhang, Xin Ou. Photonic crystal nanobeam cavities based on 4H-silicon carbide on insulator[J]. Chinese Optics Letters, 2022, 20(3): 031302
    Download Citation