• Photonics Research
  • Vol. 11, Issue 5, 757 (2023)
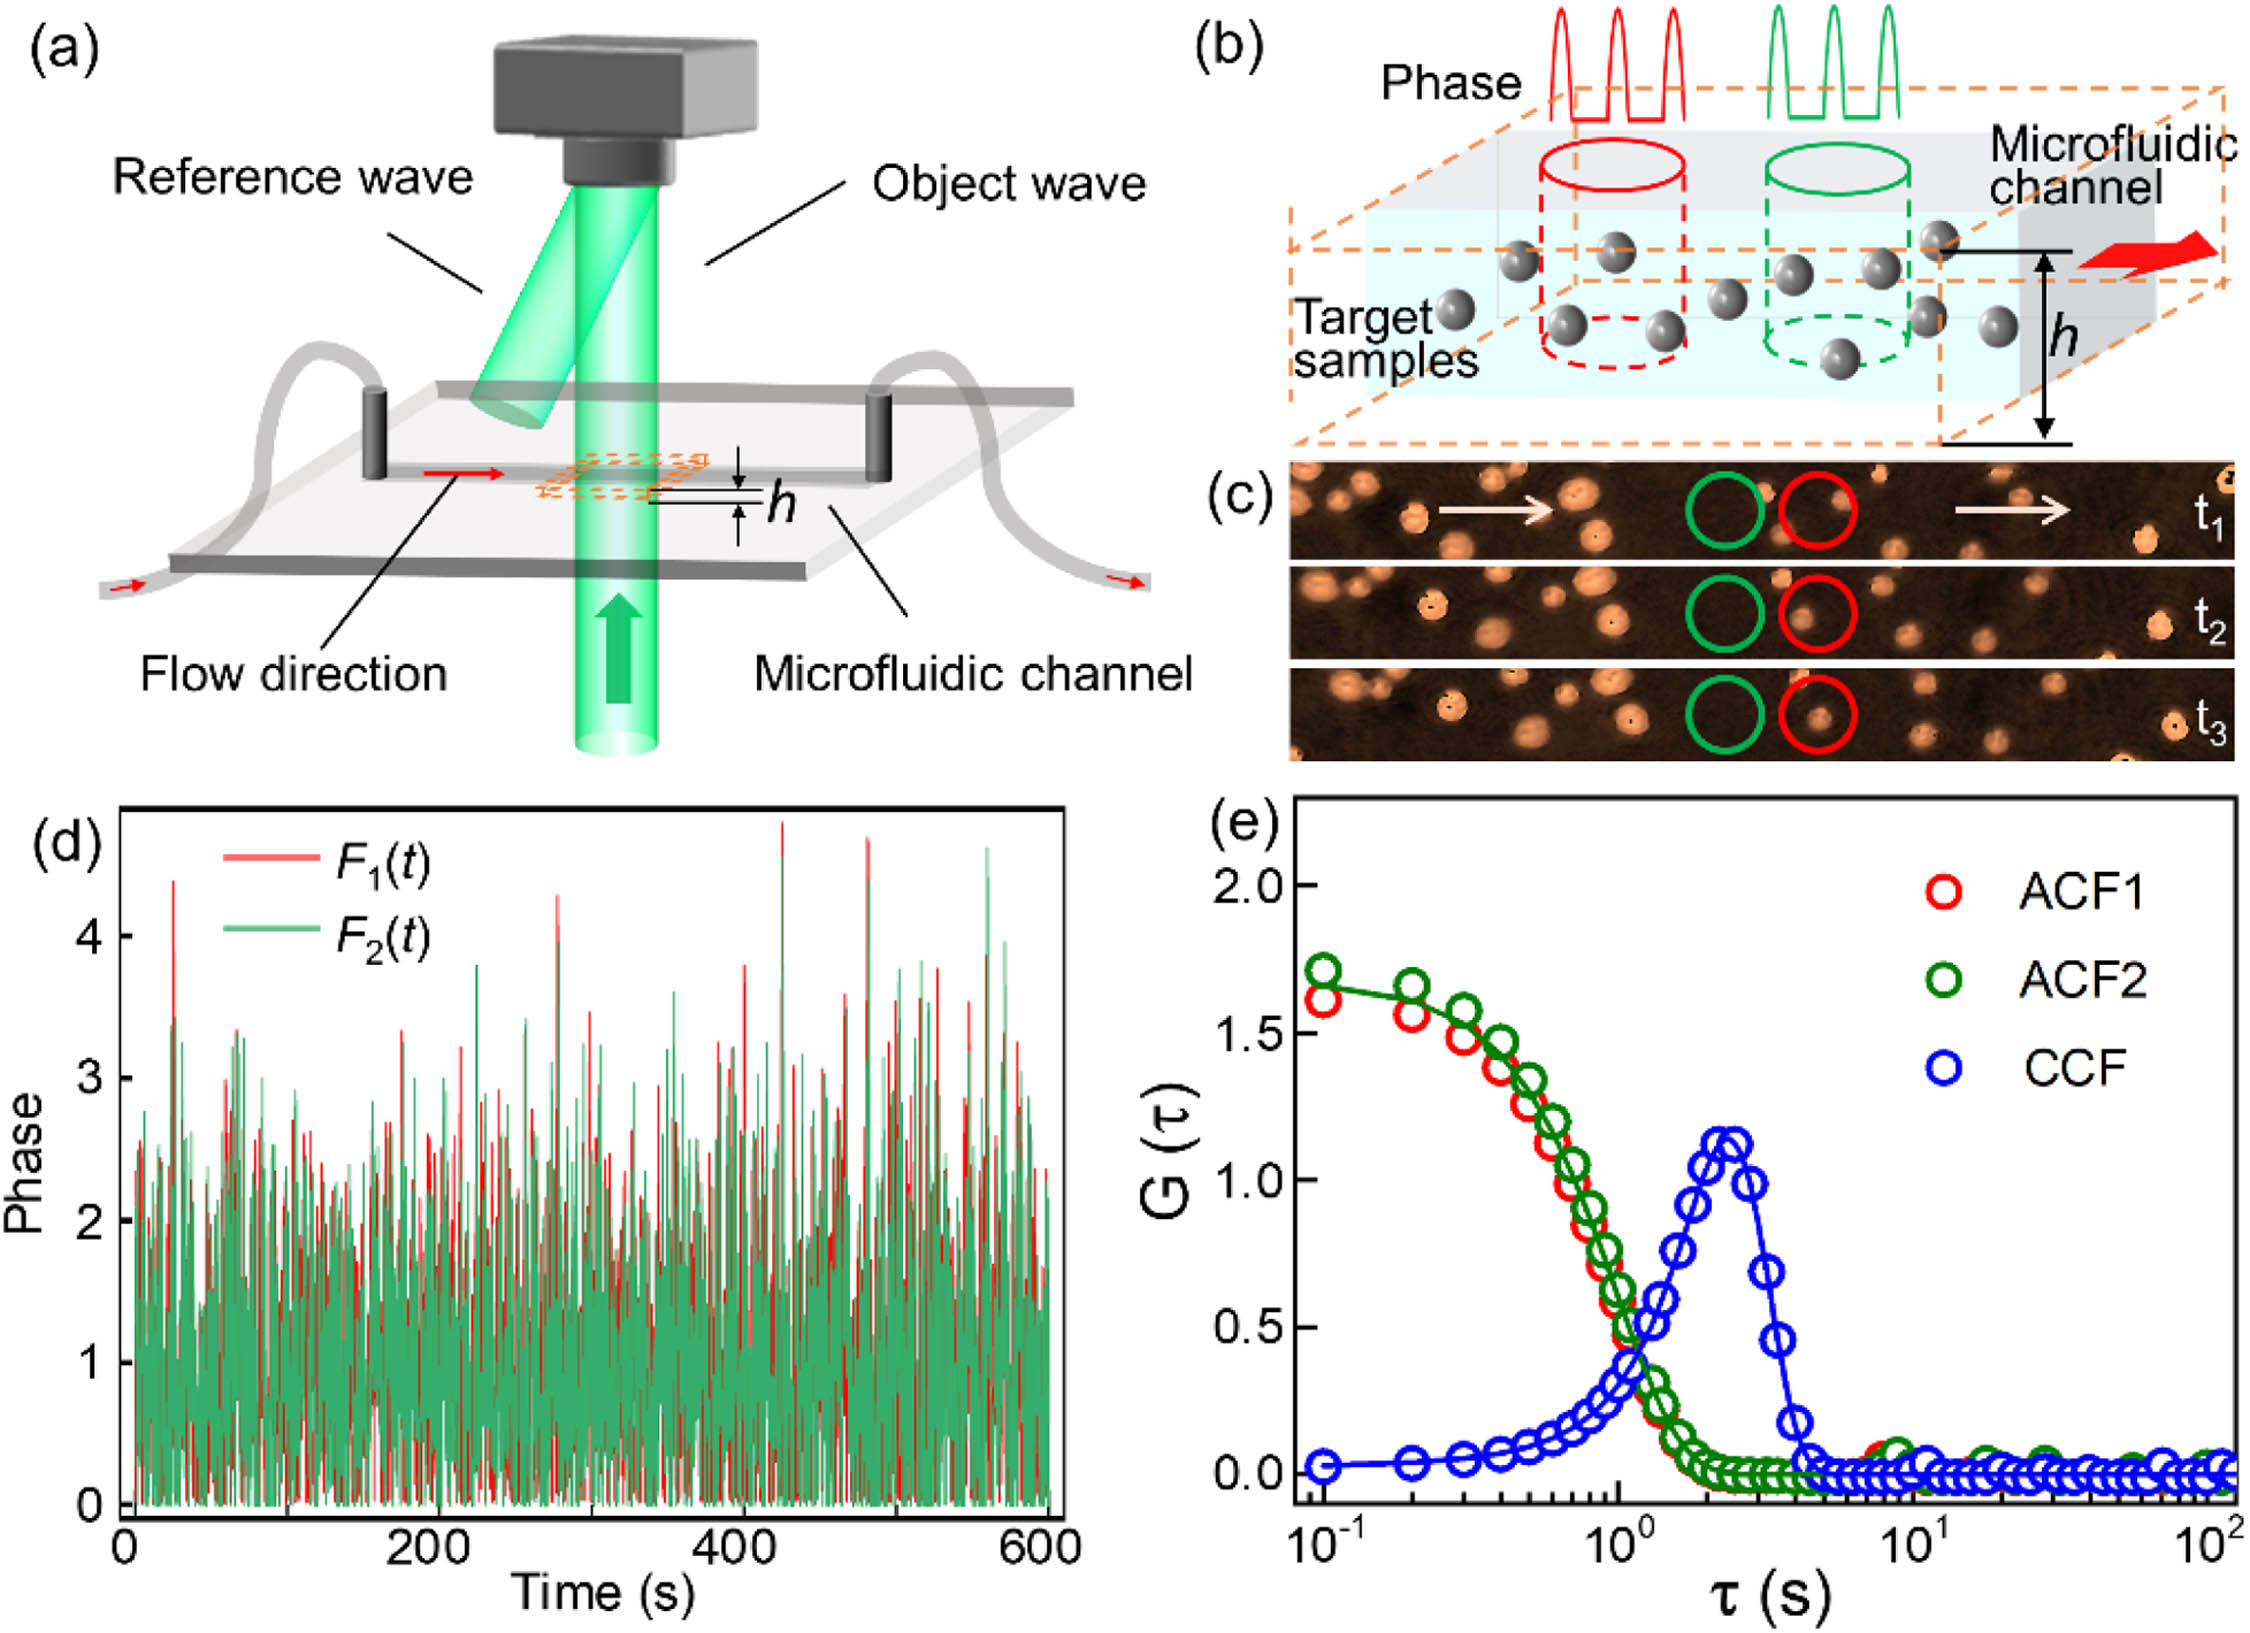
Lan Yu1, Yu Wang1, Yang Wang1, Kequn Zhuo1, Min Liu1、6、*, G. Ulrich Nienhaus2、3、4、5、7、*, and Peng Gao1、8、*
Author Affiliations
  • 1School of Physics, Xidian University, Xi’an 710071, China
  • 2Institute of Applied Physics, Karlsruhe Institute of Technology, 76128 Karlsruhe, Germany
  • 3Institute of Nanotechnology, Karlsruhe Institute of Technology, 76344 Eggenstein-Leopoldshafen, Germany
  • 4Institute of Biological and Chemical Systems, Karlsruhe Institute of Technology, 76344 Eggenstein-Leopoldshafen, Germany
  • 5Department of Physics, University of Illinois at Urbana-Champaign, Urbana, Illinois 61801, USA
  • 6e-mail: lium@xidian.edu.cn
  • 7e-mail: uli@uiuc.edu
  • 8e-mail: peng.gao@xidian.edu.cn
  • show less
    DOI: 10.1364/PRJ.485575 Cite this Article Set citation alerts
    Lan Yu, Yu Wang, Yang Wang, Kequn Zhuo, Min Liu, G. Ulrich Nienhaus, Peng Gao. Two-beam phase correlation spectroscopy: a label-free holographic method to quantify particle flow in biofluids[J]. Photonics Research, 2023, 11(5): 757 Copy Citation Text show less
    Principle of 2B-ΦCS. (a) Sketch of the microfluidic channel (width 1 mm, height h=100 μm) illuminated by a perpendicular light beam. The sample flowing through the microchannel is monitored by phase imaging. (b) Enlarged region marked by the dashed orange box in (a). Phase information is extracted from two illuminated regions indicated by red and green cylinders. (c) Recorded phase images at t=t1, t2, t3. The red and green circles correspond to the observation regions in (b). The white arrows indicate the flow direction. (d) F1(t) and F2(t) are the corresponding phase-time traces. (e) ACFs and CCF curves calculated from the phase-time traces.
    Fig. 1. Principle of 2B-ΦCS. (a) Sketch of the microfluidic channel (width 1 mm, height h=100  μm) illuminated by a perpendicular light beam. The sample flowing through the microchannel is monitored by phase imaging. (b) Enlarged region marked by the dashed orange box in (a). Phase information is extracted from two illuminated regions indicated by red and green cylinders. (c) Recorded phase images at t=t1, t2, t3. The red and green circles correspond to the observation regions in (b). The white arrows indicate the flow direction. (d) F1(t) and F2(t) are the corresponding phase-time traces. (e) ACFs and CCF curves calculated from the phase-time traces.
    Comparison of amplitude- and phase-based correlation analysis. (a), (b) Amplitude and phase images, respectively, of yeast solutions, acquired at (top to bottom) t=0.1 s, 0.5 s, and 0.9 s (Visualization 1). The white arrows in (a1) and (b1) show the flow direction in the yeast solution. (c), (d) ACFs and CCF calculated from the amplitude and phase image sequences, respectively. Symbols and error bars represent means and standard deviations, respectively, calculated from a set of 10 independent measurements.
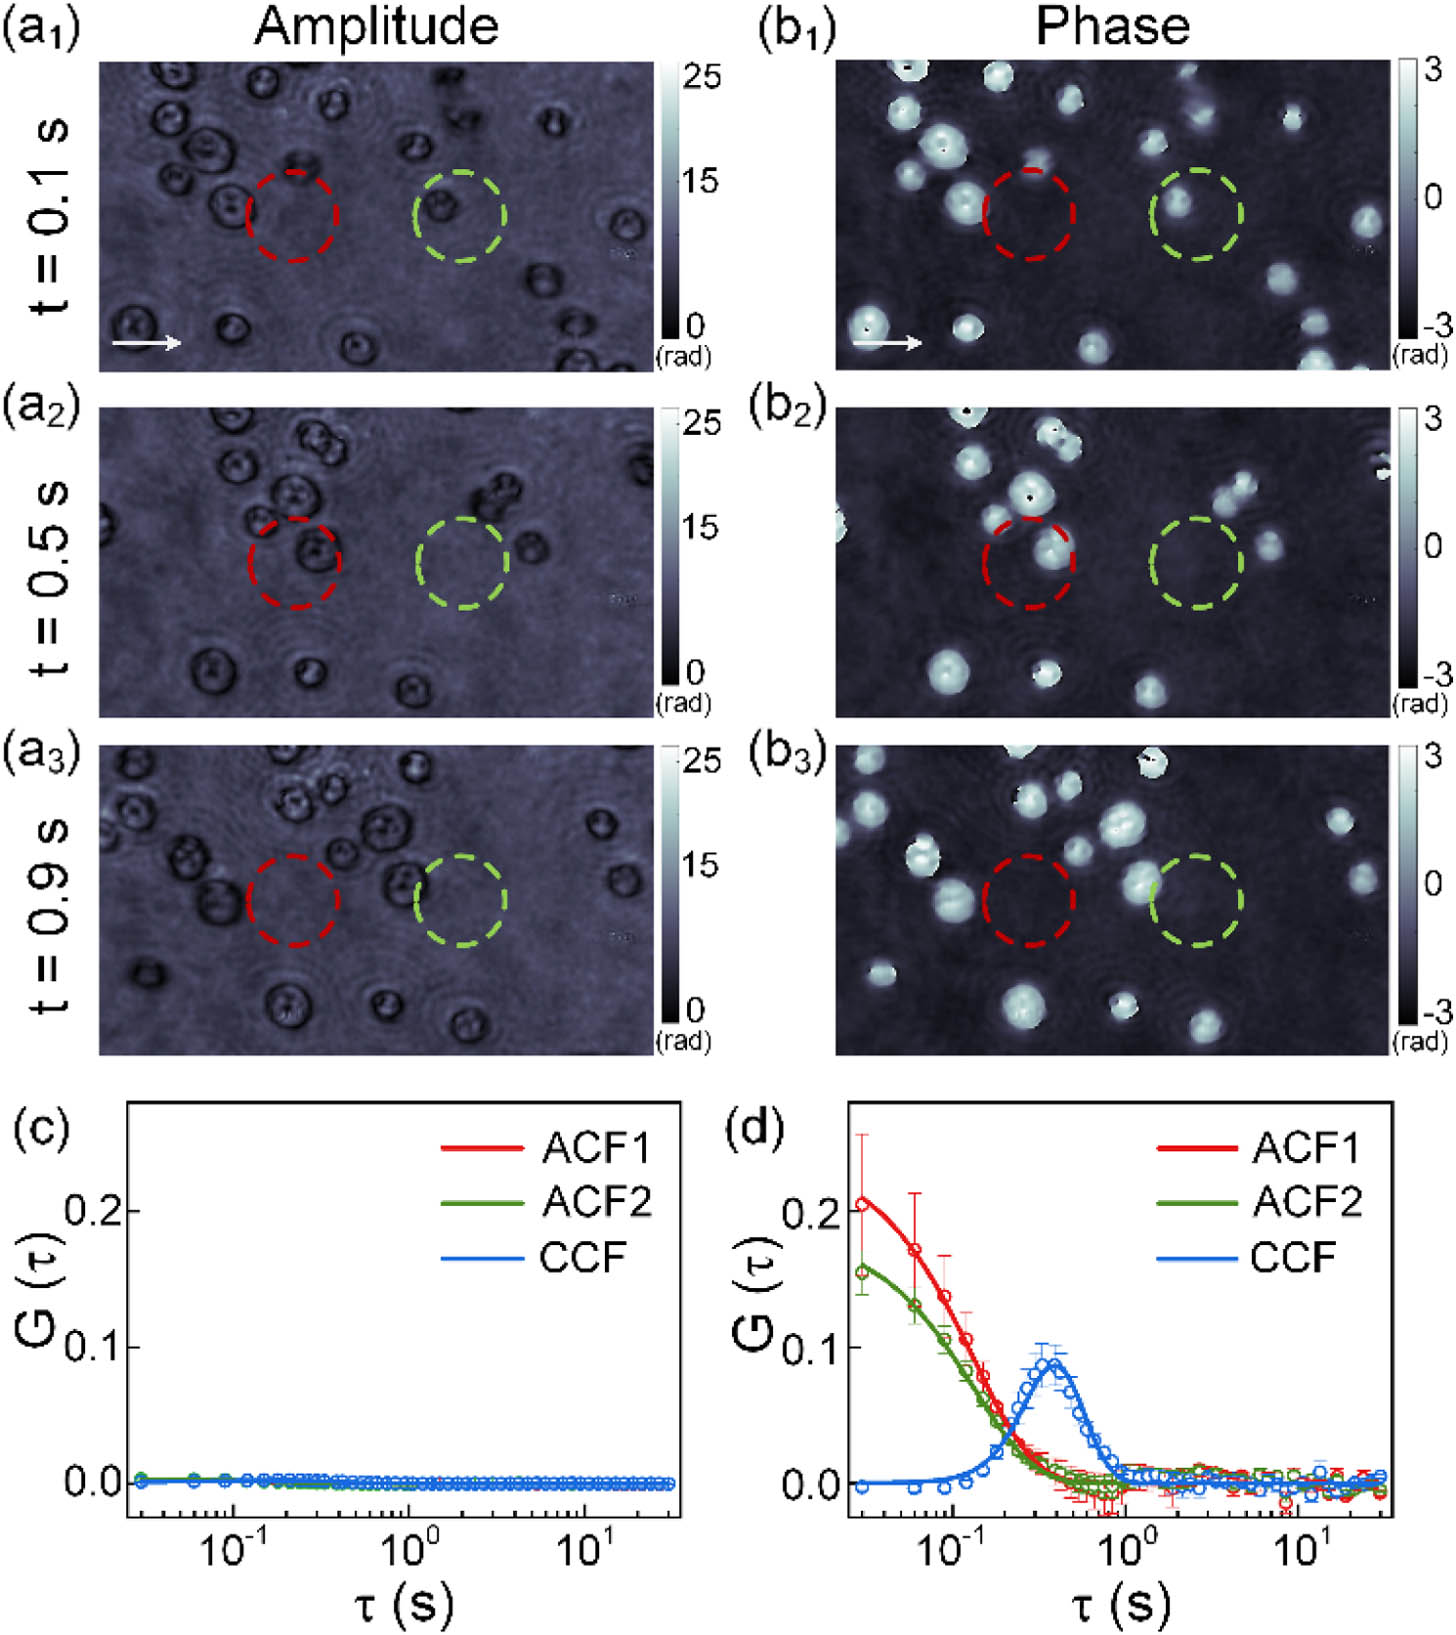
    Fig. 2. Comparison of amplitude- and phase-based correlation analysis. (a), (b) Amplitude and phase images, respectively, of yeast solutions, acquired at (top to bottom) t=0.1  s, 0.5 s, and 0.9 s (Visualization 1). The white arrows in (a1) and (b1) show the flow direction in the yeast solution. (c), (d) ACFs and CCF calculated from the amplitude and phase image sequences, respectively. Symbols and error bars represent means and standard deviations, respectively, calculated from a set of 10 independent measurements.
    Measurement of three different flow speeds of PMMA microspheres using 2B-ΦCS. (a) Normalized G×(τ) curves (flow speeds are given in the legend); symbols and error bars: mean ± standard deviations from 10 independent experiments. (b) Histogram comparing flow speeds from 2B-ΦCS and PIV; data1, data2, and data3 refer to the sets of experiments at the three different flow speeds. Error bars are shown as obtained from the fit (2B-ΦCS) and as standard deviations from the PIV analysis of 30 beads equally distributed in 10 independent experiments (i.e., three beads were selected from each data set).
    Fig. 3. Measurement of three different flow speeds of PMMA microspheres using 2B-ΦCS. (a) Normalized G×(τ) curves (flow speeds are given in the legend); symbols and error bars: mean ± standard deviations from 10 independent experiments. (b) Histogram comparing flow speeds from 2B-ΦCS and PIV; data1, data2, and data3 refer to the sets of experiments at the three different flow speeds. Error bars are shown as obtained from the fit (2B-ΦCS) and as standard deviations from the PIV analysis of 30 beads equally distributed in 10 independent experiments (i.e., three beads were selected from each data set).
    Measurement of particle concentrations of PMMA microspheres using 2B-ΦCS. (a) Three sets of correlation curves of PMMA microspheres with different concentrations (given in the legend). (b) Linear relationship between the results obtained by 2B-ΦCS, and by simply counting PMMA particles in the volume. The open symbols indicate the individual data points of different concentrations, while the solid symbols indicate the mean of the data points with the same color.
    Fig. 4. Measurement of particle concentrations of PMMA microspheres using 2B-ΦCS. (a) Three sets of correlation curves of PMMA microspheres with different concentrations (given in the legend). (b) Linear relationship between the results obtained by 2B-ΦCS, and by simply counting PMMA particles in the volume. The open symbols indicate the individual data points of different concentrations, while the solid symbols indicate the mean of the data points with the same color.
    Analysis of the concentration and size of rat RBCs. (a) Workflow of in vitro2B-ΦCS measurement on rat blood. (b) Phase images of flowing RBCs at six different times. (c), (d) Histograms of (c) concentration and (d) diameter measurements.
    Fig. 5. Analysis of the concentration and size of rat RBCs. (a) Workflow of in vitro2B-ΦCS measurement on rat blood. (b) Phase images of flowing RBCs at six different times. (c), (d) Histograms of (c) concentration and (d) diameter measurements.
    In vivo2B-ΦCS measurement of blood flow velocities in an artery and a vein of a zebrafish embryo. (a) Schematic DHM setup for 2B-ΦCS measurement on blood cell flow in zebrafish vessels (Visualization 2). The insets show the schematic diagram (top) and an enlarged image of the dorsal aorta (DA) and posterior cardinal vein (PCV). The arrows in the phase image show the blood flow directions in the two vessels. (b) ACFs (red and green) and CCF (blue) calculated with the phase values within two circular regions in the blood vessel. (c) Statistics on the velocities of blood flow in the artery and vein of zebrafish.
    Fig. 6. In vivo2B-ΦCS measurement of blood flow velocities in an artery and a vein of a zebrafish embryo. (a) Schematic DHM setup for 2B-ΦCS measurement on blood cell flow in zebrafish vessels (Visualization 2). The insets show the schematic diagram (top) and an enlarged image of the dorsal aorta (DA) and posterior cardinal vein (PCV). The arrows in the phase image show the blood flow directions in the two vessels. (b) ACFs (red and green) and CCF (blue) calculated with the phase values within two circular regions in the blood vessel. (c) Statistics on the velocities of blood flow in the artery and vein of zebrafish.
    Lan Yu, Yu Wang, Yang Wang, Kequn Zhuo, Min Liu, G. Ulrich Nienhaus, Peng Gao. Two-beam phase correlation spectroscopy: a label-free holographic method to quantify particle flow in biofluids[J]. Photonics Research, 2023, 11(5): 757
    Download Citation