• Advanced Photonics
  • Vol. 4, Issue 5, 056002 (2022)
Linpeng Lu1、2、3、4、†, Jiaji Li1、2、3、4, Yefeng Shu1、2、3、4, Jiasong Sun1、2、3、4, Jie Zhou1、2、3、4, Edmund Y. Lam5、*, Qian Chen2、3、*, and Chao Zuo1、2、3、4、*
Author Affiliations
  • 1Nanjing University of Science and Technology, Smart Computational Imaging Laboratory (SCILab), Nanjing, China
  • 2Nanjing University of Science and Technology, School of Electronic and Optical Engineering, Nanjing, China
  • 3Jiangsu Key Laboratory of Spectral Imaging & Intelligent Sense, Nanjing, China
  • 4Nanjing University of Science and Technology, Smart Computational Imaging Research Institute (SCIRI), Nanjing, China
  • 5The University of Hong Kong, Department of Electrical and Electronic Engineering, Pokfulam, Hong Kong, China
  • show less
    DOI: 10.1117/1.AP.4.5.056002 Cite this Article Set citation alerts
    Linpeng Lu, Jiaji Li, Yefeng Shu, Jiasong Sun, Jie Zhou, Edmund Y. Lam, Qian Chen, Chao Zuo. Hybrid brightfield and darkfield transport of intensity approach for high-throughput quantitative phase microscopy[J]. Advanced Photonics, 2022, 4(5): 056002 Copy Citation Text show less
    Schematic diagram of the optical system comparison corresponding to the traditional FPM method and the proposed HBDTI method. (a) FPM requires a variably illuminated in-focus intensity stack that is captured under point illuminations. (b) HBDTI captures two through-focus intensity stacks under the discrete circle (BF) and the complementary-shaped (DF) illuminations, respectively.
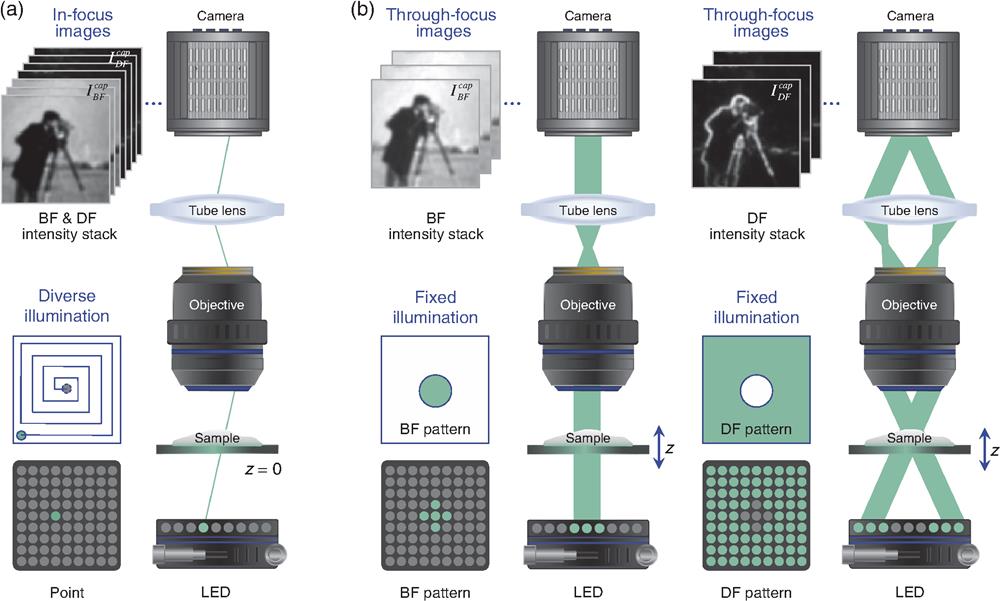
    Fig. 1. Schematic diagram of the optical system comparison corresponding to the traditional FPM method and the proposed HBDTI method. (a) FPM requires a variably illuminated in-focus intensity stack that is captured under point illuminations. (b) HBDTI captures two through-focus intensity stacks under the discrete circle (BF) and the complementary-shaped (DF) illuminations, respectively.
    Roadmap of the proposed HBDTI method. (a) BF and DF defocused intensity stacks are measured under BF and DF illumination provided by 9×9 LEDs, respectively, as input data for the HBDTI algorithm. (b) BF in-focus intensity and zero phase combine to form the initial guess for the high-resolution complex amplitude. (c) Coherent mode decomposition for the estimated high-resolution complex amplitude to obtain equally spaced intensity stacks via the angular spectrum method. (d) The intensity constraints of the propagated complex amplitudes. (e) Updated frequency spectrum and the retrieval high-resolution intensity based on difference map. (f) High-resolution frequency spectrum and corresponding intensity reconstructed by HBDTI after iterations until convergence.
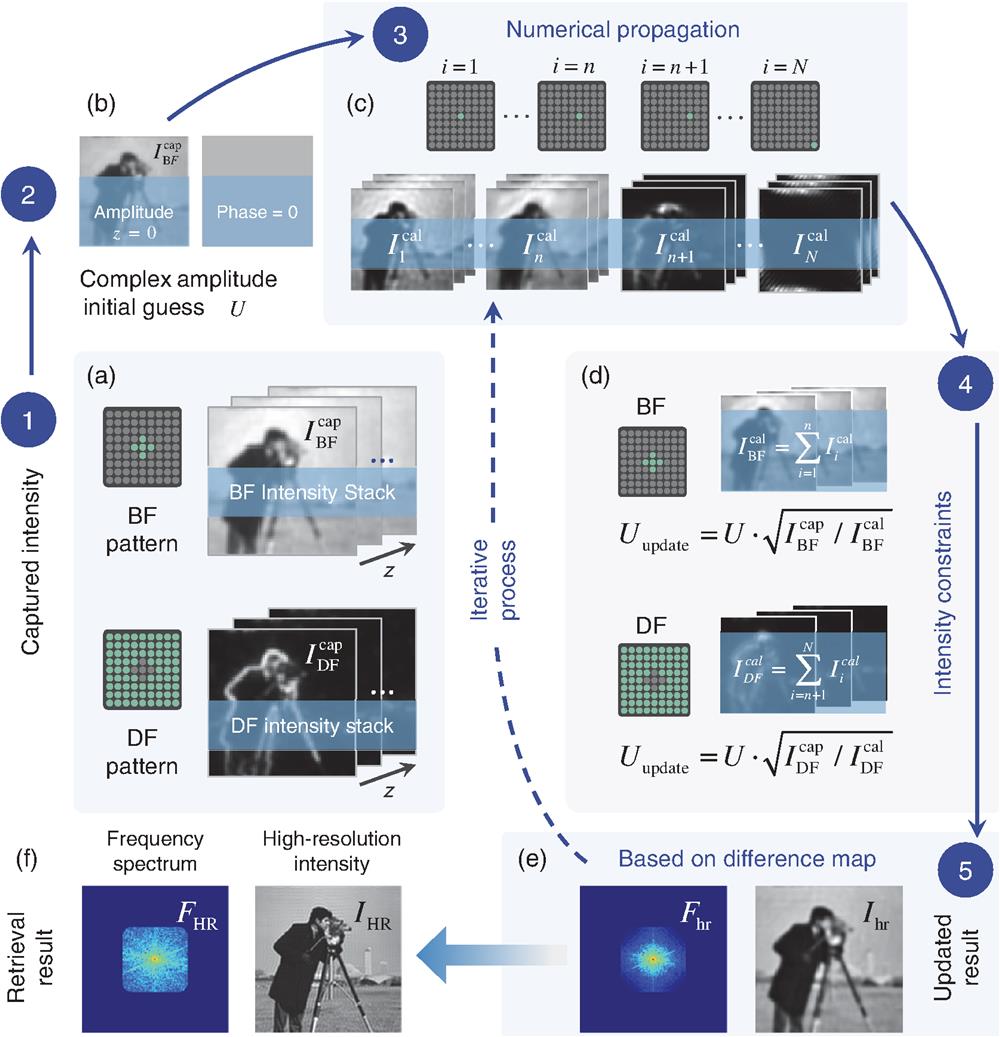
    Fig. 2. Roadmap of the proposed HBDTI method. (a) BF and DF defocused intensity stacks are measured under BF and DF illumination provided by 9×9 LEDs, respectively, as input data for the HBDTI algorithm. (b) BF in-focus intensity and zero phase combine to form the initial guess for the high-resolution complex amplitude. (c) Coherent mode decomposition for the estimated high-resolution complex amplitude to obtain equally spaced intensity stacks via the angular spectrum method. (d) The intensity constraints of the propagated complex amplitudes. (e) Updated frequency spectrum and the retrieval high-resolution intensity based on difference map. (f) High-resolution frequency spectrum and corresponding intensity reconstructed by HBDTI after iterations until convergence.
    Quantitative simulation results by using HBDTI. (a1) Cameraman image with 192×192 pixels as the ground truth value of intensity. (b1) and (b2) BF and DF intensity stacks were generated based on the forward model of the corresponding illumination mode after 3× downsampling of (a1). (c1) BF in-focus intensity is the initial intensity guess for the high-resolution complex amplitude. (d1) The high-resolution intensity is reconstructed by HBDTI after 50 iterations. (a2), (c2), and (d2) The Fourier frequency spectrum corresponding to (a1), (c1), and (d1), respectively. (a3), (c3), and (d3) The enlarged regions corresponding to the boxes in (a1), (c1), and (d1), respectively.
    Fig. 3. Quantitative simulation results by using HBDTI. (a1) Cameraman image with 192×192  pixels as the ground truth value of intensity. (b1) and (b2) BF and DF intensity stacks were generated based on the forward model of the corresponding illumination mode after 3× downsampling of (a1). (c1) BF in-focus intensity is the initial intensity guess for the high-resolution complex amplitude. (d1) The high-resolution intensity is reconstructed by HBDTI after 50 iterations. (a2), (c2), and (d2) The Fourier frequency spectrum corresponding to (a1), (c1), and (d1), respectively. (a3), (c3), and (d3) The enlarged regions corresponding to the boxes in (a1), (c1), and (d1), respectively.
    High-throughput imaging results of USAF absorption target. (a1) Setup of HBDTI system based on a commercial microscope equipped with a programmable LED source at the front-end of illumination and a drive mechanism at the back-end of acquisition. (a2) The low-resolution BF in-focus intensity image of USAF was captured under a large FOV of ∼7.19 mm2. (b1) The enlarged region of the yellow box in (a) corresponds to a half-pitch resolution of 1.23 μm. (b2) HBDTI recovery intensity image corresponding to (b1), whose half-pitch imaging resolution is 0.488 μm. (c1), (c2) Quantitative distribution of the HBDTI retrieval results corresponding to the white line in (b1) and (b2), respectively.
    Fig. 4. High-throughput imaging results of USAF absorption target. (a1) Setup of HBDTI system based on a commercial microscope equipped with a programmable LED source at the front-end of illumination and a drive mechanism at the back-end of acquisition. (a2) The low-resolution BF in-focus intensity image of USAF was captured under a large FOV of 7.19  mm2. (b1) The enlarged region of the yellow box in (a) corresponds to a half-pitch resolution of 1.23  μm. (b2) HBDTI recovery intensity image corresponding to (b1), whose half-pitch imaging resolution is 0.488  μm. (c1), (c2) Quantitative distribution of the HBDTI retrieval results corresponding to the white line in (b1) and (b2), respectively.
    Imaging results of the stained blood smear. (a) BF low-resolution in-focus color image of stained blood cells. (b1) and (b2) BF and DF low-resolution in-focus intensity images of area 1 in (a). (b3), (c1), and (d1) The intensity images recovered by HBDTI in areas 1, 2, and 3 via summing the high-resolution HBDTI intensity results acquired separately for each of the three channels (λ=632 nm, 504 nm, and 460 nm). (b4), (c2), and (d2) The HBDTI retrieval high-resolution phase images attained at 632 nm wavelength in areas 1, 2, and 3, respectively. (e1) and (e2) Quantitative distribution of the HBDTI retrieval results along the respective arrow in (b1) and (b3), respectively (Video 1, mp4, 2.70 MB [URL: https://doi.org/10.1117/1.AP.4.5.056002.s1]).
    Fig. 5. Imaging results of the stained blood smear. (a) BF low-resolution in-focus color image of stained blood cells. (b1) and (b2) BF and DF low-resolution in-focus intensity images of area 1 in (a). (b3), (c1), and (d1) The intensity images recovered by HBDTI in areas 1, 2, and 3 via summing the high-resolution HBDTI intensity results acquired separately for each of the three channels (λ=632  nm, 504 nm, and 460 nm). (b4), (c2), and (d2) The HBDTI retrieval high-resolution phase images attained at 632 nm wavelength in areas 1, 2, and 3, respectively. (e1) and (e2) Quantitative distribution of the HBDTI retrieval results along the respective arrow in (b1) and (b3), respectively (Video 1, mp4, 2.70 MB [URL: https://doi.org/10.1117/1.AP.4.5.056002.s1]).
    QPI results of unlabeled HeLa cells (as the phase object). (a) The retrieval full-FOV label-free HeLa cells phase result using the HBDTI method shows approximately 4000 HeLa cells on a ∼7.19 mm2 FOV. (b1) and (c1) The low-resolution BF in-focus intensity images of areas 1 and 2 in (a), respectively. (b2) and (c2) The low-resolution DF in-focus intensity images of (b1) and (c1), respectively. (b3) and (c3) The retrieval phase results of (b1) and (c1) using the FFT-based TIE method, respectively. (b4) and (c4) The retrieval phase results of (b1) and (c1) utilizing the proposed HBDTI method, respectively (Video 2, mp4, 8.35 MB [URL: https://doi.org/10.1117/1.AP.4.5.056002.s2]).
    Fig. 6. QPI results of unlabeled HeLa cells (as the phase object). (a) The retrieval full-FOV label-free HeLa cells phase result using the HBDTI method shows approximately 4000 HeLa cells on a 7.19  mm2 FOV. (b1) and (c1) The low-resolution BF in-focus intensity images of areas 1 and 2 in (a), respectively. (b2) and (c2) The low-resolution DF in-focus intensity images of (b1) and (c1), respectively. (b3) and (c3) The retrieval phase results of (b1) and (c1) using the FFT-based TIE method, respectively. (b4) and (c4) The retrieval phase results of (b1) and (c1) utilizing the proposed HBDTI method, respectively (Video 2, mp4, 8.35 MB [URL: https://doi.org/10.1117/1.AP.4.5.056002.s2]).
    Linpeng Lu, Jiaji Li, Yefeng Shu, Jiasong Sun, Jie Zhou, Edmund Y. Lam, Qian Chen, Chao Zuo. Hybrid brightfield and darkfield transport of intensity approach for high-throughput quantitative phase microscopy[J]. Advanced Photonics, 2022, 4(5): 056002
    Download Citation