• Journal of Semiconductors
  • Vol. 41, Issue 8, 082004 (2020)
Qian Yang1、2, Yongzhou Xue1、2, Hao Chen1、2, Xiuming Dou1、2, and Baoquan Sun1、2
Author Affiliations
  • 1State Key Laboratory for Superlattices and Microstructures, Institute of Semiconductors, Chinese Academy of Sciences, Beijing 100083, China
  • 2College of Materials Science and Optoelectronic Technology, University of Chinese Academy of Sciences, Beijing 100049, China
  • show less
    DOI: 10.1088/1674-4926/41/8/082004 Cite this Article
    Qian Yang, Yongzhou Xue, Hao Chen, Xiuming Dou, Baoquan Sun. Photo-induced doping effect and dynamic process in monolayer MoSe2[J]. Journal of Semiconductors, 2020, 41(8): 082004 Copy Citation Text show less
    (Color online) (a) Micrograph of transferred monolayer MoSe2 sample (upper part) and as grown monolayer MoSe2 sample (lower part). (b) PL spectra of monolayer MoSe2 measured at 6 K for as grown (red line) and after transferring to a SiO2/Si substrate (black line). (c) Raman spectrum of the transferred sample. (d) PL spectrum of the transferred monolayer MoSe2 measured at an excitation power of 872 μW. The curve can be fitted by using three Gauss functions.
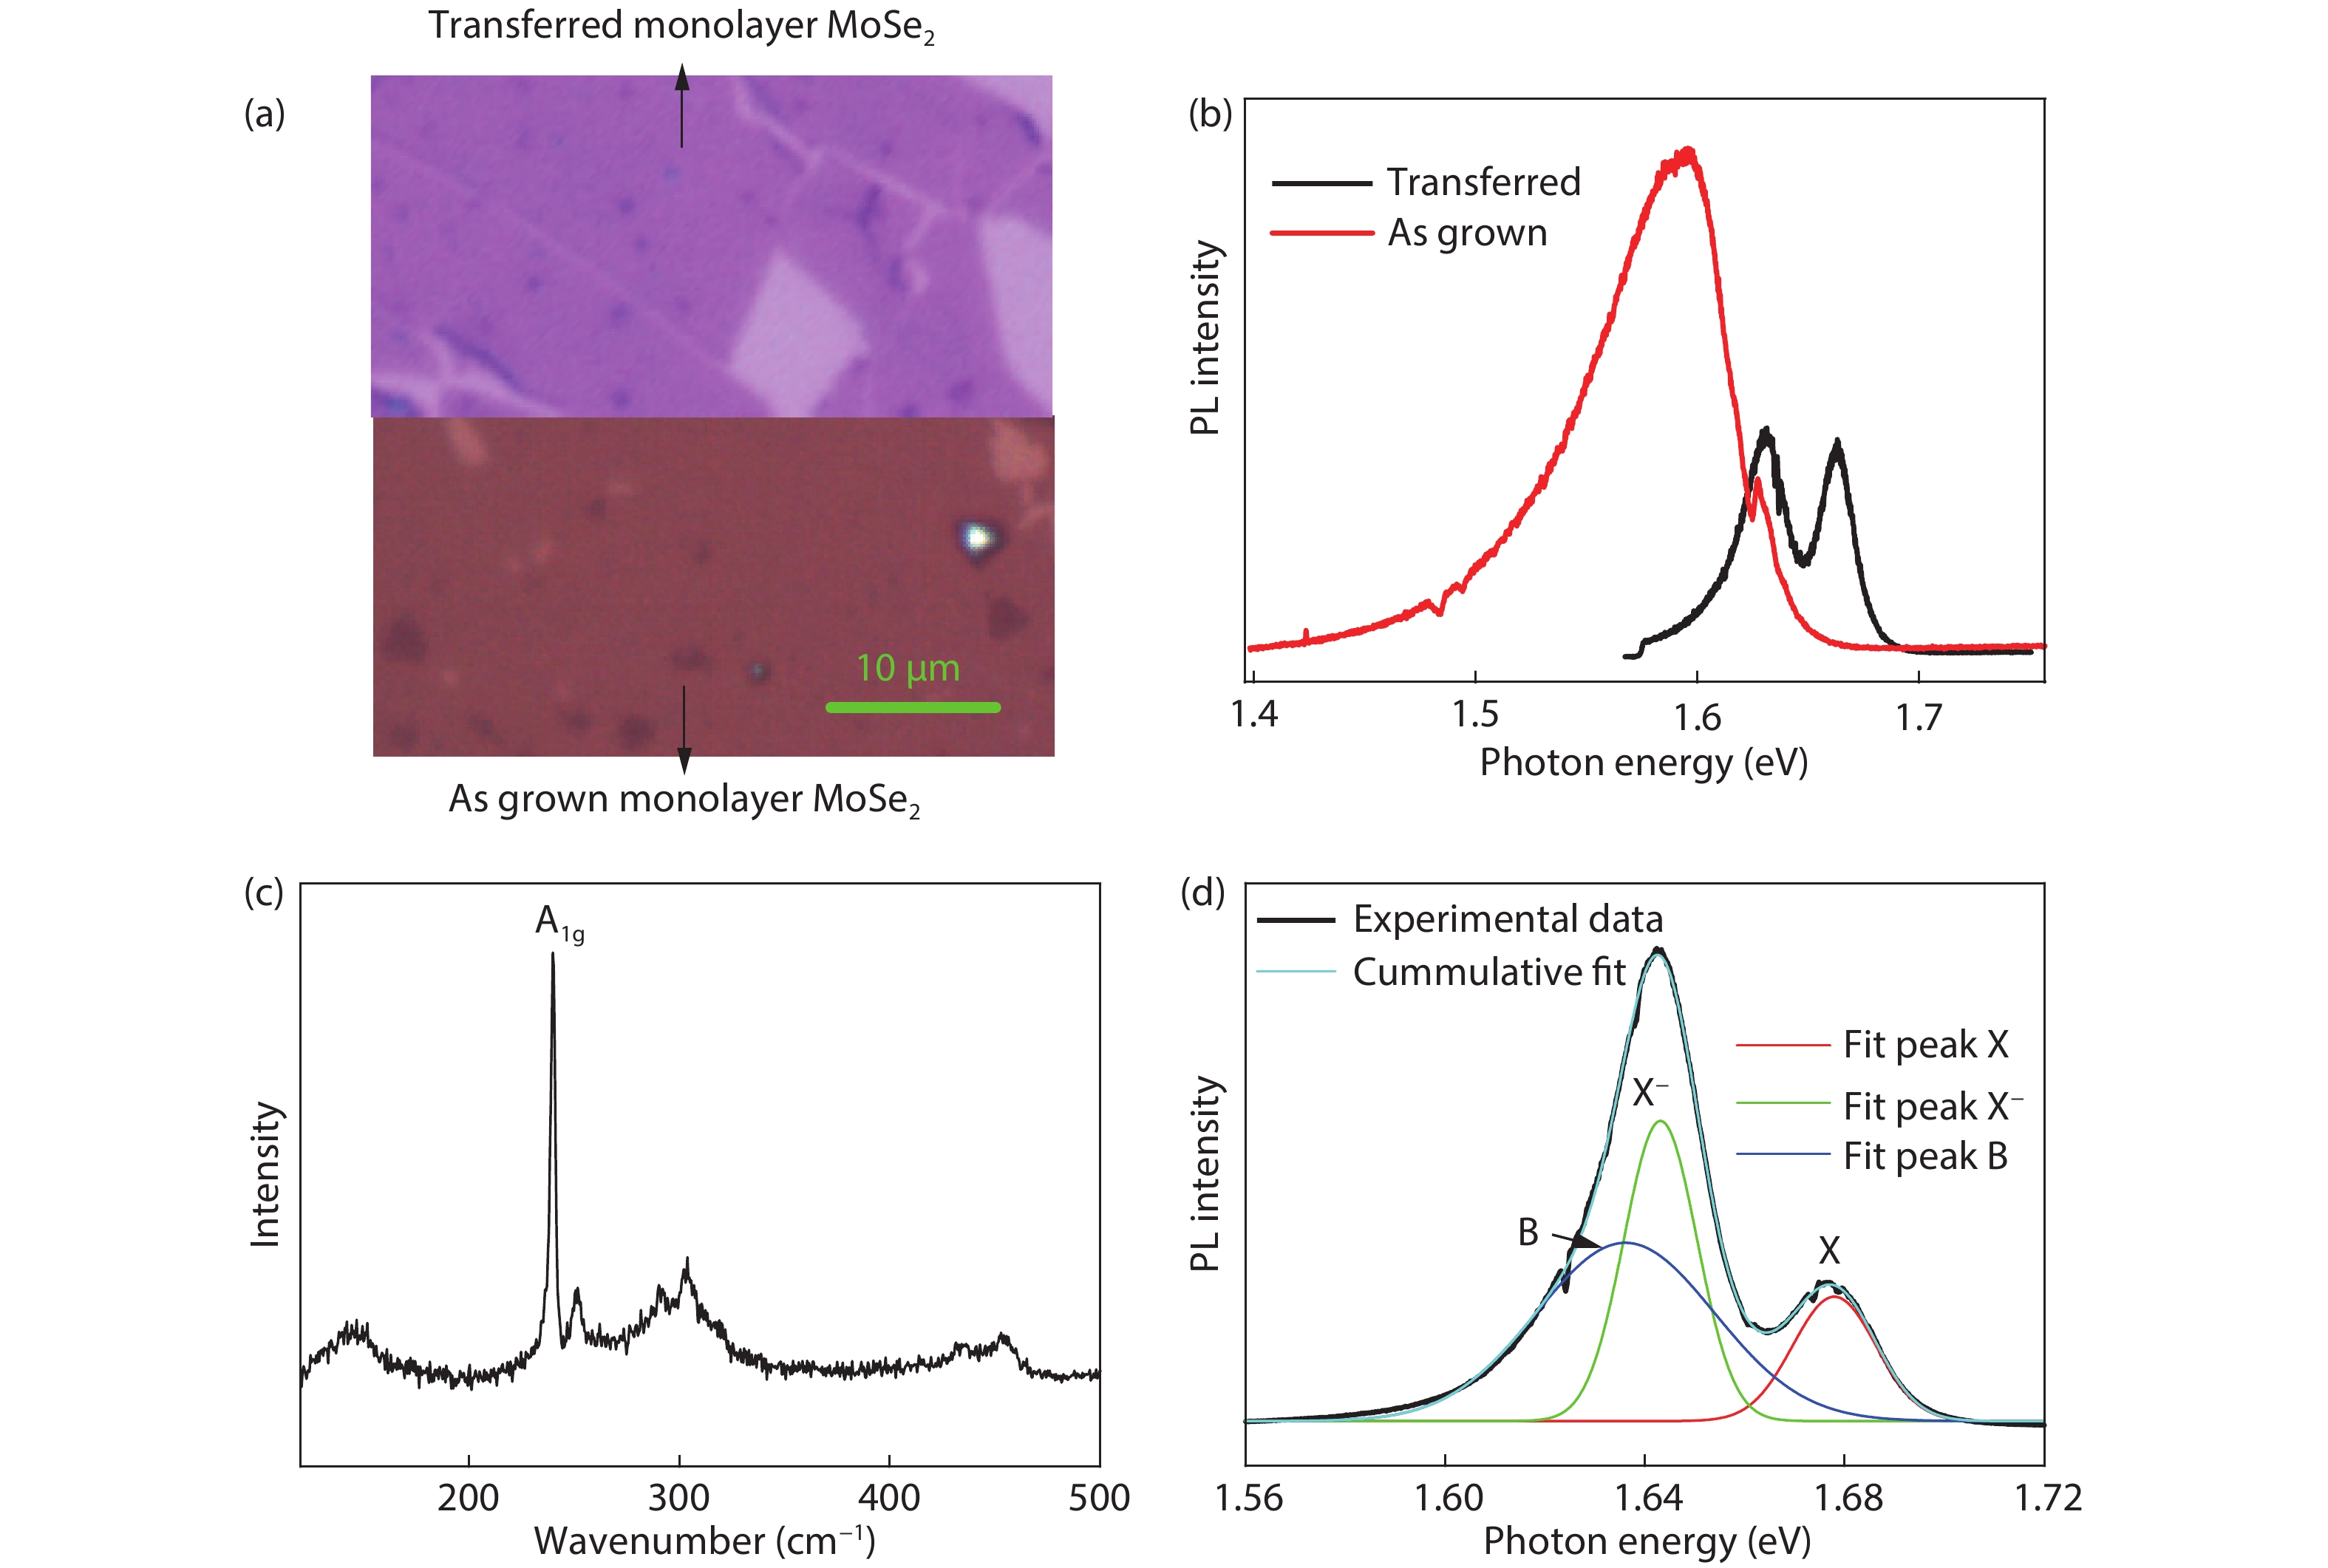
    Fig. 1. (Color online) (a) Micrograph of transferred monolayer MoSe2 sample (upper part) and as grown monolayer MoSe2 sample (lower part). (b) PL spectra of monolayer MoSe2 measured at 6 K for as grown (red line) and after transferring to a SiO2/Si substrate (black line). (c) Raman spectrum of the transferred sample. (d) PL spectrum of the transferred monolayer MoSe2 measured at an excitation power of 872 μW. The curve can be fitted by using three Gauss functions.
    (Color online) (a) PL spectra of the transferred monolayer MoSe2 for the first-round measurements with increasing excitation power from 0.2 to 872 μW at 6 K. The corresponding X and X– PL peak energies and intensities are summarized in (c) and (e), respectively. (b) PL spectra for the second-round measurements with increasing excitation power from 1 to 760 μW at 6 K after the excitation power up to 872 μW. The corresponding X and X– PL peak energies and intensities are summarized in (d) and (f), respectively.
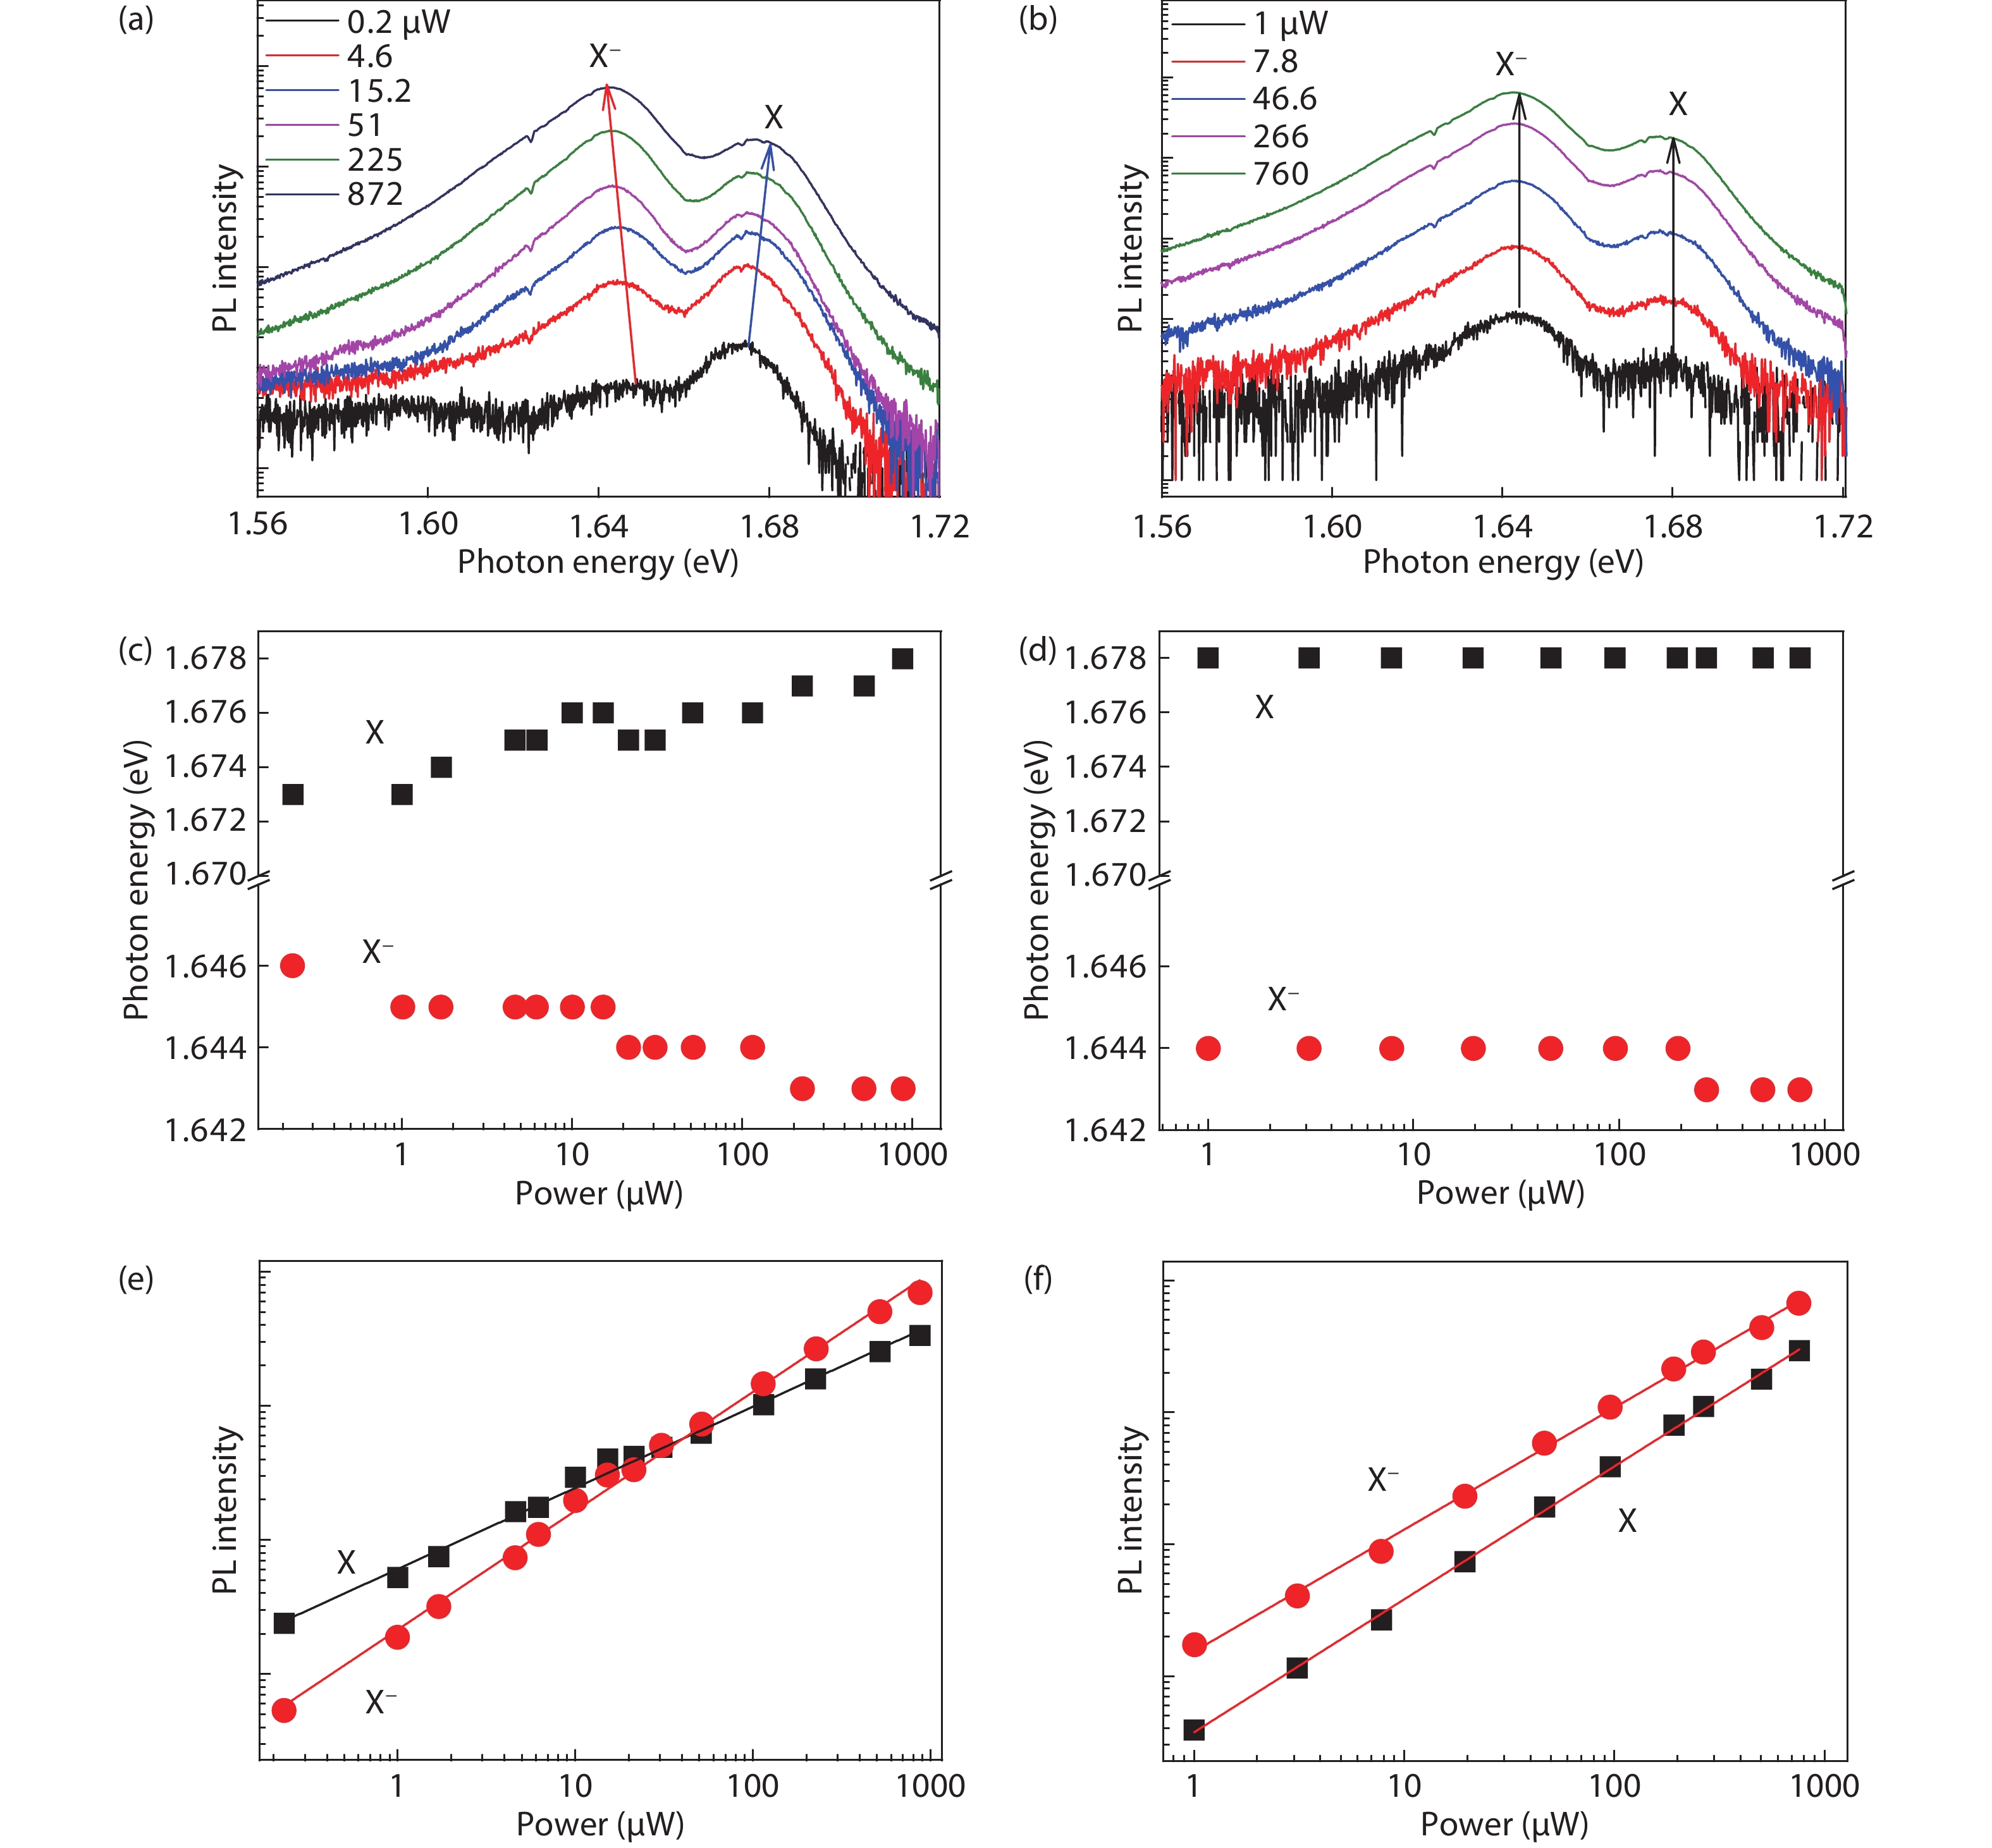
    Fig. 2. (Color online) (a) PL spectra of the transferred monolayer MoSe2 for the first-round measurements with increasing excitation power from 0.2 to 872 μW at 6 K. The corresponding X and X PL peak energies and intensities are summarized in (c) and (e), respectively. (b) PL spectra for the second-round measurements with increasing excitation power from 1 to 760 μW at 6 K after the excitation power up to 872 μW. The corresponding X and X PL peak energies and intensities are summarized in (d) and (f), respectively.
    (Color online) (a) PL intensity of X as a function of time measured by a modulated cw laser excitation with power from 0.5 to 100 μW. The ordinate is logarithmic and the curves of different power are shifted relatively for clarity. (b) Fitting values of α as a function of excitation power from 0.5 to 100 μW, where α values are derived by linear fitting to the curves by log–log plot, as shown in (c) at 0.5 and (d) 10 μW, respectively.
    Fig. 3. (Color online) (a) PL intensity of X as a function of time measured by a modulated cw laser excitation with power from 0.5 to 100 μW. The ordinate is logarithmic and the curves of different power are shifted relatively for clarity. (b) Fitting values of α as a function of excitation power from 0.5 to 100 μW, where α values are derived by linear fitting to the curves by log–log plot, as shown in (c) at 0.5 and (d) 10 μW, respectively.
    (Color online) (a) The PL spectra of the transferred monolayer MoSe2 with the temperature increased from 6 to 44 K, under the 42 μW laser irradiation. Inset: the ratio of PL peak intensity of X– and X as a function of temperature, a linear law is used to fit the experimental data. (b) The energy difference between X and X– as a function of temperature.
    Fig. 4. (Color online) (a) The PL spectra of the transferred monolayer MoSe2 with the temperature increased from 6 to 44 K, under the 42 μW laser irradiation. Inset: the ratio of PL peak intensity of X and X as a function of temperature, a linear law is used to fit the experimental data. (b) The energy difference between X and X as a function of temperature.
    Qian Yang, Yongzhou Xue, Hao Chen, Xiuming Dou, Baoquan Sun. Photo-induced doping effect and dynamic process in monolayer MoSe2[J]. Journal of Semiconductors, 2020, 41(8): 082004
    Download Citation