
Sicen Tao, Tao Hou, Yali Zeng, Guangwei Hu, Zixun Ge, Junke Liao, Shan Zhu, Tan Zhang, Cheng-Wei Qiu, Huanyang Chen, "Anisotropic Fermat’s principle for controlling hyperbolic van der Waals polaritons," Photonics Res. 10, B14 (2022)
- Photonics Research
- Vol. 10, Issue 10, B14 (2022)
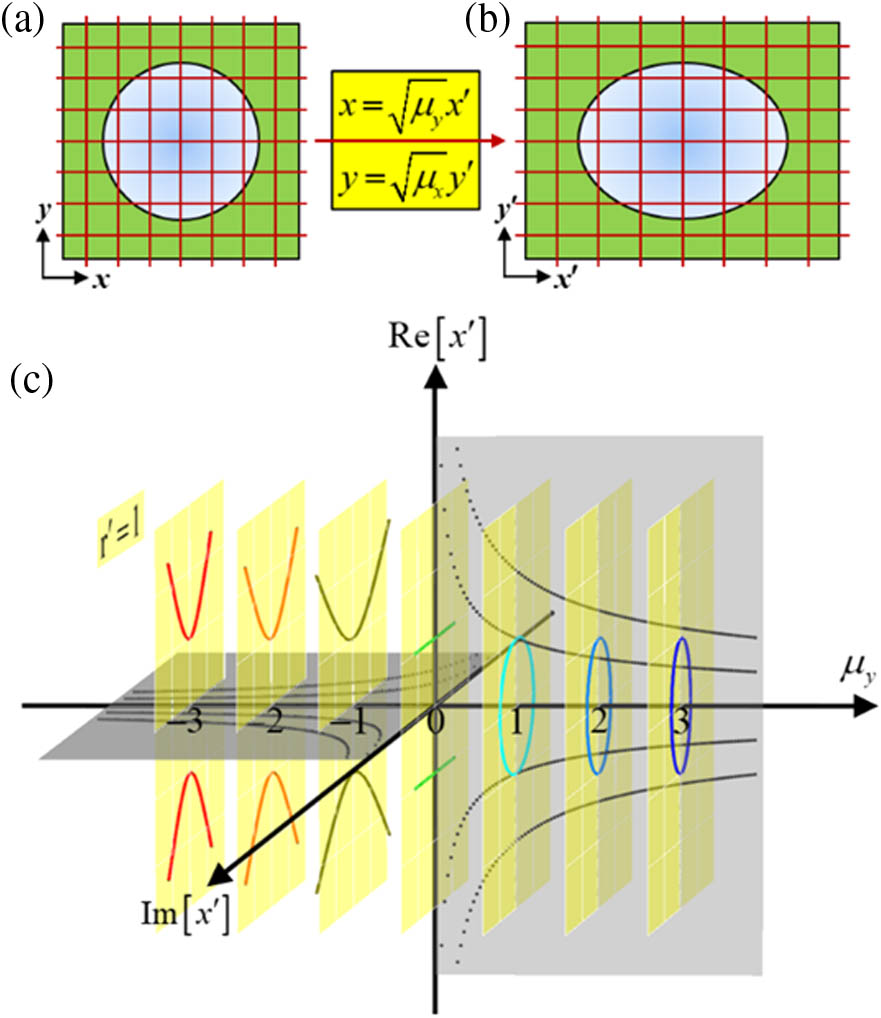
Fig. 1. Schematic of a transformation relation. (a) The original space, which corresponds to the isotropic space w = x + i y w ′ = μ y x ′ + i μ x y ′ Re ( x ′ ) − μ y μ x = 1 μ y ≥ 0 Im ( x ′ ) − μ y μ y < 0 μ x = 1 x = − 2 − 1 r ′ = 1 μ y − 3
![Hyperbolic Luneburg lens with a collimating effect. (a), (d), (b), (e), (c), and (f), respectively, are the geometrical light behaviors, electromagnetic wave pattern [Re(Ez)], and polaritonic wave pattern [Re(Ez)] from the point source at (0,1) or (1,2).](/richHtml/prj/2022/10/10/B14/img_002.jpg)
Fig. 2. Hyperbolic Luneburg lens with a collimating effect. (a), (d), (b), (e), (c), and (f), respectively, are the geometrical light behaviors, electromagnetic wave pattern [Re ( E z ) Re ( E z ) ( 1 , 2 )
Fig. 3. (a) Schematic of the 2D model; (b) schematic of the 3D waveguide model; (c) relation between the effective refractive index n eff d 11 ).
Fig. 4. Thickness distribution d ( x , y )
Fig. 5. Hyperbolic Maxwell’s fish-eye lens with the focusing effect. (a), (d), (b), (e), (c), and (f), respectively, are the geometrical light behaviors, the electromagnetic wave pattern [Re ( E z ) Re ( E z ) ( 1 , 2 )
Fig. 6. Polaritonic wave pattern [Re ( E z ) 634 cm − 1 d max α – MoO 3
Fig. 7. Real-part permittivities of α – MoO 3 α – MoO 3


Set citation alerts for the article
Please enter your email address

© Copyright 2018-2021 | Chinese Laser Press. All Rights Reserved 沪ICP备15018463号-20