
Mahmoud Shaban. Determination of trap density-of-states distribution of nitrogen-doped ultrananocrystalline diamond/hydrogenated amorphous carbon composite films[J]. Journal of Semiconductors, 2021, 42(6): 062802
- Journal of Semiconductors
- Vol. 42, Issue 6, 062802 (2021)
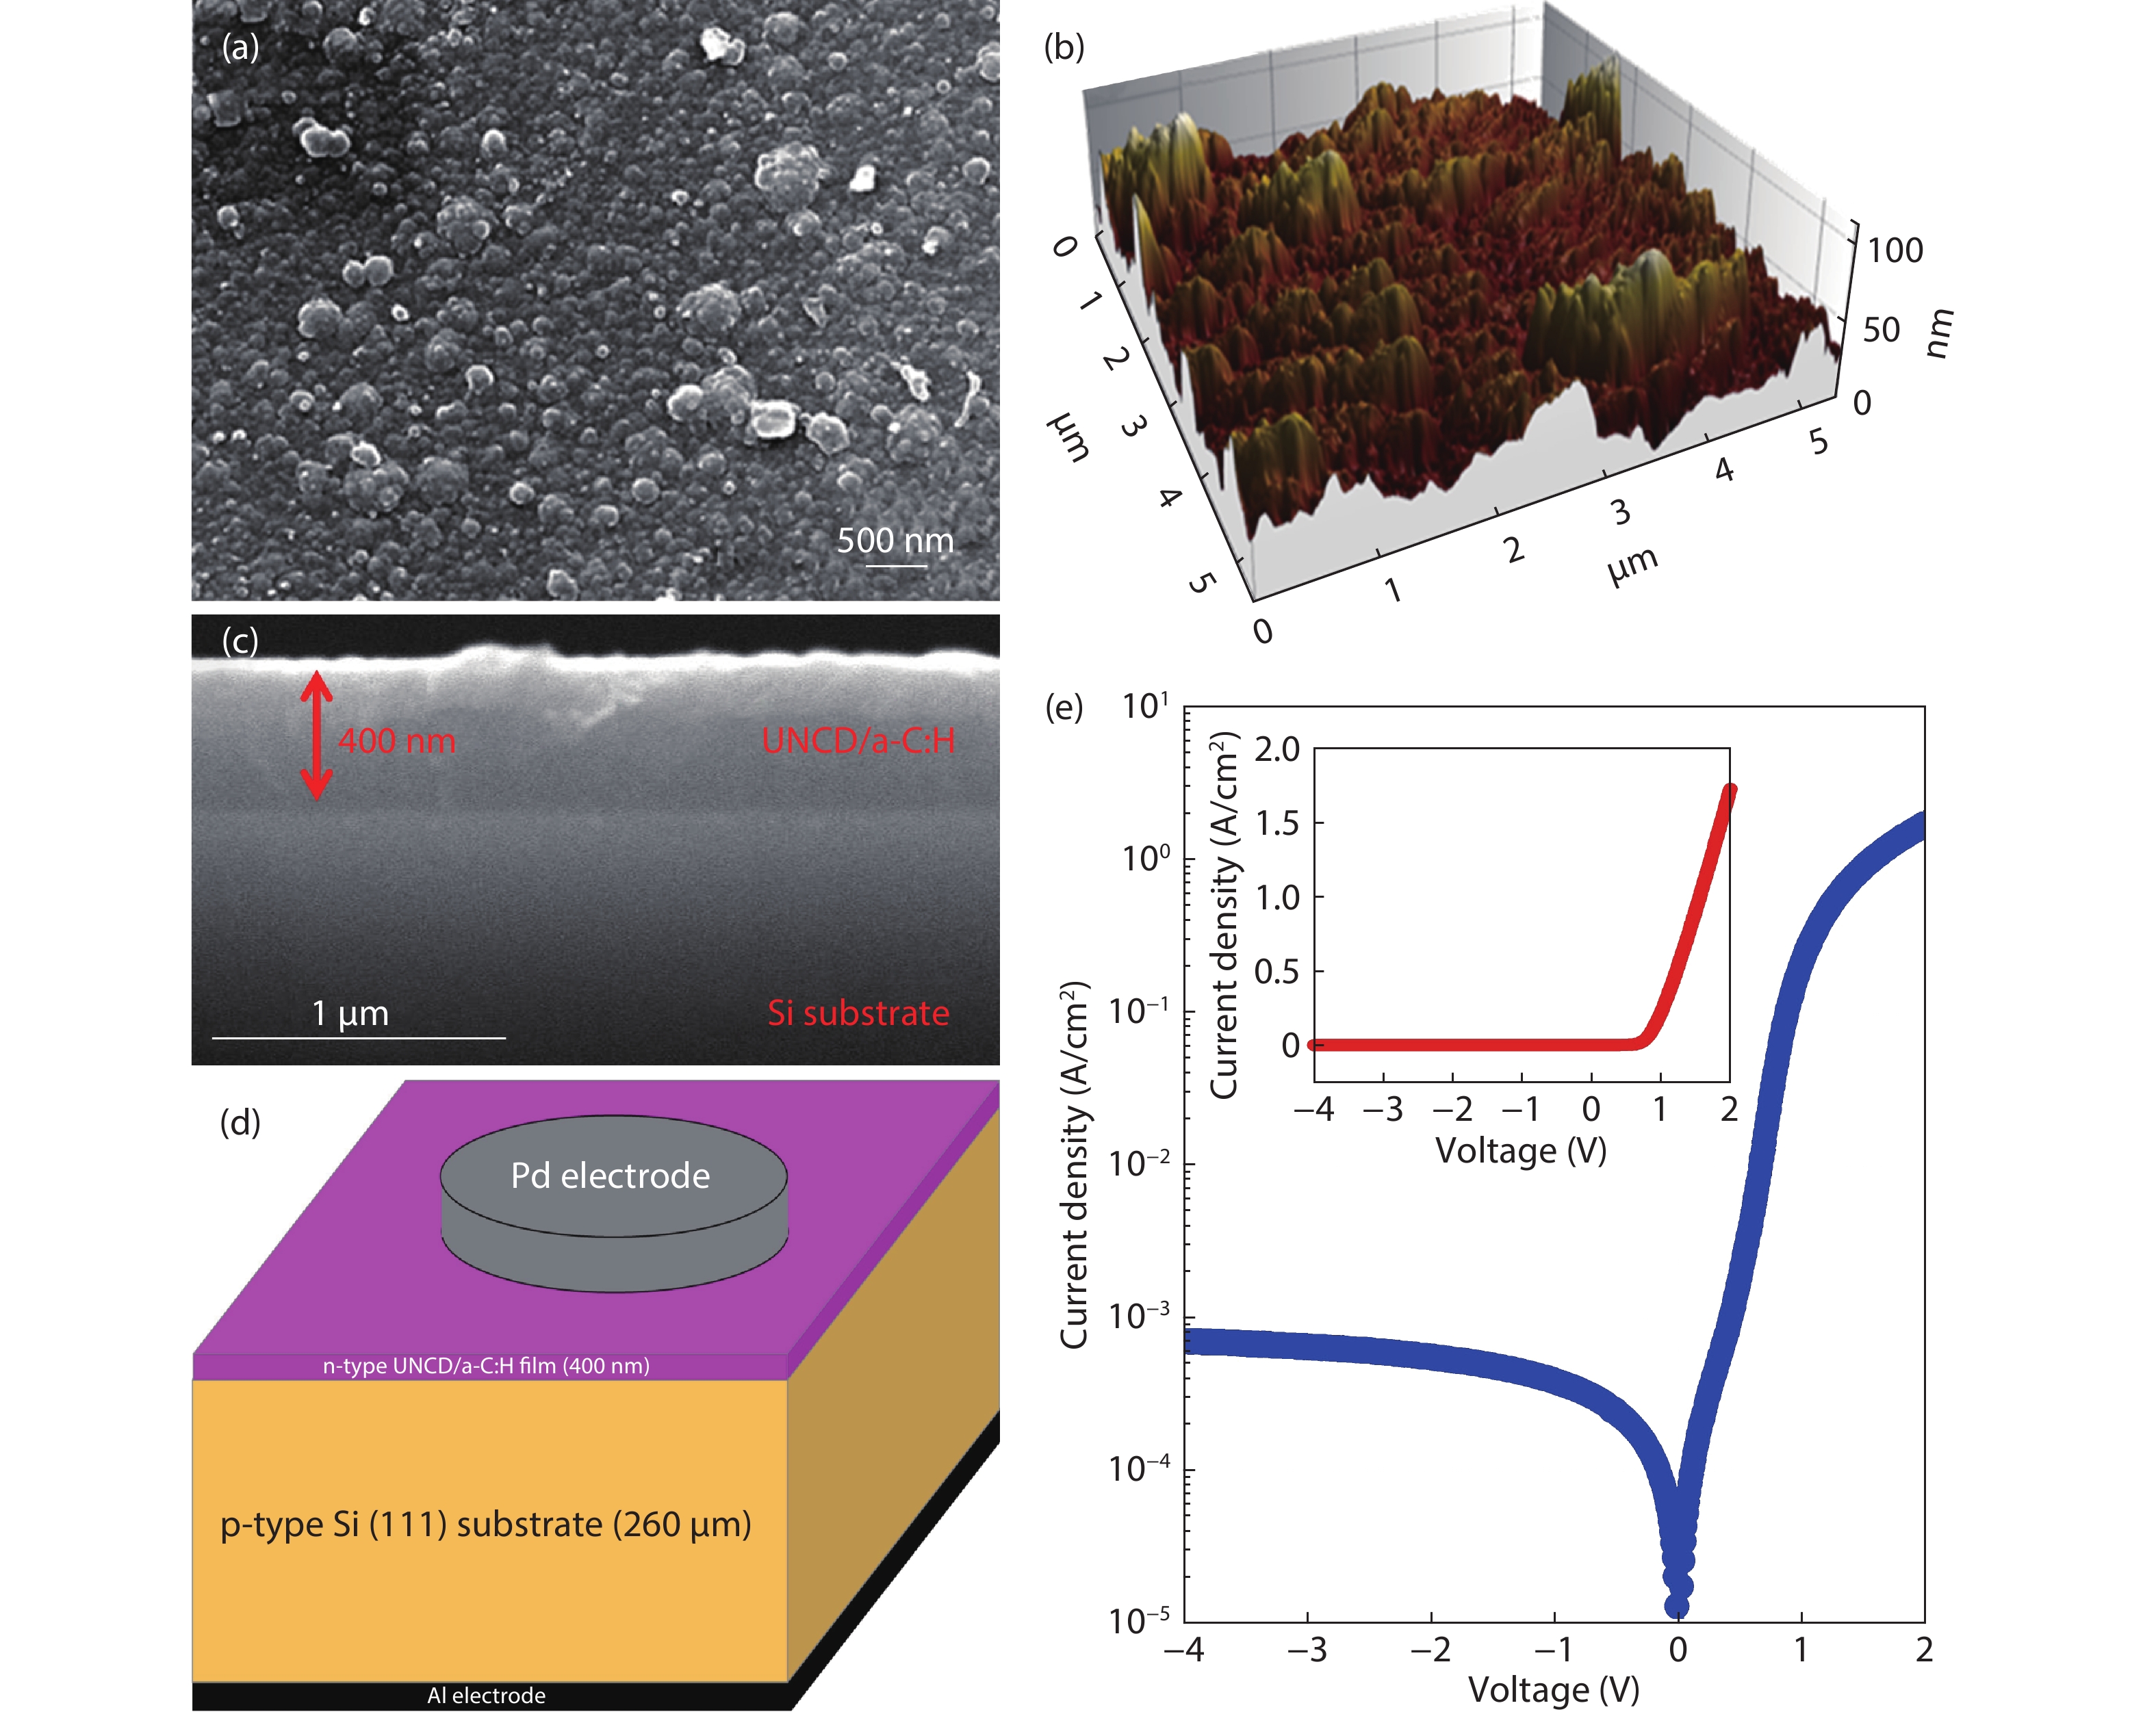
Fig. 1. (Color online) (a) Top-view FESEM images, (b) AFM image of UNCD/a-C:H film surface, (c) cross-sectional FESEM image, (d) schematic representation, and (e) semi-logarithmic and linear (inset) J –V characteristics of N2-doped (UNCD/a-C:H)/p-Si heterojunctions.
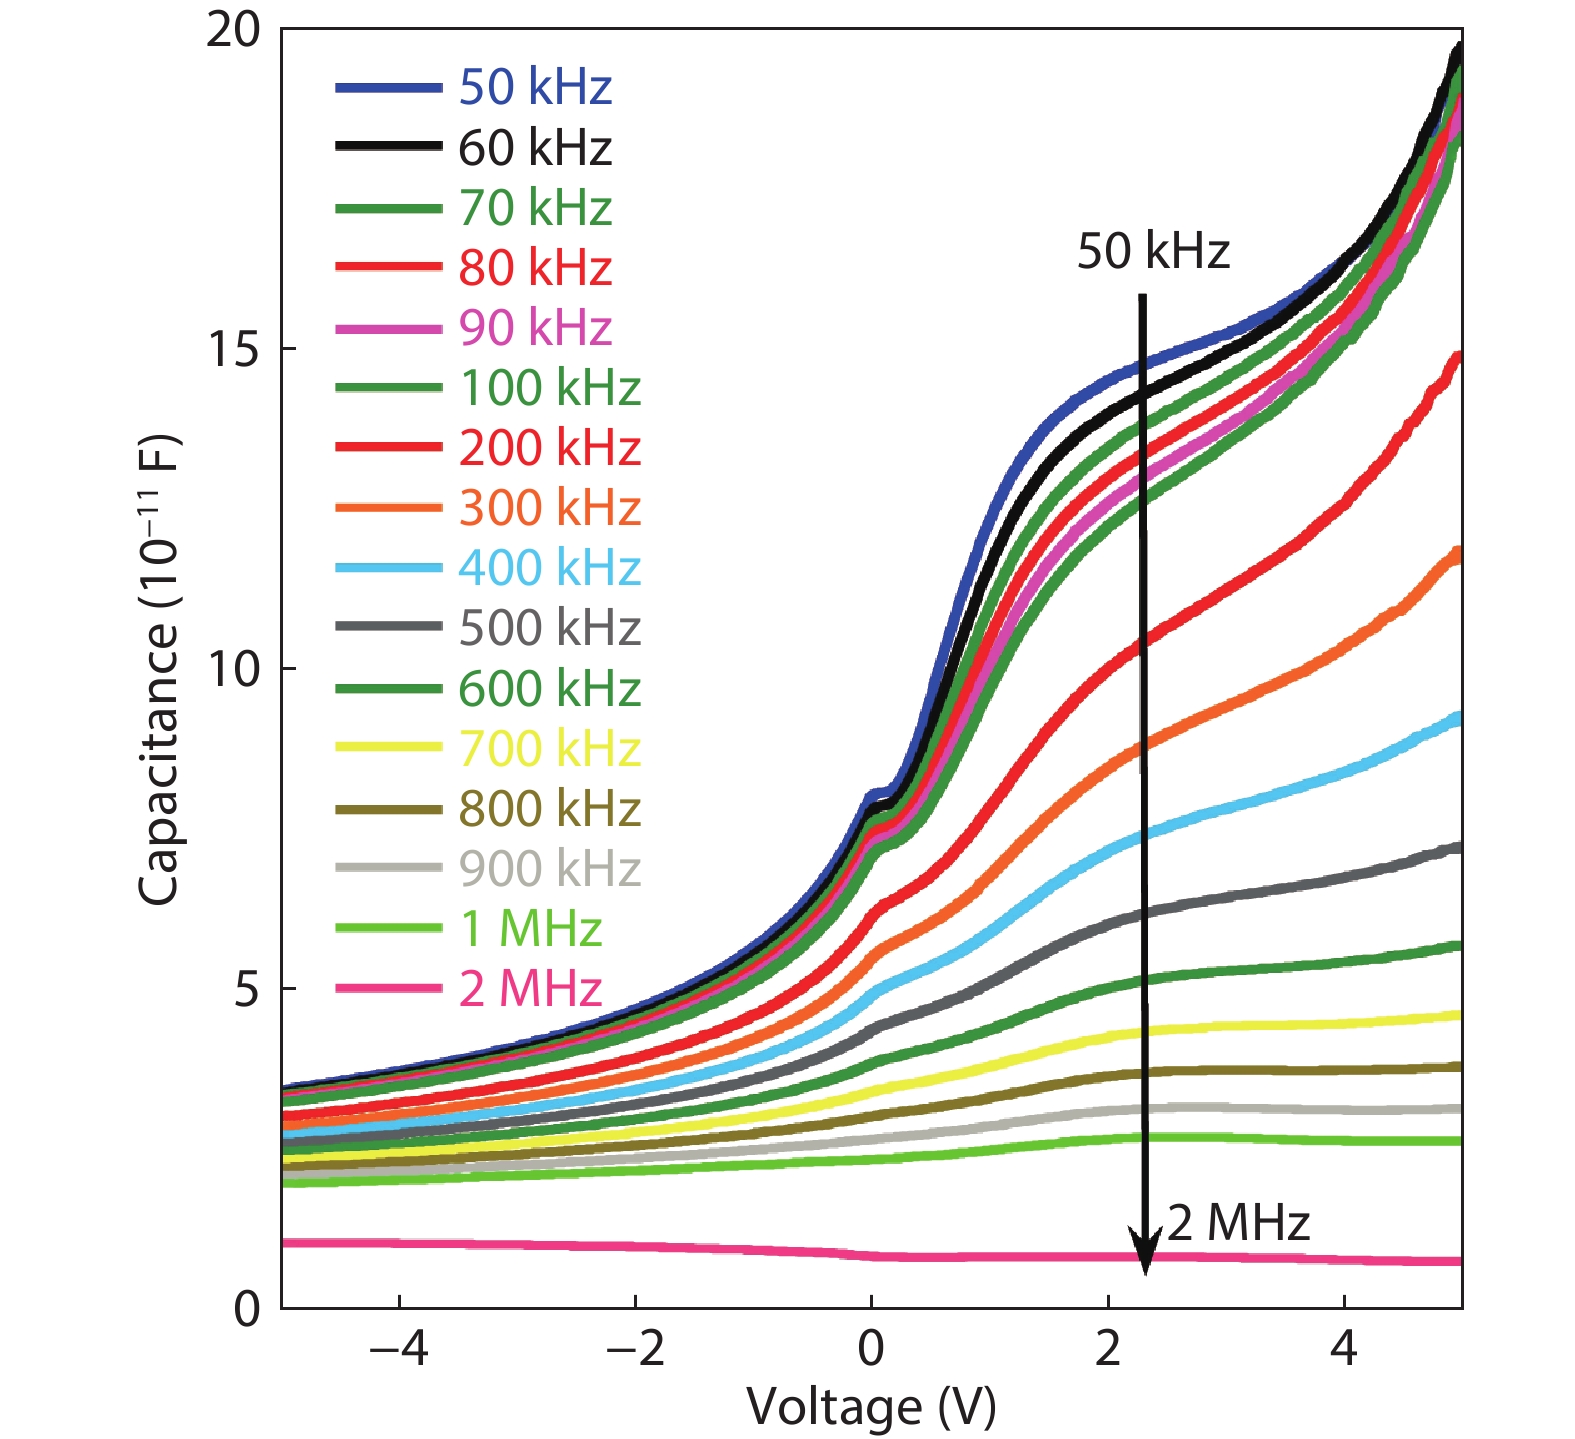
Fig. 2. (Color online) C –V characteristics of (N2-doped UNCD/a-C:H)/p-type Si heterojunction, measured at different frequencies from 50 kHz to 2 MHz.
Fig. 3. C –V characteristics of (N2-doped UNCD/a-C:H)/p-type Si heterojunction, measured at different frequencies from 50 to 100 kHz.
Fig. 4. (Color online) Z r and Z im spectra of (N2-doped UNCD/a-C:H)/p-type Si heterojunction, measured at different temperatures from 300 to 400 K.
Fig. 5. (Color online) C –f characteristics of (N2-doped UNCD/a-C:H)/p-type Si heterojunction, measured at different temperatures.
Fig. 6. Arrhenius plot of ln(f m) of (N2-doped UNCD/a-C:H)/p-type Si heterojunction.
Fig. 7. Energy-distributed trap-DOS of N2-doped UNCD/a-C:H film measured (dots) and fitted (lines) data at temperatures of (a) 300 K, (b) 325 K, (c) 350 K, (d) 375 K, and (e) 400 K.
|
Table 1. Extracted Gaussian-distributed defect parameters of N2-doped UNCD/a-C:H films characterized at different temperatures.

Set citation alerts for the article
Please enter your email address
© Copyright 2018-2021 | Chinese Laser Press. All Rights Reserved 沪ICP备15018463号-20