• Journal of Semiconductors
  • Vol. 42, Issue 5, 051001 (2021)
Enqing Zhang1,2, Zhengkun Xing1,2, Dian Wan1,2, Haoran Gao1,2..., Yingdong Han1,2, Yisheng Gao3, Haofeng Hu1,2, Zhenzhou Cheng1,2,4 and Tiegen Liu1,2|Show fewer author(s)
Author Affiliations
  • 1School of Precision Instruments and Opto-electronics Engineering, Tianjin University, Tianjin 300072, China
  • 2Key Laboratory of Opto-electronics Information Technology, Ministry of Education, Tianjin 300072, China
  • 3Department of Electrical Engineering, The Hong Kong Polytechnic University, Hong Kong, China
  • 4Department of Chemistry, The University of Tokyo, Tokyo 113-0033, Japan
  • show less
    DOI: 10.1088/1674-4926/42/5/051001 Cite this Article
    Enqing Zhang, Zhengkun Xing, Dian Wan, Haoran Gao, Yingdong Han, Yisheng Gao, Haofeng Hu, Zhenzhou Cheng, Tiegen Liu. Surface-enhanced Raman spectroscopy chips based on two-dimensional materials beyond graphene[J]. Journal of Semiconductors, 2021, 42(5): 051001 Copy Citation Text show less
    (Color online) Schematics of the mechanisms of SERS. (a) With respect to EMs, when the incident laser is in resonance with the nanoparticle LSPR frequency, the incident laser excites electrons on the metal surface, leading to a polarization of charge and oscillating dipoles. As the frequencies of Raman scattering light are close to that of the incident laser, the resonance also increases the intensity of the Raman scattering light. (b) For CMs, electrons are transferred from the Fermi level of the substrate to the LUMO of the molecule, thereby forming a charge transfer intermediate. The energy transition () between the Fermi level of the substrate and LUMO is much stronger than that () between the highest occupied molecular orbit (HOMO) and LUMO, resulting in a higher Raman scattering cross-section.
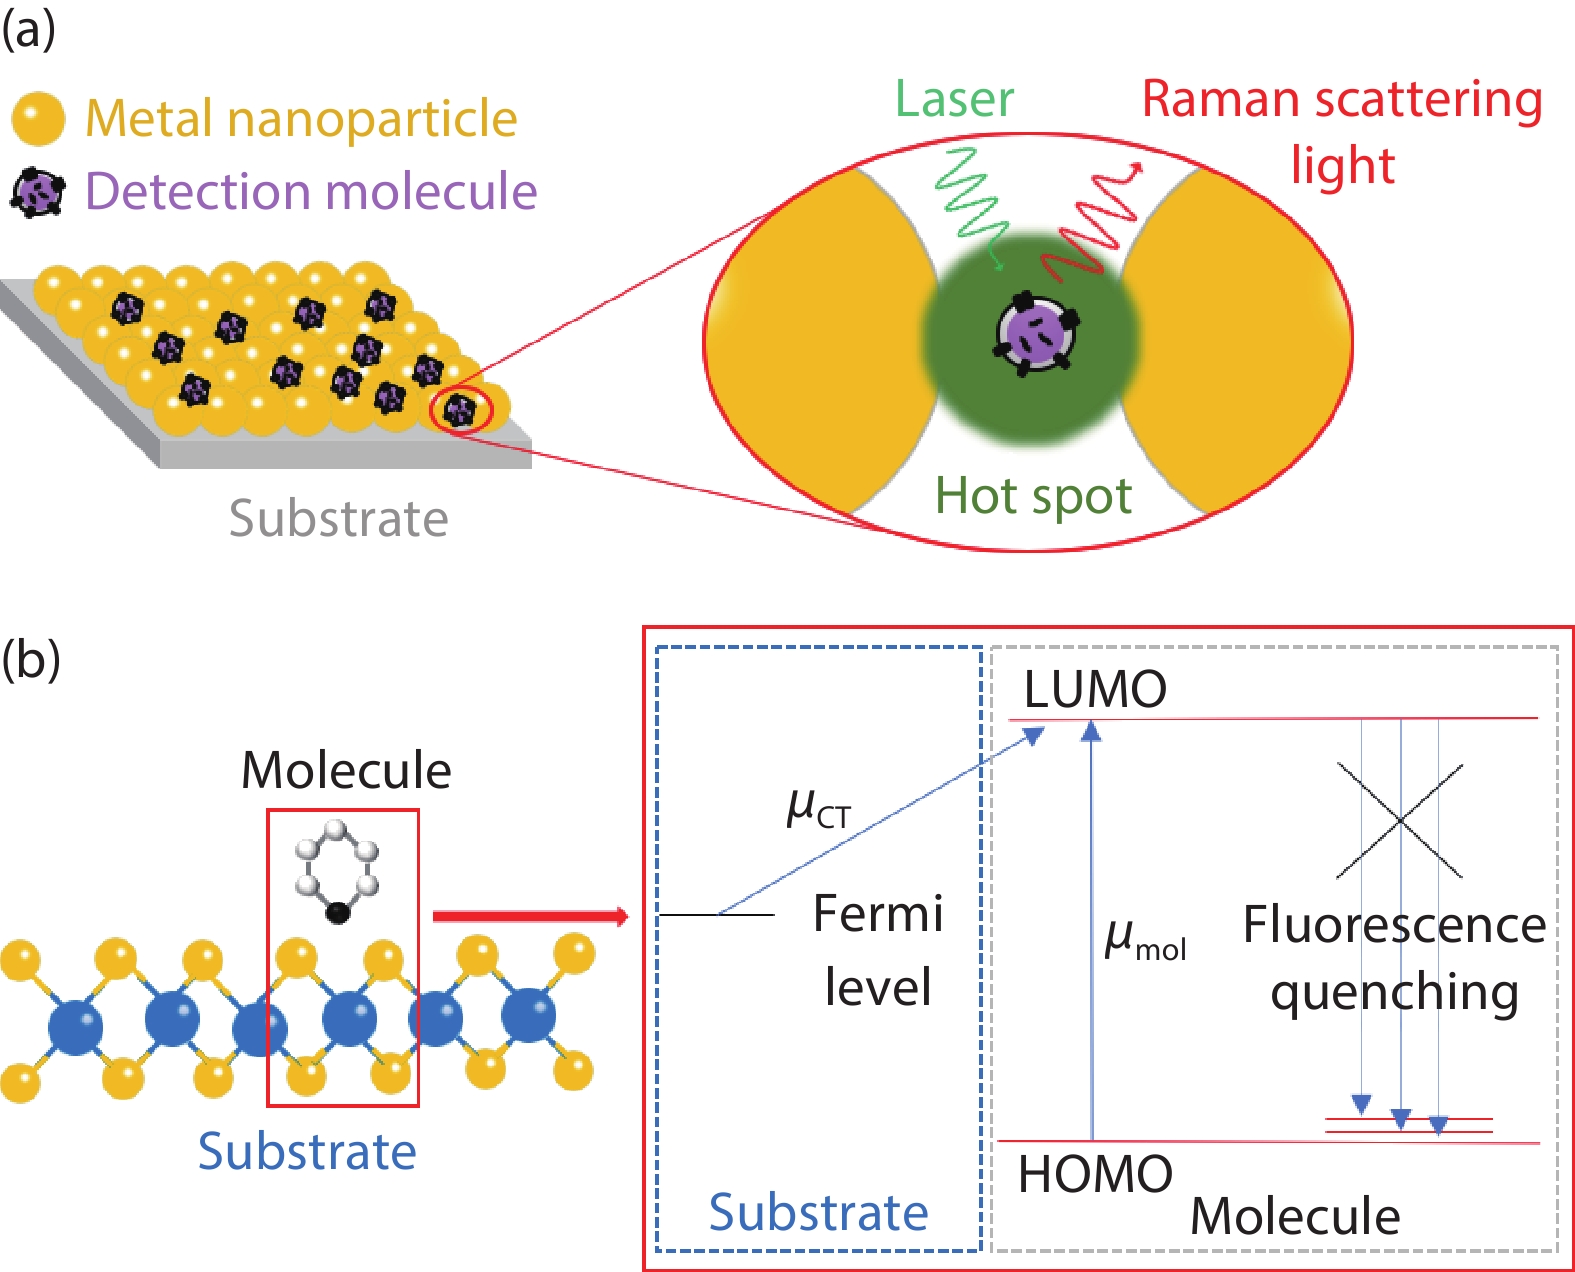
    Fig. 1. (Color online) Schematics of the mechanisms of SERS. (a) With respect to EMs, when the incident laser is in resonance with the nanoparticle LSPR frequency, the incident laser excites electrons on the metal surface, leading to a polarization of charge and oscillating dipoles. As the frequencies of Raman scattering light are close to that of the incident laser, the resonance also increases the intensity of the Raman scattering light. (b) For CMs, electrons are transferred from the Fermi level of the substrate to the LUMO of the molecule, thereby forming a charge transfer intermediate. The energy transition ( ) between the Fermi level of the substrate and LUMO is much stronger than that ( ) between the highest occupied molecular orbit (HOMO) and LUMO, resulting in a higher Raman scattering cross-section.
    (Color online) Comparison of various 2D materials beyond graphene for SERS applications, including TMDs, BP, h-BN, MXenes, and their heterostructures.
    Fig. 2. (Color online) Comparison of various 2D materials beyond graphene for SERS applications, including TMDs, BP, h-BN, MXenes, and their heterostructures.
    (Color online) SERS studies based on TMDs. (a) Schematic of measurement and enhanced Raman spectra of 4-mercaptopyridine on monolayer MoS2. (b) Energy levels of the oxygen-incorporation MoS2-R6G system. Here, and denote exciton transition and molecular transition, and denotes PICT. (c) Measured Raman spectra of R6G molecules on 1T MoSe2, 1T MoS2, 2H MoSe2, and 2H MoS2 substrates. (d) Measured Raman spectra of R6G on a 1T’-WTe2 substrate, with and without the DBR. (a) is reprinted with permission from Ref. [50]. Copyright © 2016 American Chemical Society. (b) is reprinted with permission from Ref. [53]. Copyright © 2017, Nature Publishing Group. (c) is reprinted with permission from Ref. [57]. Copyright © 2017 WILEY-VCH Verlag GmbH & Co. KGaA, Weinheim. (d) is reprinted with permission from Ref. [ 58]. Copyright © 2018 American Chemical Society.
    Fig. 3. (Color online) SERS studies based on TMDs. (a) Schematic of measurement and enhanced Raman spectra of 4-mercaptopyridine on monolayer MoS2. (b) Energy levels of the oxygen-incorporation MoS2-R6G system. Here, and denote exciton transition and molecular transition, and denotes PICT. (c) Measured Raman spectra of R6G molecules on 1T MoSe2, 1T MoS2, 2H MoSe2, and 2H MoS2 substrates. (d) Measured Raman spectra of R6G on a 1T’-WTe2 substrate, with and without the DBR. (a) is reprinted with permission from Ref. [50]. Copyright © 2016 American Chemical Society. (b) is reprinted with permission from Ref. [53]. Copyright © 2017, Nature Publishing Group. (c) is reprinted with permission from Ref. [57]. Copyright © 2017 WILEY-VCH Verlag GmbH & Co. KGaA, Weinheim. (d) is reprinted with permission from Ref. [ 58]. Copyright © 2018 American Chemical Society.
    (Color online) SERS studies based on h-BN, BP, and MXenes. (a) Preparation of SERS chips based on graphene, h-BN, and MoS2. The layered 2D materials are shown in gray, while probe molecules are shown in red. (b) Raman spectra of CuPc molecules on SiO2/Si (black line), MoS2 (green line), h-BN (red line), and graphene (blue line) substrates. (c) Raman spectra of RhB molecules (~10–8 M) on a BP substrate, showing different Raman peaks, which could be attributed to different vibrational transitions in the RhB molecules. (d) Schematic of Ti2NTx, etched and delaminated from Ti2AlN, and employed as a SERS substrate. (a) and (b) are reprinted with permission from Ref. [68]. © 2019 Wiley‐VCH Verlag GmbH & Co. KGaA, Weinheim. (c) is reprinted with permission from Ref. [ 80]. Copyright © 2019 the Royal Society of Chemistry. (d) is reprinted with permission from Ref. [92]. Copyright © 2017 American Chemical Society.
    Fig. 4. (Color online) SERS studies based on h-BN, BP, and MXenes. (a) Preparation of SERS chips based on graphene, h-BN, and MoS2. The layered 2D materials are shown in gray, while probe molecules are shown in red. (b) Raman spectra of CuPc molecules on SiO2/Si (black line), MoS2 (green line), h-BN (red line), and graphene (blue line) substrates. (c) Raman spectra of RhB molecules (~10–8 M) on a BP substrate, showing different Raman peaks, which could be attributed to different vibrational transitions in the RhB molecules. (d) Schematic of Ti2NTx, etched and delaminated from Ti2AlN, and employed as a SERS substrate. (a) and (b) are reprinted with permission from Ref. [68]. © 2019 Wiley‐VCH Verlag GmbH & Co. KGaA, Weinheim. (c) is reprinted with permission from Ref. [ 80]. Copyright © 2019 the Royal Society of Chemistry. (d) is reprinted with permission from Ref. [92]. Copyright © 2017 American Chemical Society.
    (Color online) SERS studies based on 2D heterostructures. (a) Schematic of Raman measurement of CuPc molecular coating on G/W/G/W chips. (b) Raman spectra of CuPc molecular coating on G/W/G/W and G/W chips, respectively. (c) Schematic of Raman enhancement mechanism of graphene/ReOxSy-MT chips. (d) Energy level diagrams and charge transfer in the R6G-W18O49/MoS2 complex. (a) and (b) are reprinted with permission from Ref. [16]. Copyright © 2017 American Chemical Society. (c) is reprinted with permission from Ref. [98]. Copyright © 2020 American Chemical Society. (d) is reprinted with permission from Ref. [104]. Copyright © 2019 American Chemical Society.
    Fig. 5. (Color online) SERS studies based on 2D heterostructures. (a) Schematic of Raman measurement of CuPc molecular coating on G/W/G/W chips. (b) Raman spectra of CuPc molecular coating on G/W/G/W and G/W chips, respectively. (c) Schematic of Raman enhancement mechanism of graphene/ReOxSy-MT chips. (d) Energy level diagrams and charge transfer in the R6G-W18O49/MoS2 complex. (a) and (b) are reprinted with permission from Ref. [16]. Copyright © 2017 American Chemical Society. (c) is reprinted with permission from Ref. [98]. Copyright © 2020 American Chemical Society. (d) is reprinted with permission from Ref. [104]. Copyright © 2019 American Chemical Society.
    Materiala)Detection moleculeb)LOD (M)EFWavelength (nm) Ref.
    a)Materials: quantum dot MoS2 hybrid with reduced graphene oxide (MoS2 QD/rGO), wrinkled semiconducting 2H-phase MoS2 platform decorated with graphene-microflowers (GMFs/MoS2). b)Molecules: rhodamine (RhB), rhodamine 6G (R6G), crystal violet (CV), methylene blue (MB), acid blue (AB), copper phthalocyanine (CuPc), pyridine and ethanol (Py-EtOH), and 4-Mercaptopyridine (4-MPy).
    MoS2R6G10–7532[48]
    MoS24-MPy105488[50]
    MoS2Py-EtOH109555[47]
    MoS2R6G10–7532[53]
    MoS2R6G63532[52]
    MoS2R6G10–8532[55]
    WS2R6G10–8532
    WS2R6G10–7532[45]
    WS2R6G10–7532[42]
    ReS2R6G10–9532[46]
    RhB10–8532
    CV10–8532
    MB10–9532
    NbS2MeB10–14633[36]
    1T’-MoSe2R6G10–8532[57]
    SnSe2R6G10–12106532[34]
    SnS2CuPc10–1050633[33]
    WSe2CuPc10–1050633
    WSe2CuPc120532[43]
    WTe2R6G10–151010532[58]
    MoTe2R6G10–14109
    h-BNNSCuPc-miR-2110–15655[69]
    BPCuPc<10633[84]
    BPRhB10–8106532[80]
    BPCV10–5532[76]
    Ti3C2TxR6G10–7106488[91]
    MB10–7106633
    CV10–7105633
    AB10–6103514
    r-Ti3C2TxCV10–6106532[87]
    Ti3C2TxMB10–6105
    Ti3C2TxR6G10–6107532
    Ti3C2TxCV10–8532[88]
    R6G10–8104532
    MB10–7633
    Ti3C2R6G10–11108532[90]
    Ti2N R6G1012532[92]
    Graphene/WSe2CuPc77633[16]
    MoS2 QD/rGO R6G10–9107532[99]
    MB10–8532
    MoS2/ graphene R6G10–12532[98]
    R6G10–11532
    W18O49/ MoS2R6G10–10107532[104]
    GMFs/ W-MoS2MB10–10[100]
    Adenosine10–9
    Table 1. Comparison of SERS results based on different substrates.
    Enqing Zhang, Zhengkun Xing, Dian Wan, Haoran Gao, Yingdong Han, Yisheng Gao, Haofeng Hu, Zhenzhou Cheng, Tiegen Liu. Surface-enhanced Raman spectroscopy chips based on two-dimensional materials beyond graphene[J]. Journal of Semiconductors, 2021, 42(5): 051001
    Download Citation