• Photonics Research
  • Vol. 10, Issue 7, 1763 (2022)
Pawan Kumar1、2、*, Sina Saravi1, Thomas Pertsch1、2, Frank Setzpfandt1, and Andrey A. Sukhorukov3、4
Author Affiliations
  • 1Institute of Applied Physics, Abbe Center of Photonics, Friedrich Schiller University Jena, 07745 Jena, Germany
  • 2Fraunhofer Institute for Applied Optics and Precision Engineering, 07745 Jena, Germany
  • 3Research School of Physics, Australian National University, Canberra, ACT 2601, Australia
  • 4ARC Centre of Excellence for Transformative Meta-Optical Systems (TMOS), Australia
  • show less
    DOI: 10.1364/PRJ.450410 Cite this Article Set citation alerts
    Pawan Kumar, Sina Saravi, Thomas Pertsch, Frank Setzpfandt, Andrey A. Sukhorukov. Nonlinear quantum spectroscopy with parity–time-symmetric integrated circuits[J]. Photonics Research, 2022, 10(7): 1763 Copy Citation Text show less
    (a) Sketch of hybrid nonlinear interferometer incorporating a PT coupler for sensing of analyte-induced absorption (γi) in waveguide Wg-2. Dependence of (b) real and (c) imaginary parts of normalized eigenvalues, λ˜±/Ci, which account for the loss and wavenumber respectively, on the normalized loss γi/Ci for the two idler supermodes of symmetric PT coupler composed of Wg-1 and Wg-2.
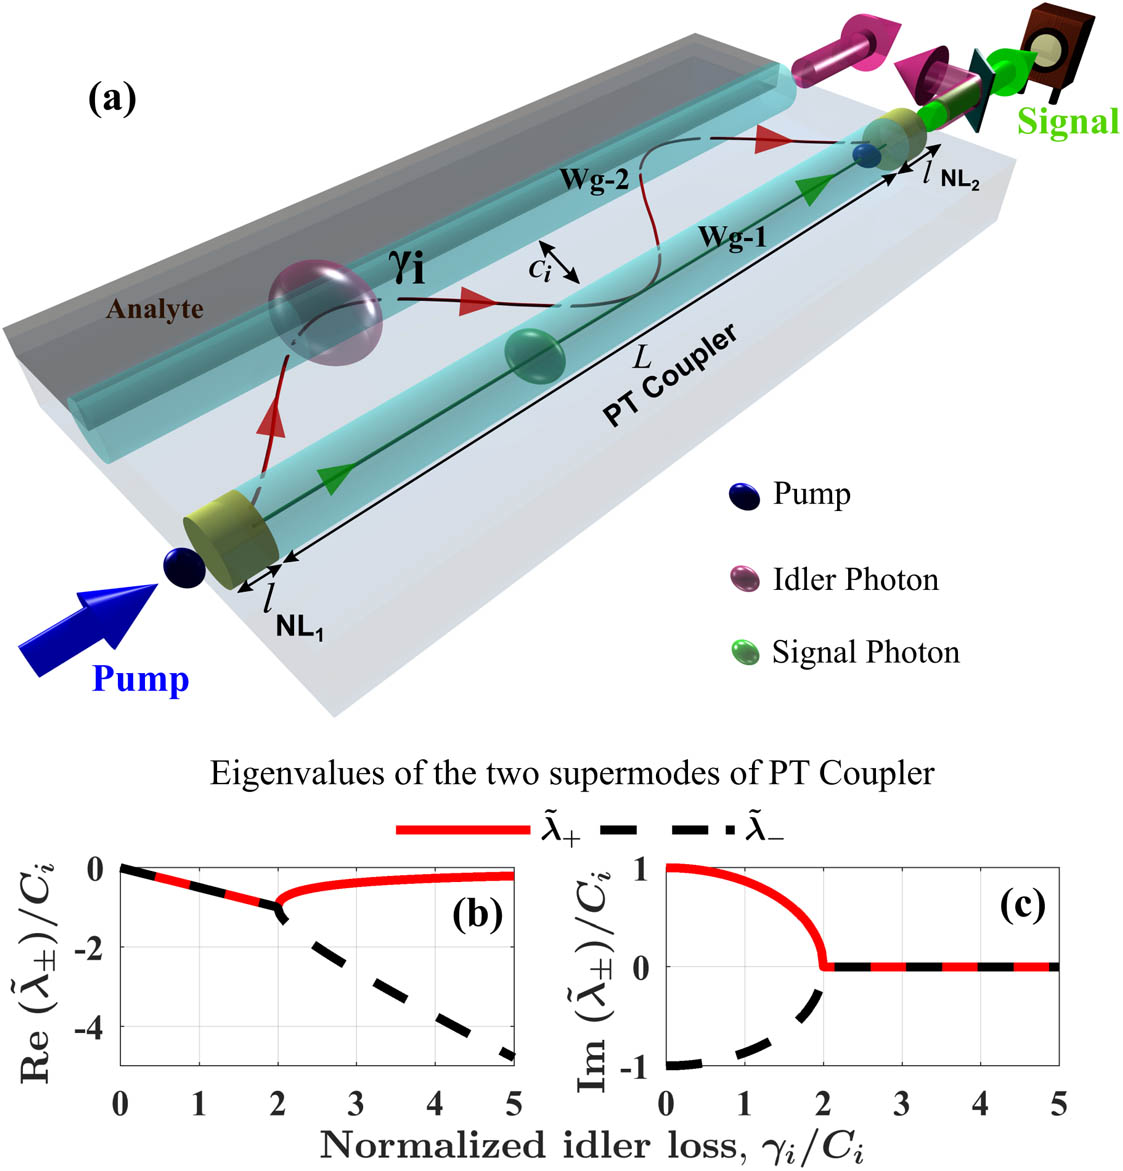
    Fig. 1. (a) Sketch of hybrid nonlinear interferometer incorporating a PT coupler for sensing of analyte-induced absorption (γi) in waveguide Wg-2. Dependence of (b) real and (c) imaginary parts of normalized eigenvalues, λ˜±/Ci, which account for the loss and wavenumber respectively, on the normalized loss γi/Ci for the two idler supermodes of symmetric PT coupler composed of Wg-1 and Wg-2.
    (a) Top panel shows waveguides in which signal and idler photons are present for the biphoton (I11 & I12) and single photon I12(s) intensity contributions (see text for their description). (b) For lossless PT coupler, biphoton amplitudes from sources NL1 and NL2 interfere destructively. (c) At the critical loss, γi=γcr, pair generation in NL1 and NL2 becomes totally distinguishable and their amplitudes add up incoherently. (d) In the broken PT regime, the nonlinear interferometer exhibits increased indistinguishability and coherence between pair generation amplitudes from the two sources. In (b)–(d), a special coupler design with CiL=π is considered.
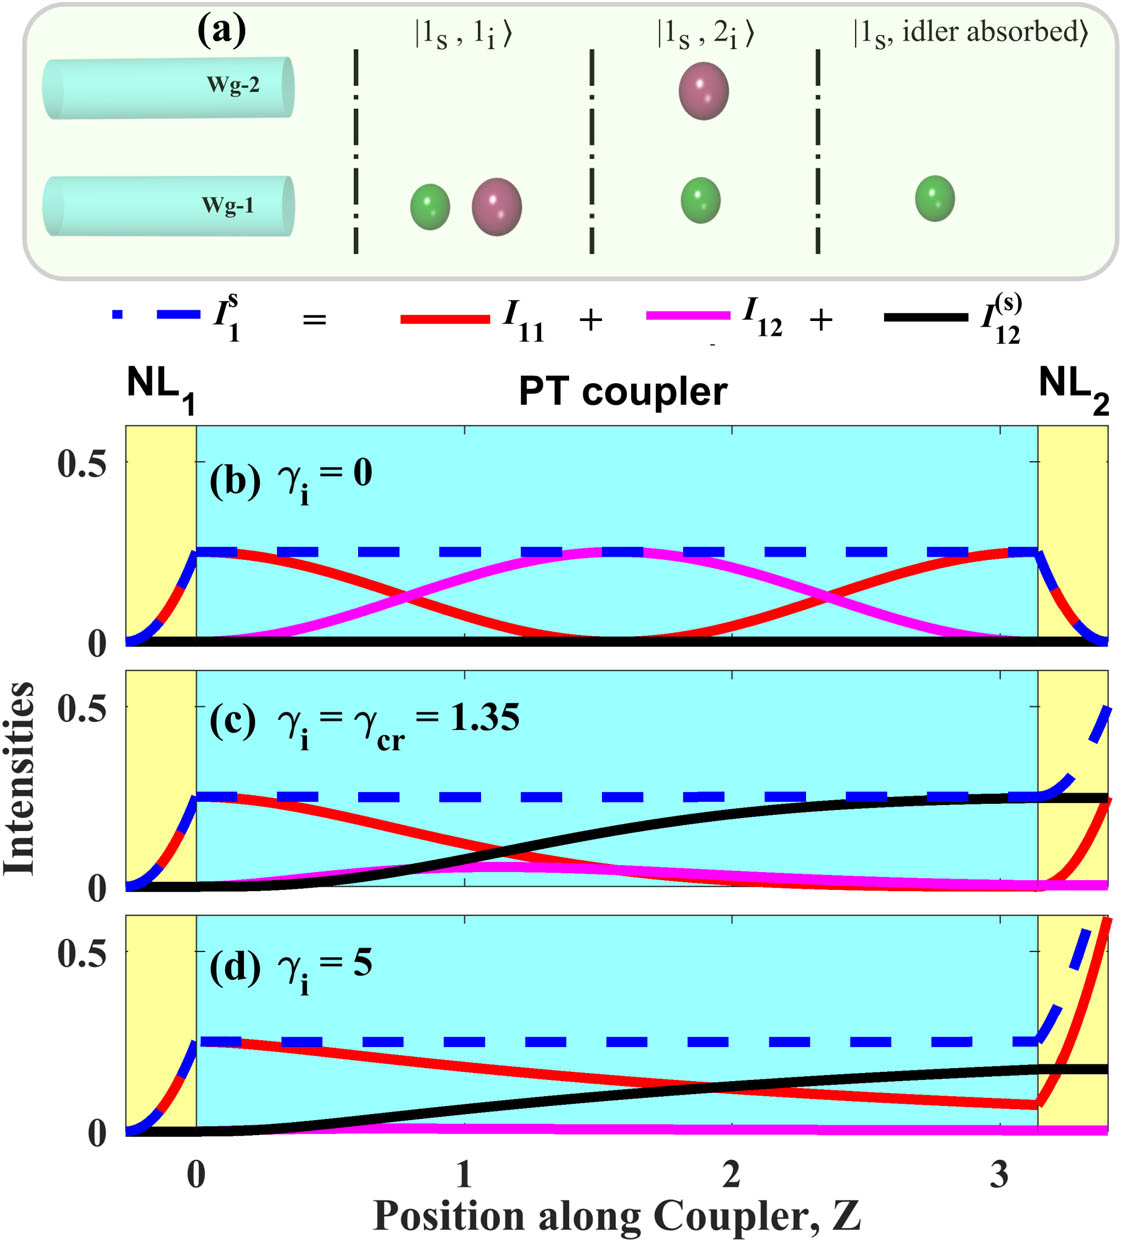
    Fig. 2. (a) Top panel shows waveguides in which signal and idler photons are present for the biphoton (I11 & I12) and single photon I12(s) intensity contributions (see text for their description). (b) For lossless PT coupler, biphoton amplitudes from sources NL1 and NL2 interfere destructively. (c) At the critical loss, γi=γcr, pair generation in NL1 and NL2 becomes totally distinguishable and their amplitudes add up incoherently. (d) In the broken PT regime, the nonlinear interferometer exhibits increased indistinguishability and coherence between pair generation amplitudes from the two sources. In (b)–(d), a special coupler design with CiL=π is considered.
    Normalized total signal intensity I1s versus the idler absorption strength (γi) and phase mismatch parameter (ΔβNL). (a) In a symmetric coupler, βi(2)=βi(1), the signal intensity fringe position exhibits a sharp shift by half a period at the critical loss γi=γcr. (b) For the asymmetric coupler with Δβi=0.2, the signal fringe position shifts gradually with the absorption strength. For all the plots, CiL=π and Ci=1.
    Fig. 3. Normalized total signal intensity I1s versus the idler absorption strength (γi) and phase mismatch parameter (ΔβNL). (a) In a symmetric coupler, βi(2)=βi(1), the signal intensity fringe position exhibits a sharp shift by half a period at the critical loss γi=γcr. (b) For the asymmetric coupler with Δβi=0.2, the signal fringe position shifts gradually with the absorption strength. For all the plots, CiL=π and Ci=1.
    (a) Visibility V of the interference in the signal intensity at the end of the nonlinear interferometer containing the PT coupler versus the idler loss for different coupler lengths. (b) Corresponding normalized total signal intensity at ΔβNL=0. The dots denote the boundaries of regions where the visibility is below 0.05 and the intensity is close to 0.5. (c) Sensitivity |dVdγi| for visibility and (d) sensitivity |dI1sdγi| for narrowband signal intensity measurements.
    Fig. 4. (a) Visibility V of the interference in the signal intensity at the end of the nonlinear interferometer containing the PT coupler versus the idler loss for different coupler lengths. (b) Corresponding normalized total signal intensity at ΔβNL=0. The dots denote the boundaries of regions where the visibility is below 0.05 and the intensity is close to 0.5. (c) Sensitivity |dVdγi| for visibility and (d) sensitivity |dI1sdγi| for narrowband signal intensity measurements.
    Signal spectral intensity (red solid curve) from the nonlinear interferometer in the presence of a spectrally localized idler absorption profile (black solid curve) with the corresponding frequency given by Δωi=−Δωs. Comparison with the reference case of lossless idler, shown by green dotted curve, reveals that the nature of interference, constructive or destructive, switches at the critical idler loss γi=γcr represented by the two vertical dashed lines.
    Fig. 5. Signal spectral intensity (red solid curve) from the nonlinear interferometer in the presence of a spectrally localized idler absorption profile (black solid curve) with the corresponding frequency given by Δωi=Δωs. Comparison with the reference case of lossless idler, shown by green dotted curve, reveals that the nature of interference, constructive or destructive, switches at the critical idler loss γi=γcr represented by the two vertical dashed lines.
    (a) Signal intensity I1s as a function of phase mismatch ΔβNL and idler loss γi. (b), (c), and (d) show the three individual contributions to the total signal intensity. I12 and I12(s) are devoid of any interference fringes unlike I11.
    Fig. 6. (a) Signal intensity I1s as a function of phase mismatch ΔβNL and idler loss γi. (b), (c), and (d) show the three individual contributions to the total signal intensity. I12 and I12(s) are devoid of any interference fringes unlike I11.
    Signal intensity fringes for different relative phases K(L+l) in the interferometer. The feature of fringe shift occurs in each case at the same idler loss value irrespective of K(L+l) phases.
    Fig. 7. Signal intensity fringes for different relative phases K(L+l) in the interferometer. The feature of fringe shift occurs in each case at the same idler loss value irrespective of K(L+l) phases.
    Illustration of the condition for existence of critical idler loss, γcr is CiL>π/2, for different L values as indicated by labels. (a)–(d) When CiL≤π/2, no critical loss points are observed and hence no shift in the fringes. (e), (f) For CiL=π, a fringe shift is observed. (a), (c), (e) Fringe visibility; (b), (d), (f) signal intensity fringes. For all the plots Ci=1.
    Fig. 8. Illustration of the condition for existence of critical idler loss, γcr is CiL>π/2, for different L values as indicated by labels. (a)–(d) When CiLπ/2, no critical loss points are observed and hence no shift in the fringes. (e), (f) For CiL=π, a fringe shift is observed. (a), (c), (e) Fringe visibility; (b), (d), (f) signal intensity fringes. For all the plots Ci=1.
    Signal intensity I1s for nonlinear interferometers with PT couplers of length (a) L=π, (b) L=3π, and (c) L=5π. (d) Variation of the corresponding visibility with loss γi. The grayed area shows region with visibility less than or equal to 0.05.
    Fig. 9. Signal intensity I1s for nonlinear interferometers with PT couplers of length (a) L=π, (b) L=3π, and (c) L=5π. (d) Variation of the corresponding visibility with loss γi. The grayed area shows region with visibility less than or equal to 0.05.
    Comparison of the performance of the proposed interferometer (incorporating the PT coupler) with that of the conventional integrated nonlinear interferometer with two separated sources in a single waveguide (single Wg). (a) Signal intensity, (b) visibility, (c) slope of signal intensity, and (d) slope of visibility for the two cases.
    Fig. 10. Comparison of the performance of the proposed interferometer (incorporating the PT coupler) with that of the conventional integrated nonlinear interferometer with two separated sources in a single waveguide (single Wg). (a) Signal intensity, (b) visibility, (c) slope of signal intensity, and (d) slope of visibility for the two cases.
    Signal intensity fringes in the presence of waveguide asymmetry in the coupler with (a) Δβi=0.2 and (b) Δβi=2. The coupling constant in both cases is Ci=1.
    Fig. 11. Signal intensity fringes in the presence of waveguide asymmetry in the coupler with (a) Δβi=0.2 and (b) Δβi=2. The coupling constant in both cases is Ci=1.
    Pawan Kumar, Sina Saravi, Thomas Pertsch, Frank Setzpfandt, Andrey A. Sukhorukov. Nonlinear quantum spectroscopy with parity–time-symmetric integrated circuits[J]. Photonics Research, 2022, 10(7): 1763
    Download Citation