• Photonics Research
  • Vol. 8, Issue 4, 457 (2020)
Marco Passoni1, Dario Gerace1, Liam O’Faolain2、3, and Lucio Claudio Andreani1、4、*
Author Affiliations
  • 1Department of Physics, University of Pavia, 27100 Pavia, Italy
  • 2Centre for Advanced Photonics and Process Analysis, Cork Institute of Technology, Cork, Ireland
  • 3Tyndall National Institute, Cork, Ireland
  • 4Institute for Photonics and Nanotechnologies (IFN)-CNR, 20133 Milano, Italy
  • show less
    DOI: 10.1364/PRJ.382620 Cite this Article Set citation alerts
    Marco Passoni, Dario Gerace, Liam O’Faolain, Lucio Claudio Andreani. Optimizing an interleaved p-n junction to reduce energy dissipation in silicon slow-light modulators[J]. Photonics Research, 2020, 8(4): 457 Copy Citation Text show less
    Schematic of the slow-light waveguide with definition of the structure (a) in 3D and (b) in top view with grating parameters and (c) doping profiles. The silicon material in (a) and (b) (orange) is fully embedded in SiO2 (gray). In panel (c), the boundary between p and n regions, which is perpendicular to the waveguide axis, can be either placed at the center of the wide grating section (left part) or displaced along the waveguide direction by the parameter Off (right part).
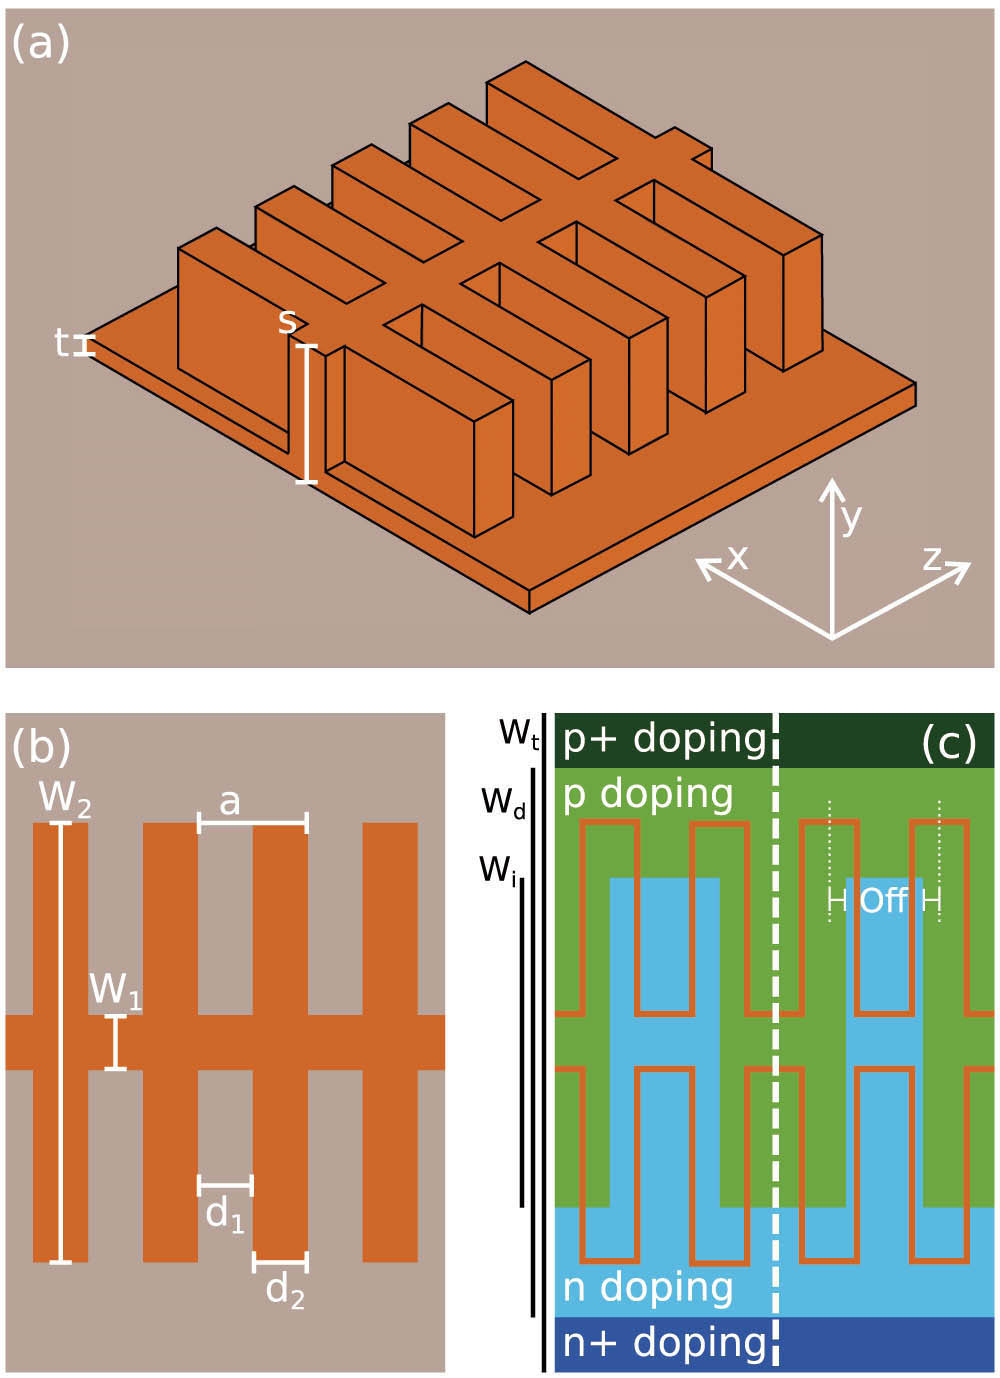
    Fig. 1. Schematic of the slow-light waveguide with definition of the structure (a) in 3D and (b) in top view with grating parameters and (c) doping profiles. The silicon material in (a) and (b) (orange) is fully embedded in SiO2 (gray). In panel (c), the boundary between p and n regions, which is perpendicular to the waveguide axis, can be either placed at the center of the wide grating section (left part) or displaced along the waveguide direction by the parameter Off (right part).
    Group index (left scale) and propagation loss per unit length at zero bias (right scale) as a function of wavelength. Parameters: see discussion in Section 2, in particular Wi=0.6 μm, N=P=8×1017 cm−3, Off=0.
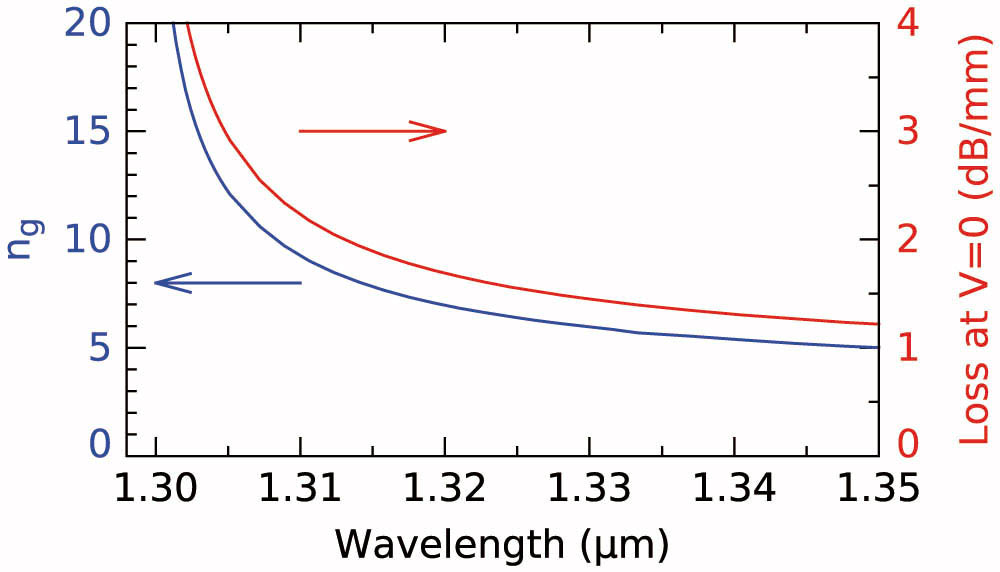
    Fig. 2. Group index (left scale) and propagation loss per unit length at zero bias (right scale) as a function of wavelength. Parameters: see discussion in Section 2, in particular Wi=0.6  μm, N=P=8×10¹⁷  cm3, Off=0.
    (a) Capacitance per unit length (left scale) and resistance times length (right scale). (b) 3 dB cutoff frequency as a function of reverse voltage. Parameters: see discussion in Section 2, in particular Wi=0.6 μm, N=P=8×1017 cm−3, Off=0.
    Fig. 3. (a) Capacitance per unit length (left scale) and resistance times length (right scale). (b) 3 dB cutoff frequency as a function of reverse voltage. Parameters: see discussion in Section 2, in particular Wi=0.6  μm, N=P=8×10¹⁷  cm3, Off=0.
    (Upper panels) VπLπ, (lower panels) IL(Lπ) for phase shifters in four different configurations (see text).
    Fig. 4. (Upper panels) VπLπ, (lower panels) IL(Lπ) for phase shifters in four different configurations (see text).
    (a), (b) Charge densities for V=0 V or V=1 V, respectively. (c) Difference in charge density from 0 to 1 V. (d) Electric field (modulus) at λ=1.315 μm. The values are taken at a height of 155 nm from the bottom of the waveguide and span one period a=0.234 μm along the propagation direction z.
    Fig. 5. (a), (b) Charge densities for V=0  V or V=1  V, respectively. (c) Difference in charge density from 0 to 1 V. (d) Electric field (modulus) at λ=1.315  μm. The values are taken at a height of 155 nm from the bottom of the waveguide and span one period a=0.234  μm along the propagation direction z.
    (a) Schematic structure of a Mach–Zehnder interferometer and (b) output power as a function of the phase difference between the arms (with definition of the quadrature working point): solid, Pout, dashed, P¯out.
    Fig. 6. (a) Schematic structure of a Mach–Zehnder interferometer and (b) output power as a function of the phase difference between the arms (with definition of the quadrature working point): solid, Pout, dashed, P¯out.
    (a) Transmission spectrum and (b) extinction ratio and total loss of an MZ modulator with length 0.5 mm and bias 1 V.
    Fig. 7. (a) Transmission spectrum and (b) extinction ratio and total loss of an MZ modulator with length 0.5 mm and bias 1 V.
    Normalized OMA as a function of wavelength for different modulator lengths and applied voltages.
    Fig. 8. Normalized OMA as a function of wavelength for different modulator lengths and applied voltages.
    Minimum normalized OMA level as a function of modulator length, for different bandwidths (bw) and applied voltages. Upper panels: slow-light waveguide with interleaved p-n junction. Lower panels: rib waveguide with interleaved p-n junction, notice that the three curves with bw=10, 20, 30 nm are coincident. The upper scale of the x axis represents the dissipated energy per bit, calculated as Ebit=CV2/2, where the capacitance is proportional to the modulator length.
    Fig. 9. Minimum normalized OMA level as a function of modulator length, for different bandwidths (bw) and applied voltages. Upper panels: slow-light waveguide with interleaved p-n junction. Lower panels: rib waveguide with interleaved p-n junction, notice that the three curves with bw=10, 20, 30 nm are coincident. The upper scale of the x axis represents the dissipated energy per bit, calculated as Ebit=CV2/2, where the capacitance is proportional to the modulator length.
    (a) Normalized OMA as a function of wavelength for an L=0.5 mm modulator. (b) Minimum normalized OMA level as a function of modulator length for 10 nm bandwidth, for different values of the additional disorder-induced loss. The upper x scale in (b) represents the dissipated energy per bit, as in Fig. 9. The reverse applied voltage is V=1 V.
    Fig. 10. (a) Normalized OMA as a function of wavelength for an L=0.5  mm modulator. (b) Minimum normalized OMA level as a function of modulator length for 10 nm bandwidth, for different values of the additional disorder-induced loss. The upper x scale in (b) represents the dissipated energy per bit, as in Fig. 9. The reverse applied voltage is V=1  V.
    Various figures of merit: capacitance per unit length, resistance times length, 3 dB cutoff frequency, VπLπ and IL(Lπ) at λ=1.315 μm. The quantities are plotted as a function of doping level at fixed modulation width Wi=0.6 μm and offset Off=0 (left panels), as a function of modulation width at fixed doping N=P=8×1017 cm−3 and offset Off=0 (central panels), as a function of offset at fixed doping N=P=8×1017 cm−3 and modulation width Wi=0.6 μm (right panels). Green lines and symbols: V=0 V. Black lines and symbols: V=1 V. Red lines and symbols: V=2 V. Blue lines and symbols: V=3 V.
    Fig. 11. Various figures of merit: capacitance per unit length, resistance times length, 3 dB cutoff frequency, VπLπ and IL(Lπ) at λ=1.315  μm. The quantities are plotted as a function of doping level at fixed modulation width Wi=0.6  μm and offset Off=0 (left panels), as a function of modulation width at fixed doping N=P=8×10¹⁷  cm3 and offset Off=0 (central panels), as a function of offset at fixed doping N=P=8×10¹⁷  cm3 and modulation width Wi=0.6  μm (right panels). Green lines and symbols: V=0  V. Black lines and symbols: V=1  V. Red lines and symbols: V=2  V. Blue lines and symbols: V=3  V.
    Marco Passoni, Dario Gerace, Liam O’Faolain, Lucio Claudio Andreani. Optimizing an interleaved p-n junction to reduce energy dissipation in silicon slow-light modulators[J]. Photonics Research, 2020, 8(4): 457
    Download Citation