
Fupei Wu, Shukai Zhu, Shengping Li. Coplanarity Inspection Method for Integrated Circuit Pins Based on Single Image[J]. Acta Optica Sinica, 2020, 40(1): 0111023
- Acta Optica Sinica
- Vol. 40, Issue 1, 0111023 (2020)

Fig. 1. Flow chart of monocular vision system
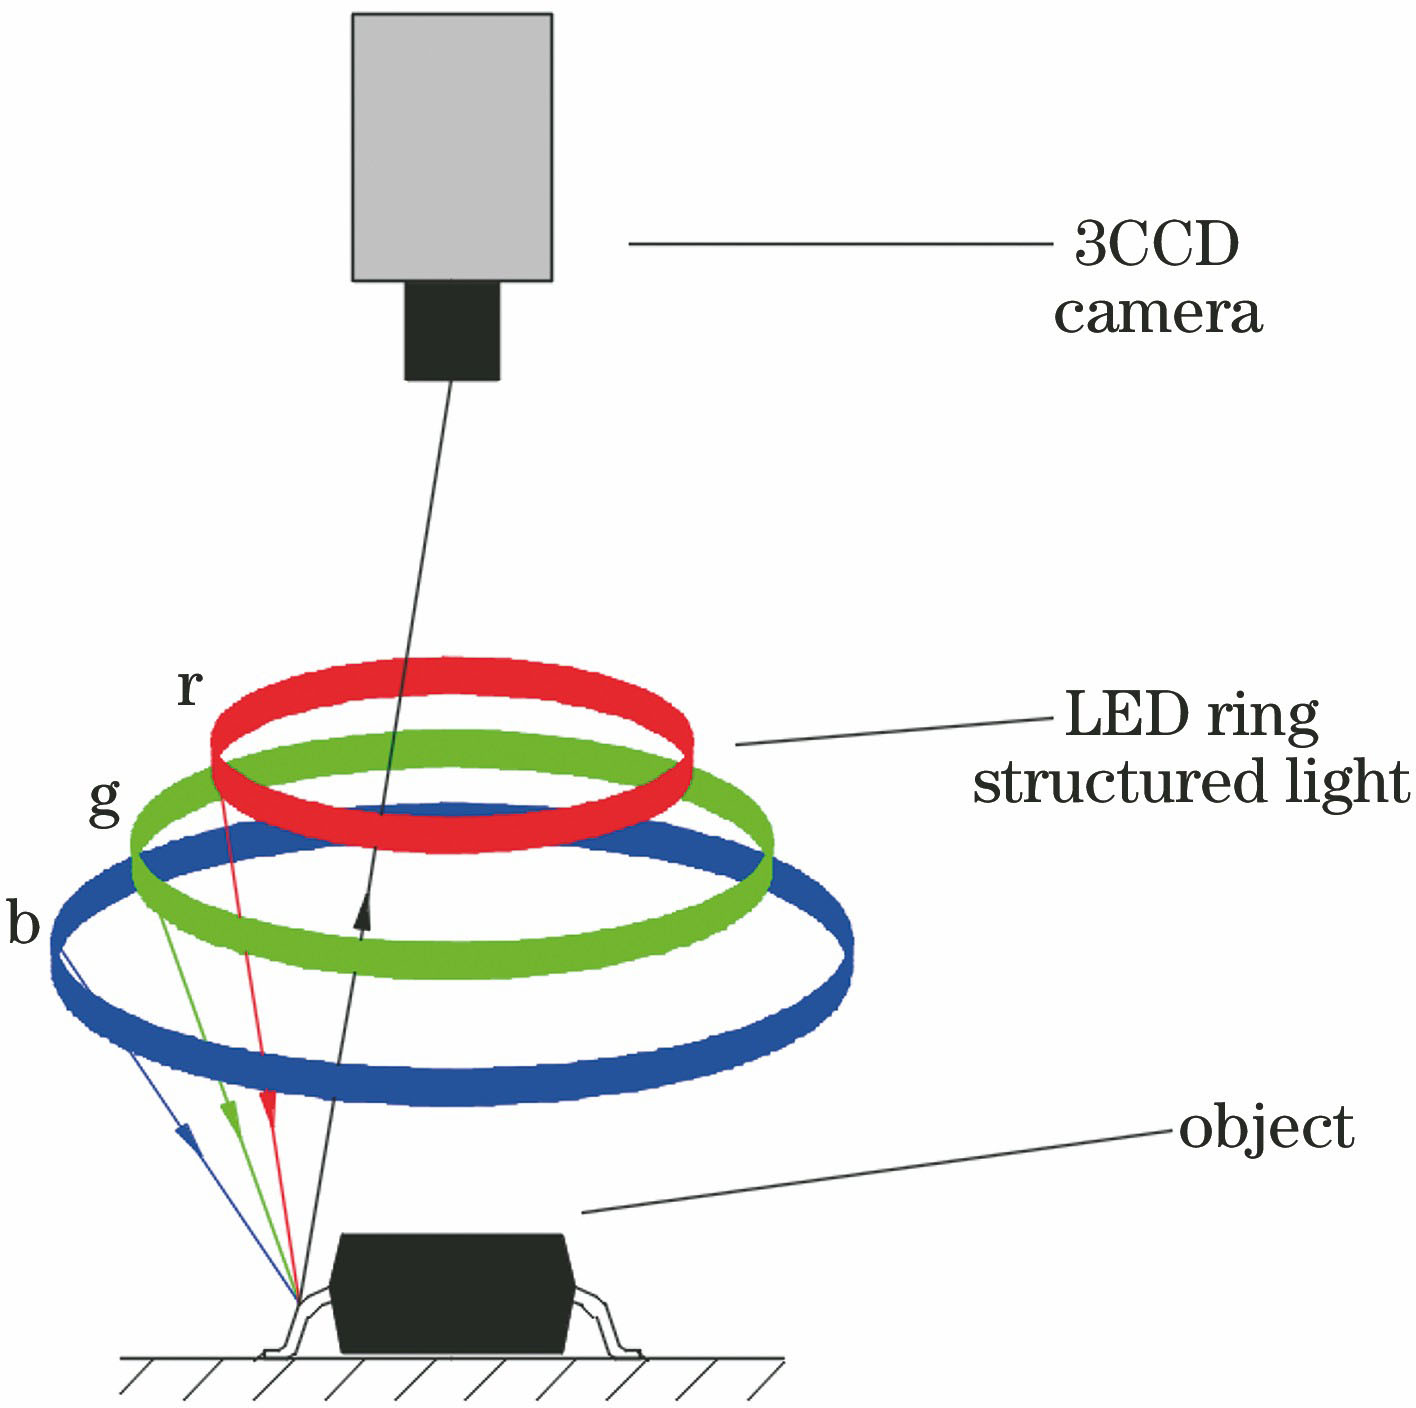
Fig. 2. Diagram of monocular vision system
Fig. 3. Model of monocular vision system. (a) Illumination model; (b) simplified model
Fig. 4. IC diagrams. (a) Original image; (b) red channel; (c) green channel; (d) blue channel
Fig. 5. Reconstruction result of IC. (a) Sideview of IC; (b) Y direction view of IC
Fig. 6. Cross-sections of IC. (a) Cross-section of IC solder joints; (b) cross-section of IC pins
Fig. 7. Laser triangulation[17]
Fig. 8. Reconstruction results of IC by using gray superposition method. (a) Sideview of IC; (b) Y direction view of IC
Fig. 9. Cross-sections of IC by using gray superposition method. (a) Cross-section of IC solder joints; (b) cross-section of IC pins
Fig. 10. Probability distribution of IC reconstruction results
|
Table 1. Effect coefficient of material on light
| |||||||||||||||||||||||||||||||||||||||||||||||||||||||||||||||||||||||||||||||||||||||||||||||||||||||||||||
Table 2. 3D detection results of IC solder joints and pinsmm
| |||||||||||||||||||||||||||||||||||||||||||||||||||||||||||||||||||||||||||||||||||||||||||||||||||||||||||||
Table 3. 3D detection results of IC solder joints and pins based on gray superposition methodmm

Set citation alerts for the article
Please enter your email address
© Copyright 2018-2021 | Chinese Laser Press. All Rights Reserved 沪ICP备15018463号-20