Author Affiliations
1State Key Laboratory of Nuclear Resources and Environment, East China University of Technology, Nanchang 330013, China2College of Nuclear Science and Engineering, East China University of Technology, Nanchang 330013, China3Center for Computational Materials Science, Department of Physics, University of Malakand, Chakdara, Pakistan4College of Physics and Optoelectronic Engineering, Shenzhen University, Shenzhen 518060, China5College of Electronic Science and Technology, Shenzhen University, Shenzhen 518000, Chinashow less
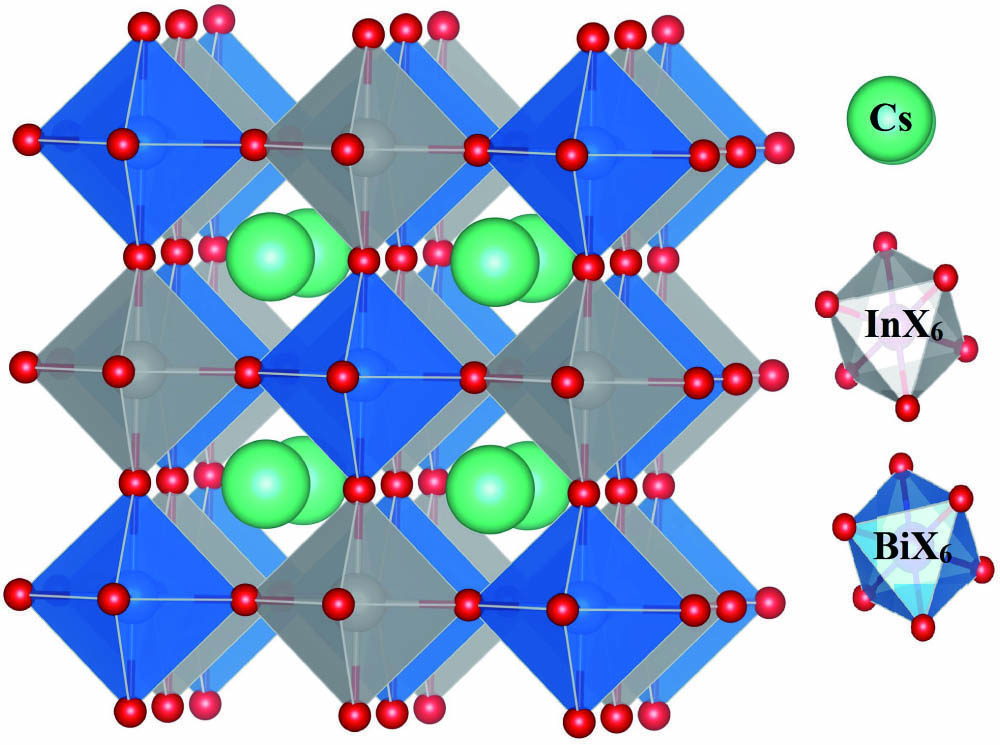
Fig. 1. Unit cell structure of (X = F, Cl, Br, and I).
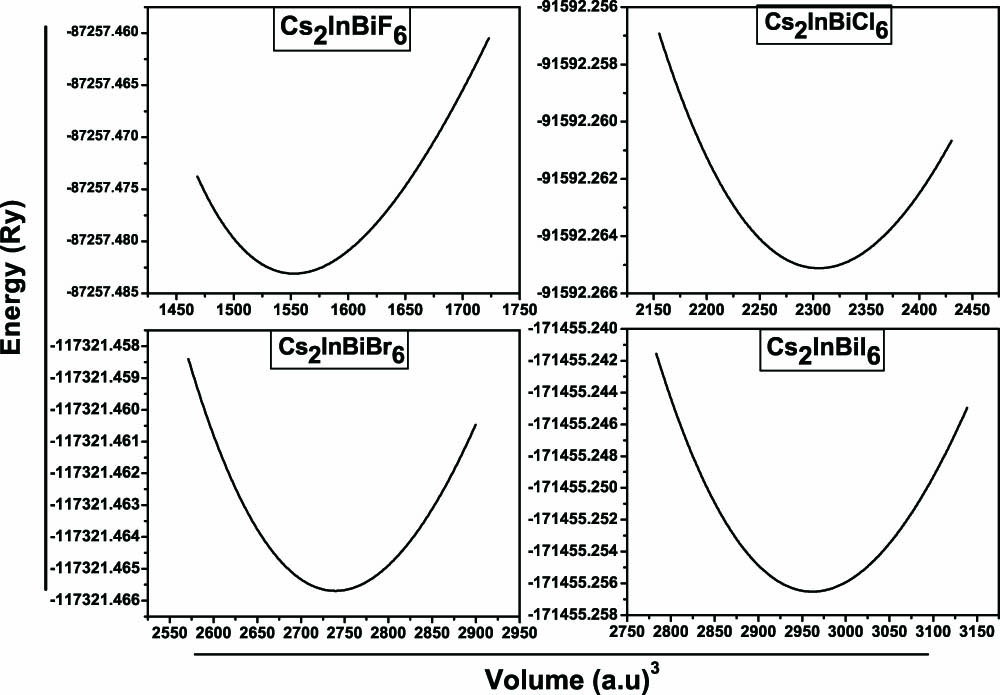
Fig. 2. Energy versus volume optimization curves of (X = F, Cl, Br, I).
Fig. 3. Electronic charge density contours in the [100,110] planes.
Fig. 4. Electronic band structures of (X = F, Cl, Br, I).
Fig. 5. Total density of states of (X = F, Cl, Br, I).
Fig. 6. Partial density of states of (X = F, Cl, Br, I).
Fig. 7. Frequency dependent optical parameters of (X = F, Cl, Br, I).
Parameters | X = F | X = Cl | X = Br | X = I |
---|
a (Å) | | 9.70 | 11.07 | 11.30 | 12.32 | | | 9.80a | 11.44a | 11.93a | 12.69a | τ | Eq. (1) | 0.95 | 0.90 | 0.89 | 0.87 | Eq. (3) | 3.49 | 4.01 | 4.07 | 4.13 | μ | | 0.68 | 0.53 | 0.47 | 0.44 | rij (Å) | Bi–X (x6) | 2.25 | 2.73 | 2.79 | 2.82 | In–X (x6) | 2.60 | 3.00 | 3.09 | 3.15 | Cs–X (x12) | 3.43 | 4.06 | 4.12 | 4.20 | Eg (eV) | GGA | 2.01 | 0.38 | 0.25 | 0.12 | mBJ | 2.79 | 1.37 | 0.82 | 0.80 | mBJ + SOC | 1.87 | 0.87 | 0.32 | 0.23 | HSE + SOC | 2.22a | 1.02a, 0.88b | 0a, 0.33b | 0a, 0.21b | | mBJ | 0.73 | 0.52 | 0.37 | 0.28 | mBJ + SOC | 0.58 | 0.38 | 0.29 | 0.24 | HSE + SOC | 0.61a | 0.39a | 0.30a | 0.23a | | | | | 0.19c | | mBJ | 0.46 | 0.23 | 0.19 | 0.13 | mBJ + SOC | 0.37 | 0.19 | 0.14 | 0.09 | HSE + SOC | 0.39a | 0.17a | 0.11a | 0.08a | | | | | 0.25c |
|
Table 1. Calculated Tolerance Factor τ, Octahedral Factor μ, Lattice Constants a, Bond Lengths rij, Band Gap Eg, and Effective Masses of Electrons and Holes (mo) of Cs2InBiX6
Compounds | ε1(0) | n(0) |
---|
| 2.73 | 1.66 | | 4.65 | 2.10 | | 6.00 | 2.47 | | 6.10 | 2.49 | | 5.00a | 2.1a | | 6.00b | 1.68b |
|
Table 2. The Zero-Frequency Values of the Real Part of the Dielectric Function and Refractive Index
Parameters | X = F | X = Cl | X = Br | X = I |
---|
(GPa) | 98 | 81 | 105 | 71 | (GPa) | 35 | 28 | 31 | 20 | (GPa) | 57 | 44 | 41 | 62 | (GPa) | 46.8 | 37.0 | 39.4 | 47.4 | (GPa) | 43.0 | 34.8 | 39.3 | 39.4 | (GPa) | 44.9 | 35.9 | 39.3 | 43.4 | Y (GPa) | 103.2 | 87.3 | 95.6 | 99.6 | B (GPa) | 49.2 | 45.6 | 55.6 | 37.0 | B/G | 1.09 | 1.27 | 1.41 | 0.85 | C | −22 | −16 | −10 | −42 | | 0.15 | 0.18 | 0.21 | 0.05 | Z | 0.61 | 0.59 | 0.52 | 0.50 | A | 1.80 | 1.66 | 1.100 | 2.43 | | 31.5 | 26.5 | 37.00 | 25.5 | | 19.1 | 21 | 29.4 | 5.4 | | 60.7 | 37 | 39.4 | 47.4 |
|
Table 3. Calculated Values of Elastic Constants Cij, Shear Modulus G, Young's Modulus Y, Bulk Modulus B, Shear Constant C′, Cauchy Pressure C″, B/G Ratio, ν, ζ, A, λ, and µ Parameters