
Shaohao Wang, Yuhua Li, Brent E. Little, Leiran Wang, Xiang Wang, Roy R. Davidson, Sai Tak Chu. Athermal third harmonic generation in micro-ring resonators[J]. Opto-Electronic Advances, 2020, 3(12): 200028-1
- Opto-Electronic Advances
- Vol. 3, Issue 12, 200028-1 (2020)
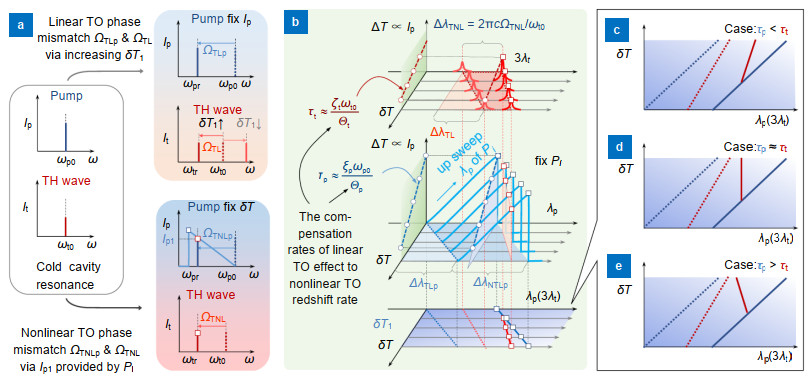
Fig. 1. (a ) The cavity resonance of MRRs can be linearly tuned by varying the chip temperature δT or nonlinearly tuned by controlling the intra-cavity pump energy I p through nonlinear TO effects. (b ) In the wavelength domain, when δT increases, the cold-cavity resonance wavelengths of the TH mode (in red dot line) and the pump mode (in blue dot line) will linearly redshift ∆λ TL and ∆λ TLp, respectively. When up sweeping the CW input pump wavelength λ p and δT are fixed, the corresponding I p will induce nonlinear redshift ∆λ TNL and ∆λ TNLp to the resonance wavelengths of the TH and pump modes, respectively. For the pump mode, when λ p is fixed, the trace of blue open circles determines τ p which is the ratio between δT and I p. Similarly, the trace of red open circles in the upper part of (b) gives the ratio τ p. The overall effects of ∆λ TL and ∆λ TNL determine the effective TDWS of the TH mode which becomes a δT -λ p relationship by mapping the trace of red open squares to the lower part of (b). For the pump mode, its TDWS is only related the linear TO redshift ∆λ TLp whose trace was shown as blue open squares plotted in the δT -λ p diagram. (c – e ) The thermal mismatch between τ p and τ t will determine the effective TDWS of the TH mode, which leads to (c) a positive TDWS when τ p < τ t and (d) a zero TDWS when τ p ≈ τ t and (e) a negative TDWS when τ p > τ t in the δT -λ p diagram.
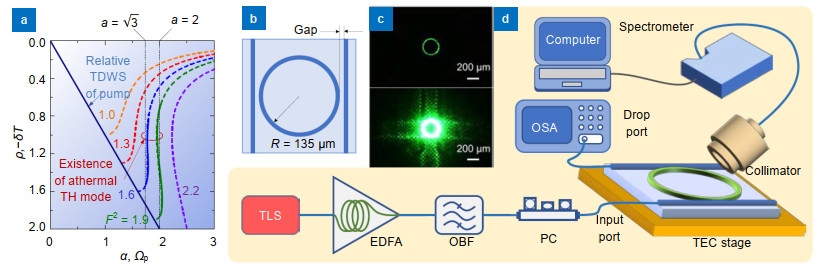
Fig. 2. (a ) The relationship between the normalized pump detuning α and the intra-cavity pump power ρ when the input pump power F 2 is fixed. The existence of stable athermal TH modes were shown in blue (F 2 = 1.6) and green (F 2 = 1.9) solid lines when |α | > \begin{document}$\sqrt 3 $\end{document} b ) Four-port MRR add-drop filter schematic showing a variable bus-ring gap separation design. (c ) The captured green side-emissions via THG in MRRs at different chip temperatures. (d ) Schematic experimental setup of THG in MRR. TLS: tunable laser source; EDFA: erbium-doped fiber amplifier; OBF: optical bandpass filter; PC: polarization controller; TEC: thermoelectric cooler; OSA: optical spectrum analyzer.
Fig. 3. (a ) Measured pump wavelength corresponding to the peak resonances of three types of TM TH modes. The calibrated cold-cavity resonance wavelengths were obtained by subtracted Ω TNL which are shown in plus center symbols. The calibrated TDWS of Type Ⅰ (green lines) and Type Ⅱ (purple lines) TH modes are also shown. (b ) Measured third harmonic photon counts (THPC) on the resonance peaks of the TH modes as a function of I p showing the cubic TH-pump relationship. The solid lines show the cubic TH-pump relationship for comparison. (c – d ) The measured I p (upper) and filter response (lower) of corresponding type Ⅰ TH modes as functions of Ω t in the devices of R-1 (c) and R-2 (d) respectively. The Q-factor of TH modes Q TH can be indirectly determined by using Θ t = 2.55×10⁹ rad/pJ into Eq. (4). The corresponding fitted curves using estimated Q TH are also shown in (c) – (d). Here, the symbols of the measured data in (b) – (d) are the same as those in (a).
Fig. 4. (a – b ) Measured spectra of all the TE athermal TH modes in MRRs of R-1 (a) and R-2 (b) that are thermal matched, i.e. ∆τ ≈ 0. In (a) and (b), the measured wavelengths of the resonance peak of TH modes at different T are shown in open diamonds. The corresponding fitted TDWS of TH modes are shown in grey dashed lines. (c ) The measured photon count on the peak of different athermal TH modes as a function of I p. The solid lines show the cubic TH-pump relationship for (a) – (b) as well as Figs. 5(c) and 5(e) for comparison. The data and fitting curves for R-1, R-2, R-3 are shown in blue, red, and green, respectively.
Fig. 5. (a ) Thermal mismatch ∆τ < 0, with a TM pump generated a TM TH mode with a TDWS of 3d TH = 7.05 pm/℃. (b ) Thermal mismatch ∆τ > 0, with a TE pump generated a TE TH mode with 3d TH = −8.53 pm/℃. (c , f ) When thermal mismatch ∆τ ≈ 0, with a TM pump generated TE TH mode with 3d TH = 0.14 pm/℃ (c) as well as 3d TH = −0.27 pm/℃ (f). (d , g ) The extracted Q-factor of TE TH modes by using the data in (c) at 26 ℃ and in (f) at 46 ℃, with Eq. (4) is used to generate the fitted lines. (e , h ) The temperature dependence of the athermal TH mode resonance fluctuation with fixed ∆τ and F 2 for the TH modes shown in (c) and (f), with the measured values in gray squares. In (a – c) and (f), the measured wavelengths of the resonance peak of TH modes at different T are shown in open diamonds. The corresponding fitted TDWS of TH modes are shown in grey dashed lines.
| |||||||||||||||||||||||||||||||||||||||||||||||||||||||||||||||||||||||||||||
Table 1. The corresponding parameters of Figs. 3(a) and 3(b) . Details of corresponding pump mode parameter measurement are discussed in Supplementary information.
|
Table 2. Comparison of athermal TDWS schemes using different micro resonators.

Set citation alerts for the article
Please enter your email address
© Copyright 2018-2021 | Chinese Laser Press. All Rights Reserved 沪ICP备15018463号-20