
Shaohao Wang, Yuhua Li, Brent E. Little, Leiran Wang, Xiang Wang, Roy R. Davidson, Sai Tak Chu. Athermal third harmonic generation in micro-ring resonators[J]. Opto-Electronic Advances, 2020, 3(12): 200028-1
- Opto-Electronic Advances
- Vol. 3, Issue 12, 200028-1 (2020)
Abstract
Introduction
Nonlinear high-harmonic generation in micro-resonators using a pump at telecom wavelengths is a popular technique used to extend the operating range of applicationfs such as f-2f and 2f-3f self-referencing systems and coherent communications in the visible region
The critical criteria for effective THG of visible emission in wavelength selective MRRs lies is the phase matching between the resonances of the pump mode and the third harmonic (TH) modes. Similar to that of the Kerr frequency comb generation
Therefore, it is necessary to explore other approaches in the realization of temperature insensitive operation that will also address effects such as Kerr nonlinearity induced phase shift in the determination of the phase matching condition.
This work presents the development of a dynamic model to investigate the thermal dependency of the THG phase matching condition, which is affected by the linear and nonlinear TO effects induced phase mismatch. By using this model, we indirectly measure the thermal coefficients as well as Q-factor of the visible mode. We also perform the steady state analysis to investigate the TDWS of the TH modes as well as the existence of athermal THG operation on the thermal mismatch between the pump mode and the TH modes. We are able to verify the model's predictions experimentally in a series of silicon rich HDSG add-drop MRR filters. We further classify the different types of visible TH modes from their THG efficiencies as well as TDWS. By precisely pairing the pump and the TH modes at different thermal mismatches, it is now possible to configure effective TDWS of the TH modes for a given MRR leading to athermal THG at different wavelengths.
Principle and theory
Steady-state thermal dynamics model
In this work, we consider both linear and nonlinear TO effects of THG in MRRs. The discussion requires steady and uniform intra-cavity power distribution for both the pump and the TH waves, in which both optical power and net heat are assumed to be evenly distributed over the ring cavity, so that the averaged local thermal nonlinearity still correlates with the Kerr nonlinearity in the moving reference frame. Experimentally, this uniform intra-cavity power distribution is achieved by injecting continuous wave (CW) laser into the resonance with large normal dispersion. Different from generating Kerr frequency combs
When intra-cavity power of the pump Ip is much larger than It, the intra-cavity power of TH emission, it is reasonable to neglect the self-phase modulation (SPM), cross-phase modulation (XPM), and the pump depletion induced by the TH emission. By using the steady-state assumption for Ip and It, from the coupled thermal dynamics model for THG in MRRs (See Supplementary Discussion Ⅲ), we have
where, |ap|2 = Ip/ħωp and |at|2 = It/3ħωp corresponds to the photon numbers of the pump and TH emission, respectively, and ωp is the angular frequency of input pump. Ωp = ωp-ωp0 and Ωt = 3ωp-ωt0 are the cold-cavity resonance detuning of the pump and TH wave, respectively, where ωp0 and ωt0 are the cold-cavity resonance frequencies of pump and TH modes at temperature T0, respectively. Here, δT = T - T0 is the difference between temperature T and T0. ξp and ξt are the linear TO coefficients of the pump and TH modes, respectively
Tunable TO phase mismatch for THG in MRRs
The overall THG efficiency depends strongly on the phase matching condition between the pump and the TH modes. It is more convenient to express the phase matching condition in terms of the phase mismatch Δβtotal between these modes, which can be approximately expressed as
where, the terms ΩTL = ξtωt0δT, ΩTNL = ΘtIp, and ΩKNL = gtpIp represent the linear TO phase mismatch, the nonlinear TO phase mismatch, and the Kerr nonlinear phase mismatch in THG, respectively. Here, Δng is the difference of group velocity and the c is the speed of light in vacuum. From Eq. (2), we can analytically write the dependence of It of the TH mode as
As shown in Eq. (4), the maximum efficiency occurs at its minimum mismatch. We also notice that, due to the nonlinear phase mismatches, the intensity of THG signal is proportional to the intra-cavity energy instead of the input pump power. Therefore, we should define
| Device | Pump mode | TH mode | TH mode type | ∆τ(pJ/℃) | 3dt (pm/℃) | |||||
| λp0 | ξp | Θp @39 ℃ | τp | ξt | Θt | τt | ||||
| aFitting data within T = 31 ℃ ~ 45 ℃. bFitting data within T = 47 ℃ ~ 55 ℃. cValues cannot be extracted due to the measured wavelength shift is below the OSA resolution limit. | ||||||||||
| R-1 | 1548.88 | 1.23×10⁻⁵ | 1.88×10⁹ | 5.19 | 7.66×10⁻⁶ | 2.55×10⁹ | 6.84 | Type Ⅰ | −1.35 | 4.2a |
| 1550.28 | 1.21×10⁻⁵ | 1.21×10⁹ | 7.58 | N/Ac | N/Ac | N/Ac | Type Ⅲ | N/Ac | 5.2a | |
| R-2 | 1549.16 | 1.29×10⁻⁵ | 1.88×10⁹ | 5.22 | 9.95×10⁻⁶ | 2.55×10⁹ | 8.89 | Type Ⅰ | −3.67 | 6.7b |
| 7.71×10⁻⁶ | 2.00×10⁹ | 8.81 | Type Ⅱ | −3.59 | 7.1a/8.4b | |||||
| 1550.73 | 1.28×10⁻⁵ | 1.80×10⁹ | 5.40 | 7.69×10⁻⁶ | 2.00×10⁹ | 8.77 | Type Ⅱ | −3.37 | 6.3a /7.9b | |
Table 1.
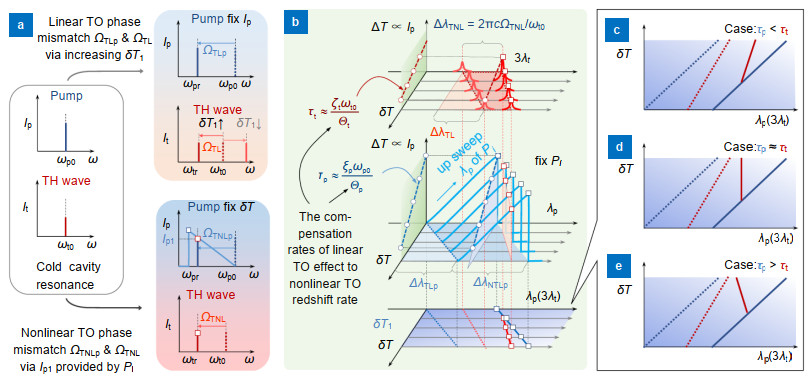
Figure 1(a) illustrates the individual contributions to the cavity resonance tuning due to the linear and nonlinear TO effects. It shows that while the ΩTNL can only produce a redshift, ΩTL can produce a red or blue shift depending on whether the temperature is ramped up or down
![]()
Figure 1.(
Figures 1(c)-1(e) show three scenarios of the effective TDWS of the TH mode in the δT-λp diagrams at different values of τt. As long as the TH mode is thermally matched with the pump mode, i.e. the thermal mismatch Δτ = τp - τt ≈ 0, their resonances can be kept correlated while maintaining the necessary phase matching condition, without the need for any external compensation, as shown in Fig. 1(d). In contrast, the thermal mismatch between the pump and TH modes will cause misalignment between their resonances and affect the THG efficiency. Figures 1(c) and 1(e) show when it is under- and over-compensated, respectively.
The existence of stable athermal THG in MRRs
In MRRs, the dependence of Ip to the input pump power Pi and the pump detuning Ωp is a nonlinear relationship instead of the linear one
where, α = 2Ωp/κp is the normalized pump detuning which is proportional to Ωp, ρ = -2ΘpΔτδT/κp is the normalized intra-cavity pump power, and F2 = 8ΘpκpeΔτPi/(κp3τt) is the normalized intra-cavity pump power.
In Eq. (5), only when
![]()
Figure 2.(
MRR fabrication and experimental setup
A series of HDSG four-port single ring MRR add-drop filters are fabricated for the investigation in which a ring resonator with radius of R = 135 μm is side coupled to an input and output bus waveguide as shown in Fig. 2(b). The cross-section of both the rings and the bus waveguides are 2 μm × 1 μm, which consist of highly doped glass of refractive index 1.70 and cladded with silica. The Q-factors of the MRRs are varied by using a gap separation of 0.8 μm (R-1, R-3) and 1.0 μm (R-2), respectively. The corresponding transmission spectrum and the Q factors of the devices are shown in Figs. 1(a) and (b) as well as table 2 in ref.
| Ref. | Temp. range (℃) | Effects to compensate | Compensation method | TDWS (pm/℃) | Gain | Polarization | Material |
| Ref. | 9~25 | Linear TO | Polymer cladding | 0.2 | No | TE | SOI |
| Ref. | 25-90 | Linear TO | sol-gel cladding | 0.9 | No | TM | SOI |
| Ref. | 22-28 | Linear TO | a-TiO2 cladding | -1.6 | No | - | Si |
| Ref. | - | Nonlinear TO | w etched Si slab | N/A | No | TE | Si |
| This work | 26-38 | Linear TO & nonlinear TO | Thermal matching | 0.05 | Yes | TE(TH) | HDSG |
Table 2. Comparison of athermal TDWS schemes using different micro resonators.
The schematic of the experimental setup for monitoring the THG emission is shown in Fig. 2(d). A CW pump from the TLS, (Agilent 8164A) is amplified by an EDFA (Amonics, AEDFA-CL-30-R-FA). An OBF is used to reject the amplified spontaneous emission (ASE) of the amplified pump before it is launched into the input port of the MRR add-drop filter in the experiment. Since the THG emission cannot couple to the bus waveguide, it is necessary to collect the emission from the top of the ring by a collimator (Thorlabs F671SMA), then the collected signal is transmitted to the spectrometer (Ocean Optics, 0.38 nm resolution) via an optical fiber for the spectral analysis. A large area silicon detector (Thorlabs DET100A) is used to calibrate the emission collection system, where the detector is placed directly on the emitting ring with the collected power as the reference. Next, the power is compared to the photon counts from the spectrometer for the calibration. A TEC is used to control the on-chip temperature T of MRR device in the various stages of the experiment.
Results
Determination of linear and nonlinear TO coefficient ratios τt
By using the experimental setup shown in Fig. 2(d), the response of the TH mode emission at various temperatures T are obtained by scanning the pump signal across the free spectral range (FSR) of the MRR while maintaining the device temperature constant with the TEC
![]()
Figure 3.(
Besides the THG efficiencies, each type has its own unique values of ξt and Θt that can be extracted from the effective TDWS measurement at two or more resonance locations of the modes. The calculated ξt and ξt of the type Ⅰ and type Ⅱ TH modes in table 1 show that the linear TO coefficient ξt of these TH modes have similar values as the pump mode ξp where all four TM-TM THG cases having negative thermal matchings, with Δτ < 0. This is caused by their linear TO phase mismatches over-equalizing the nonlinear TO phase mismatches. For these TH modes, their TDWS rates dt are proportional to the thermal mismatch -Δτ.
Demonstration of configurable TDWS and athermal THG in MRRs
For HDSG MRRs, the measured nonlinear TO shift rate Θp of the TM pump mode decreases more rapidly than the TE mode across the C- and L-bands, (see Supplementary Fig. S2(b). The result indicates different polarization combinations of the pump mode and the generated TH mode give rise to Δτ with different signs, which can lead to a positive, negative, or even zero TDWS. In MRRs R-1 and R-2, with 200-300 mW TM pumps, TE athermal TH modes with TDWS of |3dt| ≤ 0.62 pm/℃ can be achieved as shown in Figs. 4(a) and 4(b). Figure 4(c) compares the measured photon count on the peak of TH modes as a function of Ip. As shown in Fig. 4(c), in device R-2 the generated TE athermal TH mode has a THG efficiency of
![]()
Figure 4.(
To verify the results, a second device R-3 is measured, having the same design as R-1. As shown in Fig. 4(c), the two measured TE athermal TH modes in R-3 have similar THG efficiencies as R-1, which indicates that they belong to one TH mode family. The measured spectra of these two athermal TH modes in MRR R-3 generated by TM-TE combination were shown in Fig. 5(c) and Fig. 5(f). In the same device, Fig. 5(a) shows that, with the TM pump mode, the generated TM TH visible mode yields dt = 2.35 pm/℃ which is close to that of R-2 shown in Table 1. In this case, a negative Δτ leads to a positive TDWS. For the TE-TE combination in Fig. 5(b), it gives rise to a negative TDWS of dt = -2.84 pm/℃ due to the under-compensation of the linear TO effect. The results indicate that the TE-TE and TM-TM combination having opposite TDWS trends. Athermal operation with perfect thermal matching Δτ ≈ 0 can be achieved with the TM-TE combination in R-1 (Fig. 4(a)), R-2 (Fig. 4(b)), and R-3 (Figs. 5(c) and 5(f)). Figure 5(c) show an TDWS at the TH wavelength of only |dt| ≤ 0.09 pm/℃ can be achieved in R-3, which is a clear demostration of the use of linear TO phase mismatch to equalize the nonlinear TO phase mismatch when thermal matching occurs. This also shows that by selecting different combinations of the pump and TH modes, one can control the direction of the TDWS via configuring the thermal mismatch Δτ in these HDSG MRRs.
![]()
Figure 5.(
For athermal TH modes, since the measured pump wavelength slope is less than the resolution of the OSA of 1 pm, it is not possible to calculate ξt and Θt accurately as in Fig. 3(a). From Eq. (2), the nearly phase matching assumption of the athermal modes can be used to determine the pump detuning Θp and T0. Figures 5(c) and 5(f) indicates the two TE TH modes belong to the same type of TH mode in MRR R-3 and have similar ξt in the L-band. By assuming that the ratio of ξt to Θt in R-3 is the same as that in R-1 as shown in table 1, we get a trial value of ξt = 9.0×10⁻⁶ /℃. From the data of Figs. 5(c) and 5(f), we can obtain Δτ = 0.36 pJ/℃ and Θt = 2.3 ×10⁹ rad/pJ for Fig. 5(c) and Δτ = 0.29 pJ/℃ and Θt = 1.9 ×10
One can also estimate QTH of the TE TH mode by using the extracted Θt and ξt along with the assumption of Δτ ≈ 0. Figs. 5(d) and 5(g) show the measured spectrum and fitted curve using Eq. (4) and the estimated values of Δτ and Θt. As shown in Figs. 5(d) and 5(g), both of the athermal TH modes have a QTH of 3.5 ×10⁵, which is close to the intrinsic Q of the TH mode and smaller than Qp = 4.32 ×10⁵ of the pump mode.
Discussion
For the HDSG MRR, the measured Θp is approximately two orders of magnitude higher than the shift rate from the Kerr effect. Such difference is about 10 times greater than that in the Si3N4 MRR
The model in Eq. (5) also provides insights to maximize the Θp value for broadening the temperature range of stable atheraml THG. Since the real roots of α in Eq. (5) only exist when |F2| ≥ |ρ| and the smaller roots cannot lead to an athermal mode, from
Equation (6) determines the dependence of athermal TH resonance frequency on temperature fluctuation δT, in which the first and second terms on the right-hand side of Eq. (6) represents the linear TO effect and the nonlinear TO effect, respectively. The increase of |δT| can simultaneously enhance the first term and reduce the second, and vice versa, which gives a similar form as the bandgap reference in electrical circuit design
Equation (6) also shows the operating temperature range of athermal THG can be determined by setting the calculated ∂Ωp/∂(δT) to zero, which gives an approximately inversed cubic relationship between δT and τt. Since the values of ξt are on the same order of ξp, a close to zero τt can easily be obtained with a large Θp value, which is in the same order as Θt for broadening the operating temperature range. Contrarily, although the athermal THG still exists at small Θp values, it shrinks the operating temperature range to less than one degree and severely limits its effectiveness.
Using the parameters extracted from the measured athermal TH modes, the calculated α as functions of ρ at a fixed Δτ are plotted in Figs. 5(e) and 5(h) using Eq. (5). The gray squares in Figs. 5(e) and 5(h) are from the measured result of Figs. 5(c) and 5(f), respectively. It shows a non-zero and positive Δτ (0.3 pJ/℃) can achieve perfect power insensitive athermal THG with less than hundreds of MHz variation within 12 ℃ and 6 ℃ ranges, respectively. This range is comparable to the reported passive athermal TDWS approaches for MRRs
Conclusions
In conclusion, we present a comprehensive study of the thermal behavior of the visible modes in micro-resonators generated by the THG process pumped with telecom wavelengths. A dynamic model that includes both the linear and nonlinear TO effects is used to explain the pump and third harmonic resonance shifts for a given input pump power in the MRRs. Using this model, we predict and experimentally demonstrate visible third harmonics modes having TDWS between -2.84 pm/℃ and 2.35 pm/℃ when pumped at the L-band. By precisely matching the pump and the TH modes at different thermal mismatches, it is now possible to configure effective TDWS for a given MRR leading to athermal THG at different wavelengths. We have also identified orthogonally pumped athermal visible TH modes with a TDWS of 0.05 pm/℃ over a temperature range of 12 ℃. In table 2, we compared the proposed deterministic athermal THG scheme with other athermal approaches which use a negative TO coefficient overlay to compensate linear TO effect or equalize the nonlinear TO effect by optimizing the structure of MRRs. Unlike the previous works, our proposed scheme uses only one CW laser pump with fixed wavelength and power to directly generate athermal TH modes in a silicon rich CMOS-compatible MRRs without any external compensation scheme. This configurable THG approach can generate athermal visible emission mode with high Q-factor, approximately-zero TDWS, tens of degree temperature range, and no operation bandwidth limitation. This finding further promises the realization of temperature insensitive highly efficient THG for potential 2f-3f self-referencing in metrology, biological and chemical sensing applications.
Acknowledgements
We are grateful for financial supports from the Natural Science Foundation of Fujian Province (Grant No. 2017J01756); National Natural Science Foundation of China (Grant No. R-IND12101, No. 61675231); Strategic Priority Research Program of Chinese Academy of Sciences (Grant No. XDB24030300).
Author contributions
S. H. W. developed the original concept. B. E. L., R. R. D. and X. W. designed and fabricated the integrated devices. Y. L. performed the experiments. Y. L. and S.T.C. contributed to the development of the experiment. S. H. W., S. T. C., and B. E. L. contributed to the writing of the manuscript. L. W. and S. T. C. supervised the research.
Competing interests
The authors declare no competing financial interests
Supplementary information
Supplementary information for this paper is available at https://doi.org/10.29026/oea.2020.200028.
References
[1] T Carmon, K J Vahala. Visible continuous emission from a silica microphotonic device by third-harmonic generation. Nat Phys, 3, 430-435(2007).
[2] B Corcoran, C Monat, C Grillet, D J Moss, B J Eggleton et al. Green light emission in silicon through slow-light enhanced third-harmonic generation in photonic-crystal waveguides. Nat Photonics, 3, 206-210(2009).
[3] K Sasagawa, M Tsuchiya. Highly efficient third harmonic generation in a periodically poled MgO: LiNbO3 disk resonator. Appl Phys Express, 2, 122401(2009).
[4] D Farnesi, A Barucci, G C Righini, S Berneschi, S Soria et al. Optical frequency conversion in silica-whispering-gallery-mode microspherical resonators. Phys Rev Lett, 112, 093901(2014).
[5] M Asano, S Komori, R Ikuta, N Imoto, Ş K Özdemir et al. Visible light emission from a silica microbottle resonator by second- and third-harmonic generation. Opt Lett, 41, 5793-5796(2016).
[6] H L Liu, Z B Zhang, Z C Shang, T Gao, X J Wu. Dynamically manipulating third-harmonic generation of phase change material with gap-Plasmon resonators. Opt Lett, 44, 5053-5056(2019).
[7] J S Levy, M A Foster, A L Gaeta, M Lipson. Harmonic generation in silicon nitride ring resonators. Opt Express, 19, 11415-11421(2011).
[8] L R Wang, L Chang, N Volet, M H P Pfeiffer, M Zervas et al. Frequency comb generation in the green using silicon nitride microresonators. Laser Photonics Rev, 10, 631-638(2016).
[9] X Y Lu, G Moille, Q Li, D A Westly, A Singh et al. Efficient telecom-to-visible spectral translation through ultralow power nonlinear nanophotonics. Nat Photonics, 13, 593-601(2019).
[10] J B Surya, X Guo, C L Zou, H X Tang. Efficient third-harmonic generation in composite aluminum nitride/silicon nitride microrings. Optica, 5, 103-108(2018).
[11] X Guo, C L Zou, L Jiang, H X Tang. All-optical control of linear and nonlinear energy transfer via the Zeno effect. Phys Rev Lett, 120, 203902(2018).
[12] J T Lin, N Yao, Z Z Hao, J H Zhang, W B Mao et al. Broadband quasi-phase-matched harmonic generation in an on-chip monocrystalline lithium niobate microdisk resonator. Phys Rev Lett, 122, 173903(2019).
[13] Y H Li, S H Wang, Y Y Tian, W L Ho, Y Y Li et al. Third-harmonic generation in CMOS-compatible highly doped silica micro-ring resonator. Opt Express, 28, 641-651(2020).
[14] A Rodriguez, M Soljačić, J D Joannopoulos, G JohnsonS.
[15] X Y Zhang, Q T Cao, Z Wang, Y X Liu, C W Qiu et al. Symmetry-breaking-induced nonlinear optics at a microcavity surface. Nat Photonics, 13, 21-24(2019).
[16] B D Liu, H K Yu, Z Y Li, L M Tong. Phase-matched second-harmonic generation in coupled nonlinear optical waveguides. J Opt Soc Am B, 36, 2650-2658(2019).
[17] H Guo, M Karpov, E Lucas, A Kordts, M H P Pfeiffer et al. Universal dynamics and deterministic switching of dissipative Kerr solitons in optical microresonators. Nat Phys, 13, 94-102(2017).
[18] C Y Bao, Y Xuan, J A Jaramillo-Villegas, D E Leaird, M H Qi et al. Direct soliton generation in microresonators. Opt Lett, 42, 2519-2522(2017).
[19] X X Xue, Y Xuan, C Wang, P H Wang, Y Liu et al. Thermal tuning of Kerr frequency combs in silicon nitride microring resonators. Opt Express, 24, 687-698(2016).
[20] C Joshi, J K Jang, K Luke, X C Ji, S A Miller et al. Thermally controlled comb generation and soliton modelocking in microresonators. Opt Lett, 41, 2565-2568(2016).
[21] B S Lee, M Zhang, F A S Barbosa, S A Miller, A Mohanty et al. On-chip thermo-optic tuning of suspended microresonators. Opt Express, 25, 12109-12120(2017).
[22] W Q Wang, Z Z Lu, W F Zhang, S T Chu, B E Little et al. Robust soliton crystals in a thermally controlled microresonator. Opt Lett, 43, 2002-2005(2018).
[23] C Wang, M Zhang, R R Zhu, H Hu, M Loncar. Monolithic photonic circuits for Kerr frequency comb generation, filtering and modulation. Nat Commun, 10, 978(2019).
[24] Y He, Q F Yang, J W Ling, R Luo, H X Liang et al. A self-starting bi-chromatic LiNbO3 soliton microcomb. Optica, 6, 1138-1144(2019).
[25] J D Jost, E Lucas, T Herr, C Lecaplain, V Brasch et al. All-optical stabilization of a soliton frequency comb in a crystalline microresonator. Opt Lett, 40, 4723-4726(2015).
[26] H Zhou, Y Geng, W W Cui, S W Huang, Q Zhou et al. Soliton bursts and deterministic dissipative Kerr soliton generation in auxiliary-assisted microcavities. Light: Sci Appl, 8, 50(2019).
[27] K Padmaraju, K Bergman. Resolving the thermal challenges for silicon microring resonator devices. Nanophotonics, 3, 269-281(2014).
[28] T Carmon, L Yang, K J Vahala. Dynamical thermal behavior and thermal self-stability of microcavities. Opt Express, 12, 4742-4750(2004).
[29] K Ikeda, R E Saperstein, N Alic, Y Fainman. Thermal and Kerr nonlinear properties of plasma-deposited silicon nitride/silicon dioxide waveguides. Opt Express, 16, 12987-12994(2008).
[30] Lee J M. Athermal silicon photonics//Pavesi L, Lockwood D J. Silicon Photonics Ⅲ: Systems and Applications. Berlin Heidelberg: Springer-Verlag, 2016.
[31] Y Kokubun, N Funato, M Takizawa. Athermal waveguides for temperature-independent lightwave devices. IEEE Photonics Technol Lett, 5, 1297-1300(1993).
[32] S T Chu, W G Pan, S Suzuki, B E Little, S Sato et al. Temperature insensitive vertically coupled microring resonator add/drop filters by means of a polymer overlay. IEEE Photonics Technol Lett, 11, 1138-1140(1999).
[33] J Teng, P Dumon, W Bogaerts, H B Zhang, X G Jian et al. Athermal silicon-on-insulator ring resonators by overlaying a polymer cladding on narrowed waveguides. Opt Express, 17, 14627-14633(2009).
[34] M M Milošević, N G Emerson, F Y Gardes, X Chen, A A D T Adikaari et al. Athermal waveguides for optical communication wavelengths. Opt Lett, 36, 4659-4661(2011).
[35] V Raghunathan, T Izuhara, J Michel, L Kimerling. Stability of polymer-dielectric bi-layers for Athermal silicon photonics. Opt Express, 20, 16059-16066(2012).
[36] S Namnabat, K J Kim, A Jones, R Himmelhuber, C T DeRose et al. Athermal silicon optical add-drop multiplexers based on thermo-optic coefficient tuning of sol-gel material. Opt Express, 25, 21471-21482(2017).
[37] B Guha, J Cardenas, M Lipson. Athermal silicon microring resonators with titanium oxide cladding. Opt Express, 21, 26557-26563(2013).
[38] S S Djordjevic, K P Shang, B B Guan, S T S Cheung, L Liao et al. CMOS-compatible, Athermal silicon ring modulators clad with titanium dioxide. Opt Express, 21, 13958-13968(2013).
[39] J Ptasinski, I C Khoo, Y Fainman. Passive temperature stabilization of silicon photonic devices using liquid crystals. Materials, 7, 2229-2241(2014).
[40] B Guha, B B C Kyotoku, M Lipson. CMOS-compatible athermal silicon microring resonators. Opt Express, 18, 3487-3493(2010).
[41] L W Luo, G S Wiederhecker, K Preston, M Lipson. Power insensitive silicon microring resonators. Opt Lett, 37, 590-592(2012).
[42] I Grudinin, H Lee, T Chen, K Vahala. Compensation of thermal nonlinearity effect in optical resonators. Opt Express, 19, 7365-7372(2011).
[43] L Jin, L Di Lauro, A Pasquazi, M Peccianti, D J Moss et al. Optical multi-stability in a nonlinear high-order microring resonator filter. APL Photonics, 5, 056106(2020).
[44] Y K Chembo, C R Menyuk. Spatiotemporal Lugiato-Lefever formalism for Kerr-comb generation in whispering-gallery-mode resonators. Phys Rev A, 87, 053852(2013).
[45] C Godey, I V Balakireva, A Coillet, Y K Chembo. Stability analysis of the spatiotemporal Lugiato-Lefever model for Kerr optical frequency combs in the anomalous and normal dispersion regimes. Phys Rev A, 89, 063814(2014).
[46] OFC 2003 Optical Fiber Communications Conference, 444-445 (IEEE, 2003); http://doi.org/10.1109/OFC.2003.315925.
[47] M Ferrera, L Razzari, D Duchesne, R Morandotti, Z Yang et al. Low-power continuous-wave nonlinear optics in doped silica glass integrated waveguide structures. Nat Photonics, 2, 737-740(2008).
[48] D J Moss, R Morandotti, A L Gaeta, M Lipson. New CMOS-compatible platforms based on silicon nitride and Hydex for nonlinear optics. Nat Photonics, 7, 597-607(2013).
[49] R J Widlar. New developments in IC voltage regulators. IEEE J Solid-State Circuits, 6, 2-7(1971).


Set citation alerts for the article
Please enter your email address

© Copyright 2018-2021 | Chinese Laser Press. All Rights Reserved 沪ICP备15018463号-20