• Acta Optica Sinica
  • Vol. 38, Issue 2, 0212002 (2018)
Qiyuan Zhang1、3, Sen Han2、3、*, Shouhong Tang2、3, Chunhua Luo1, and Yuegang Fu1
Author Affiliations
  • 1 School of Optoelectronic Engineering, Changchun University of Science and Technology, Changchun, Jilin 130022, China
  • 2 College of Optical-Electrical and Computer Engineering, University of Shanghai for Science and Technology, Shanghai 200093, China
  • 3 Suzhou H & L Instruments LLC, Suzhou, Jiangsu 215123, China;
  • show less
    DOI: 10.3788/AOS201838.0212002 Cite this Article Set citation alerts
    Qiyuan Zhang, Sen Han, Shouhong Tang, Chunhua Luo, Yuegang Fu. Study on Functional Relationship between Transmitted Wavefront Zernike Coefficients and Wavelengths[J]. Acta Optica Sinica, 2018, 38(2): 0212002 Copy Citation Text show less
    Diagram of different wavelength wavefronts of optical system
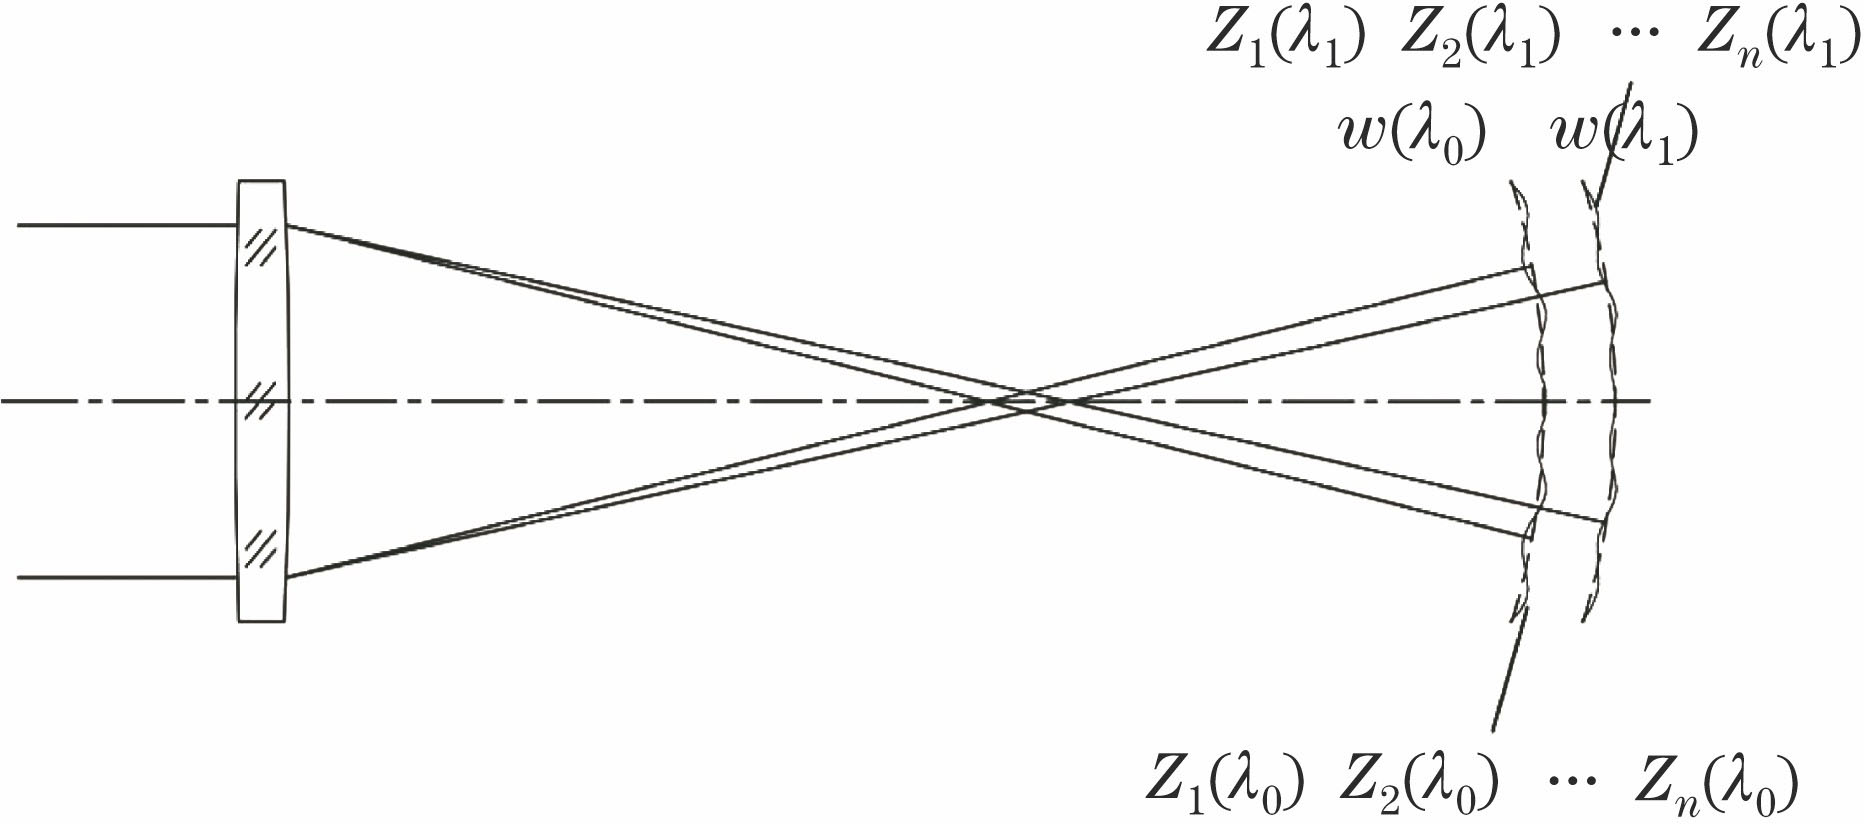
    Fig. 1. Diagram of different wavelength wavefronts of optical system
    Optical system testing at infinite distance
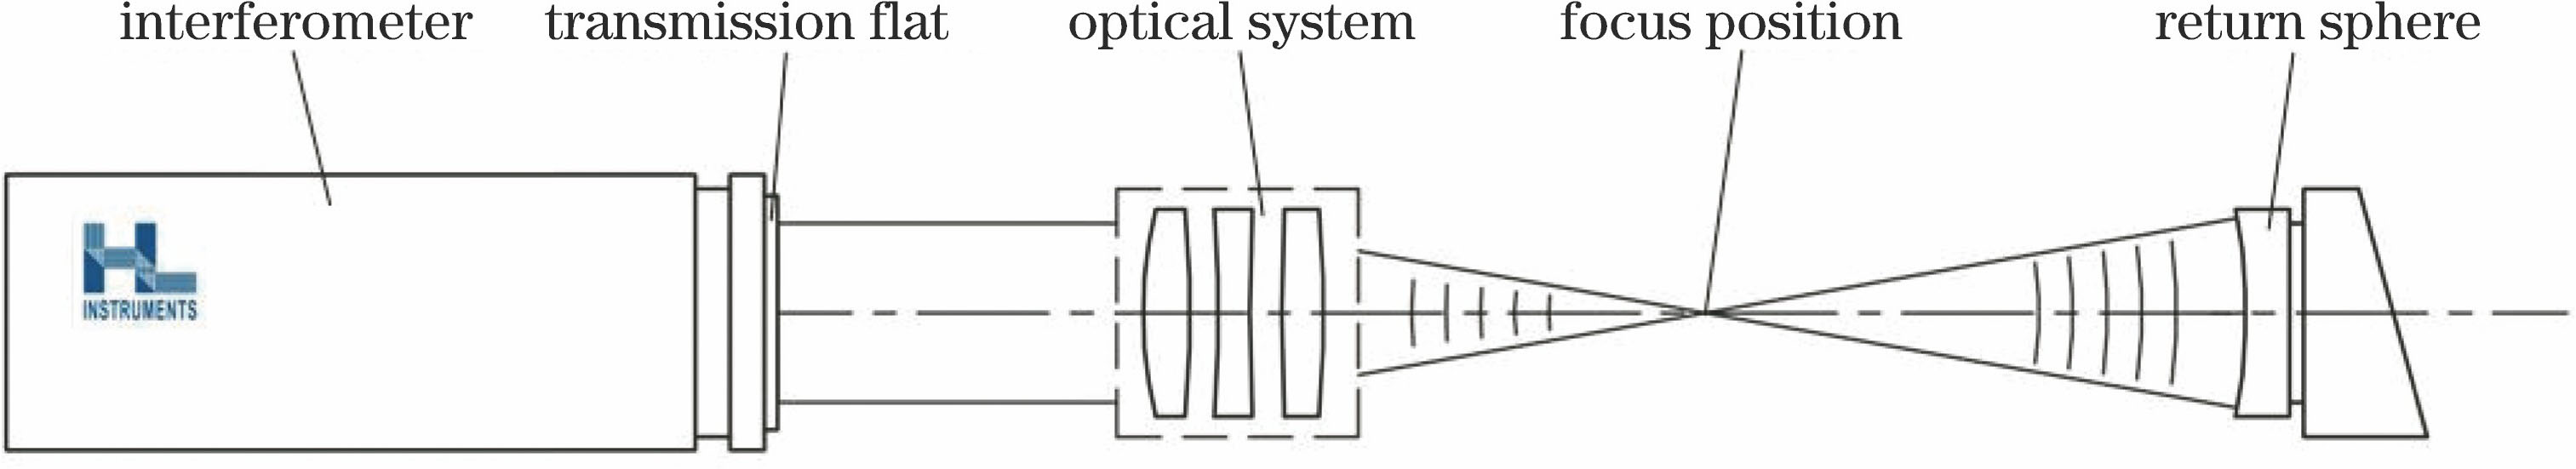
    Fig. 2. Optical system testing at infinite distance
    Optical system layout
    Fig. 3. Optical system layout
    Curves of 9 fringe Zernike coefficients of full field of optical system as a function of wavelength. (a) Z1; (b) Z2; (c) Z3; (d) Z4; (e) Z5; (f) Z6; (g) Z7; (h) Z8; (i) Z9
    Fig. 4. Curves of 9 fringe Zernike coefficients of full field of optical system as a function of wavelength. (a) Z1; (b) Z2; (c) Z3; (d) Z4; (e) Z5; (f) Z6; (g) Z7; (h) Z8; (i) Z9
    Curve fitting results of Z1 coefficient of full field of ideal system. (a) Polynomial curve; (b) exponential curve; (c) Fourier curve; (d) Gaussian curve; (e) power curve; (f) rational function curve
    Fig. 5. Curve fitting results of Z1 coefficient of full field of ideal system. (a) Polynomial curve; (b) exponential curve; (c) Fourier curve; (d) Gaussian curve; (e) power curve; (f) rational function curve
    Comparison between solved quadratic polynomial curve and acquired data curve
    Fig. 6. Comparison between solved quadratic polynomial curve and acquired data curve
    Comparison between solved Conrady formula curve and acquired data curve
    Fig. 7. Comparison between solved Conrady formula curve and acquired data curve
    Error curve of Conrady formula
    Fig. 8. Error curve of Conrady formula
    Zernike coefficient0° field of view0.7° field of view1° field of view
    Z1-0.25-0.21-0.2
    Z20.0140.010.012
    Z3-0.007-0.09-0.09
    Z4-0.3-0.23-0.2
    Z54-0.070.07
    Z6-0.20.0350.035
    Z7-0.020.012-0.012
    Z80.012-0.09-0.09
    Z9-0.2-0.2-0.2
    Table 1. Errors of 9 Fringe Zernike coefficients%
    Qiyuan Zhang, Sen Han, Shouhong Tang, Chunhua Luo, Yuegang Fu. Study on Functional Relationship between Transmitted Wavefront Zernike Coefficients and Wavelengths[J]. Acta Optica Sinica, 2018, 38(2): 0212002
    Download Citation