• Photonics Research
  • Vol. 9, Issue 2, 202 (2021)
Huanhao Li1、2、†, Chi Man Woo1、2、†, Tianting Zhong1、2, Zhipeng Yu1、2, Yunqi Luo3, Yuanjin Zheng3, Xin Yang4, Hui Hui4、5、*, and Puxiang Lai1、2、6、*
Author Affiliations
  • 1Department of Biomedical Engineering, The Hong Kong Polytechnic University, Hong Kong SAR, China
  • 2The Hong Kong Polytechnic University Shenzhen Research Institute, Shenzhen, China
  • 3School of Electrical and Electronics Engineering, Nanyang Technological University, Singapore, Singapore
  • 4CAS Key Laboratory of Molecular Imaging, Institute of Automation, Chinese Academy of Sciences, Beijing, China
  • 5e-mail: hui.hui@ia.ac.cn
  • 6e-mail: puxiang.lai@polyu.edu.hk
  • show less
    DOI: 10.1364/PRJ.412884 Cite this Article Set citation alerts
    Huanhao Li, Chi Man Woo, Tianting Zhong, Zhipeng Yu, Yunqi Luo, Yuanjin Zheng, Xin Yang, Hui Hui, Puxiang Lai. Adaptive optical focusing through perturbed scattering media with a dynamic mutation algorithm[J]. Photonics Research, 2021, 9(2): 202 Copy Citation Text show less
    Block diagram showing the workflow of the dynamic mutation algorithm (DMA).
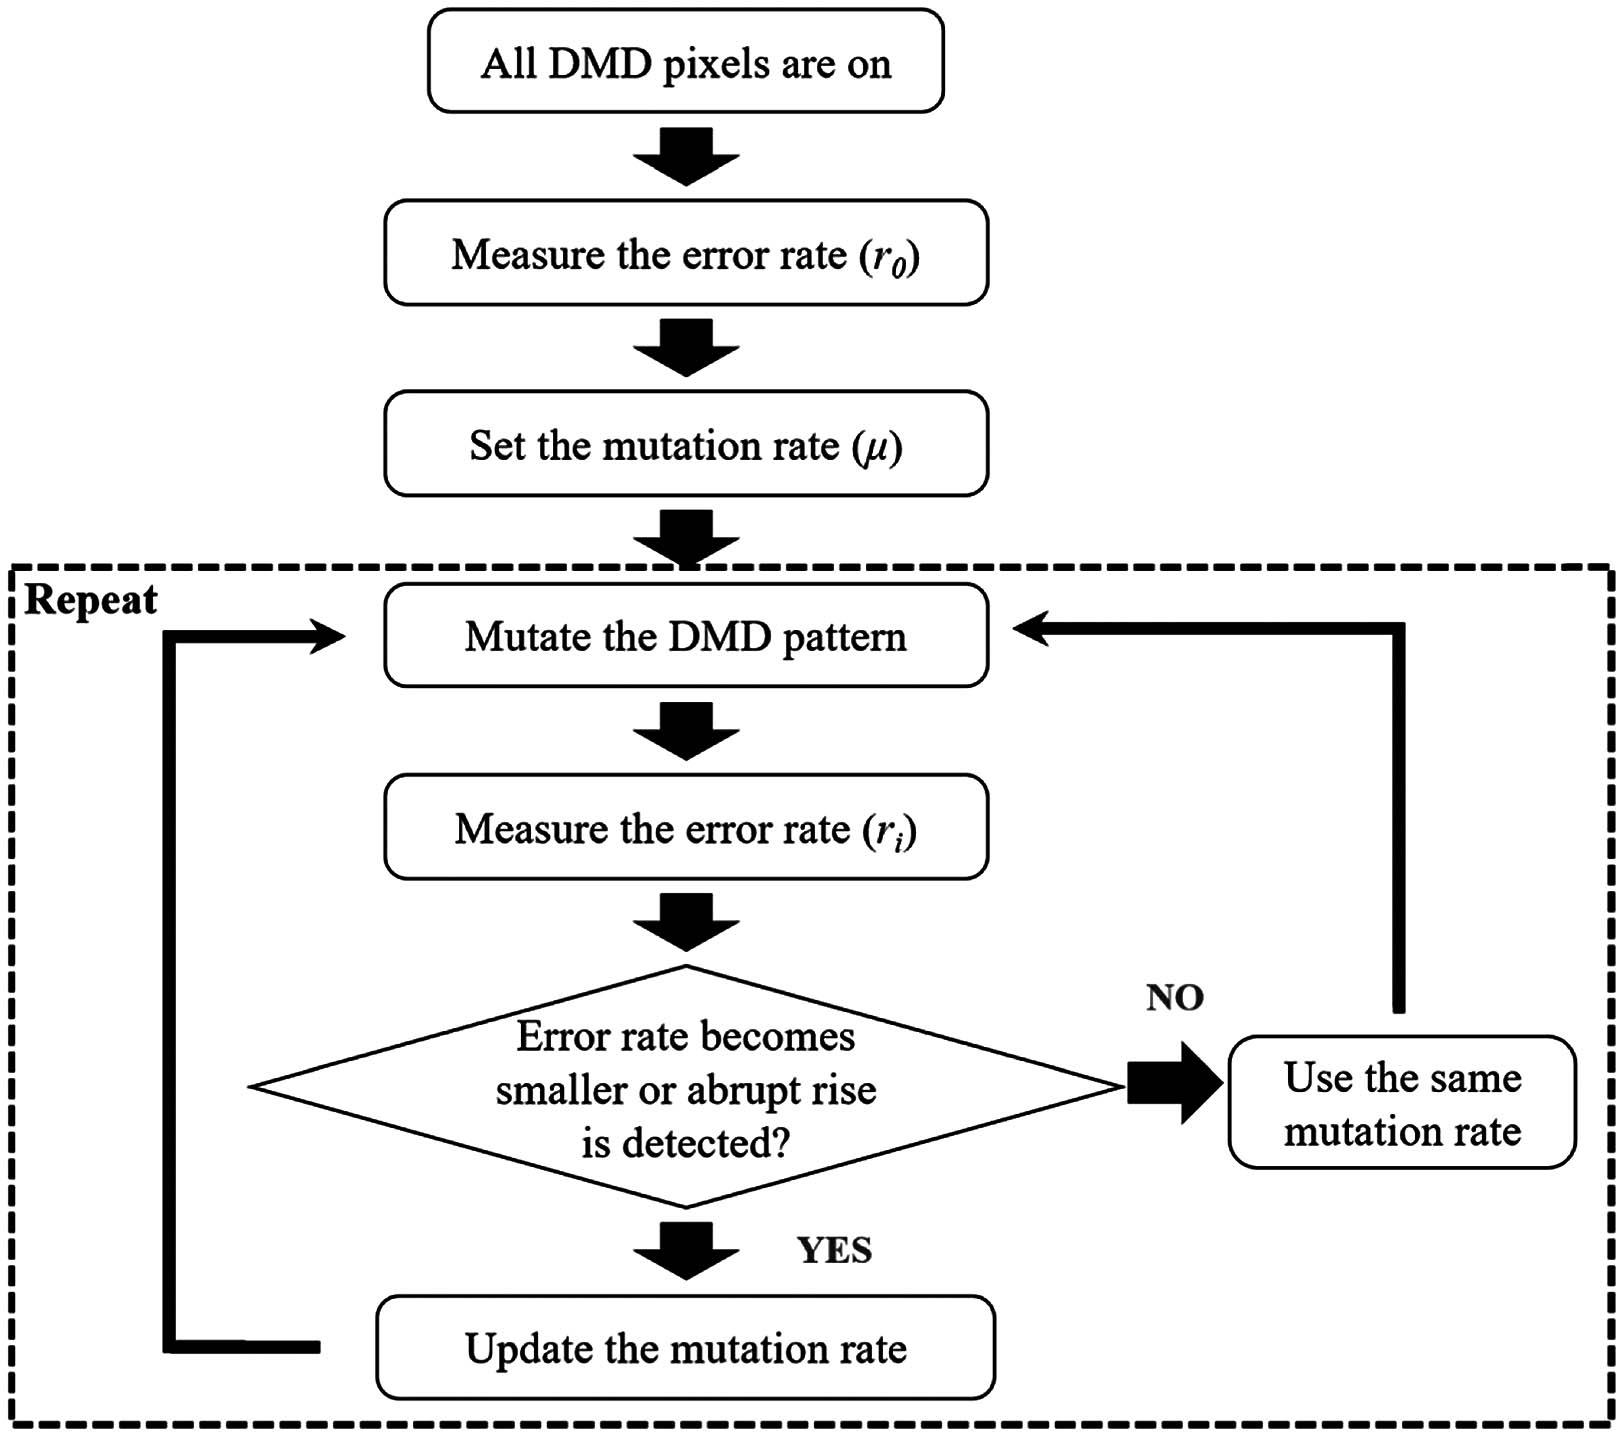
    Fig. 1. Block diagram showing the workflow of the dynamic mutation algorithm (DMA).
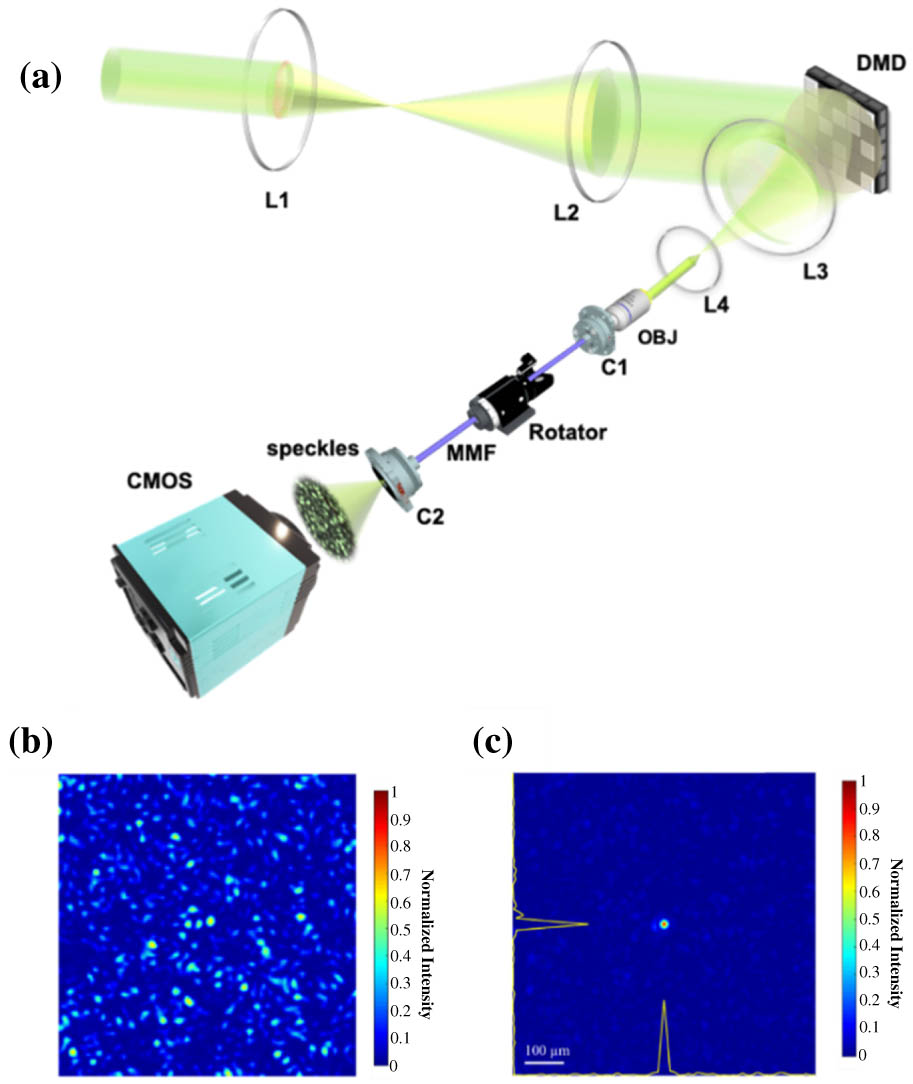
    (a) Experimental setup. L1, f=60 mm; L2 and L3, f=250 mm; L4, f=50 mm; DMD, 1920×1080 digital micromirror device; OBJ, 40× objective lens (NA = 0.65); MMF, 1 m multimode bare optical fiber (diameter = 200 μm, NA = 0.22). A fiber rotator was added in the fiber rotation experiment. C1 and C2 are the fiber collimators. (b) Speckle field before optimization. (c) Focus formed after optimization by the DMA (PBR = 120). The yellow lines indicate the profiles of the focus along the horizontal and vertical directions.
    Fig. 2. (a) Experimental setup. L1, f=60  mm; L2 and L3, f=250  mm; L4, f=50  mm; DMD, 1920×1080 digital micromirror device; OBJ, 40× objective lens (NA = 0.65); MMF, 1 m multimode bare optical fiber (diameter = 200 μm, NA = 0.22). A fiber rotator was added in the fiber rotation experiment. C1 and C2 are the fiber collimators. (b) Speckle field before optimization. (c) Focus formed after optimization by the DMA (PBR = 120). The yellow lines indicate the profiles of the focus along the horizontal and vertical directions.
    Relative PBR error rate curves (η′−r curve). The curve based on the theoretical prediction following the derived square rule is plotted in dashed lines in both (a) and (b). In (a), the blue-diamond line shows the optimization based on the TM measured at r=0, and the instable effect is included without remeasuring the TM for other error rates; the red-diamond line is based on the simulation with a TM, whose real part distribution is subjected to a shift (the mean of the Gaussian distribution is shifted from 0 to 0.002 in the inset). In (b), the optimal mask for each investigated error rate is reobtained to eliminate the instable effect in experiments (blue-diamond line) and simulations (red-diamond line), matching well with the theoretical η′=(1–2r)2 curve. Relative PBR for each error rate was repeated for five executions, and the error bars show the standard deviation of the measurements.
    Fig. 3. Relative PBR error rate curves (ηr curve). The curve based on the theoretical prediction following the derived square rule is plotted in dashed lines in both (a) and (b). In (a), the blue-diamond line shows the optimization based on the TM measured at r=0, and the instable effect is included without remeasuring the TM for other error rates; the red-diamond line is based on the simulation with a TM, whose real part distribution is subjected to a shift (the mean of the Gaussian distribution is shifted from 0 to 0.002 in the inset). In (b), the optimal mask for each investigated error rate is reobtained to eliminate the instable effect in experiments (blue-diamond line) and simulations (red-diamond line), matching well with the theoretical η=(12r)2 curve. Relative PBR for each error rate was repeated for five executions, and the error bars show the standard deviation of the measurements.
    Simulation results of the DMA, GA, and CSA under different conditions: (a) noise-free; (b) low-noise: 0.3⟨I0⟩; (c) high-noise: 0.6⟨I0⟩; (c)–(f) 25% right shift of the transmission matrix (at the 5000th measurement) applied to noise-free, low-noise, and high-noise conditions.
    Fig. 4. Simulation results of the DMA, GA, and CSA under different conditions: (a) noise-free; (b) low-noise: 0.3I0; (c) high-noise: 0.6I0; (c)–(f) 25% right shift of the transmission matrix (at the 5000th measurement) applied to noise-free, low-noise, and high-noise conditions.
    Experimental results of the DMA (red solid curve), GA (black dashed curve), and CSA (green dotted curve) focusing performance against strong noise.
    Fig. 5. Experimental results of the DMA (red solid curve), GA (black dashed curve), and CSA (green dotted curve) focusing performance against strong noise.
    (a) Relationship between fiber rotation and PBR drop. (b) Measurement required to rebound for different degrees of fiber rotation. Each dot in (a) and (b) is averaged from five executions, and the error bars show the standard deviation of the measurements. The optimizations in (a) and (b) are realized by the DMA. (c) Experimental focusing performance of the DMA in response to 2.5°, 5°, and 7.5° fiber rotation.
    Fig. 6. (a) Relationship between fiber rotation and PBR drop. (b) Measurement required to rebound for different degrees of fiber rotation. Each dot in (a) and (b) is averaged from five executions, and the error bars show the standard deviation of the measurements. The optimizations in (a) and (b) are realized by the DMA. (c) Experimental focusing performance of the DMA in response to 2.5°, 5°, and 7.5° fiber rotation.
    Focusing performance of the DMA, GA, and CSA in response to 5° fiber rotation.
    Fig. 7. Focusing performance of the DMA, GA, and CSA in response to 5° fiber rotation.
    Focal spots at four different stages with different algorithms: before optimization (zeroth measurement), before fiber rotation (5000th measurement), right after 5° fiber rotation (5001st measurement), and after reoptimization (15,000th measurement). The 150 μm scale bar is applicable to all images in this figure.
    Fig. 8. Focal spots at four different stages with different algorithms: before optimization (zeroth measurement), before fiber rotation (5000th measurement), right after 5° fiber rotation (5001st measurement), and after reoptimization (15,000th measurement). The 150 μm scale bar is applicable to all images in this figure.
    AlgorithmInitial Parameter
    DMAMutation constant = 200
    GA1. Population size = 202. Offspring size = 103. Initial mutation rate = 0.14. Final mutation rate = 0.0015. Decay constant = 200
    CSANone
    Table 1. Initial Parameters Set for the DMA, GA, and CSA
    Huanhao Li, Chi Man Woo, Tianting Zhong, Zhipeng Yu, Yunqi Luo, Yuanjin Zheng, Xin Yang, Hui Hui, Puxiang Lai. Adaptive optical focusing through perturbed scattering media with a dynamic mutation algorithm[J]. Photonics Research, 2021, 9(2): 202
    Download Citation