• Chinese Optics Letters
  • Vol. 16, Issue 10, 100605 (2018)
Xiaojie Shen1, Jiahao Huo1、2, Xian Zhou1、2、*, Kangping Zhong3, Jinhui Yuan2, Jiajing Tu1, Keping Long1, Changyuan Yu2, Alan Pak Tao Lau4, and Chao Lu2
Author Affiliations
  • 1Institute of Artificial Intelligence, University of Science and Technology Beijing (USTB), Beijing 100083, China
  • 2Department of Electronic and Information Engineering, The Hong Kong Polytechnic University, Hung Hom, Kowloon, Hong Kong 999077, China
  • 3MACOM Technology Solutions, Shenzhen 518000, China
  • 4Department of Electrical Engineering, The Hong Kong Polytechnic University, Hung Hom, Kowloon, Hong Kong 999077, China
  • show less
    DOI: 10.3788/COL201816.100605 Cite this Article Set citation alerts
    Xiaojie Shen, Jiahao Huo, Xian Zhou, Kangping Zhong, Jinhui Yuan, Jiajing Tu, Keping Long, Changyuan Yu, Alan Pak Tao Lau, Chao Lu. Performance comparison among three different Stokes vector direct-detection receivers[J]. Chinese Optics Letters, 2018, 16(10): 100605 Copy Citation Text show less
    Structures of SV-DD transmitters: (a) polarization division multiplexing based on intensity modulation and (b) polarization division multiplexing with signal-carrier.
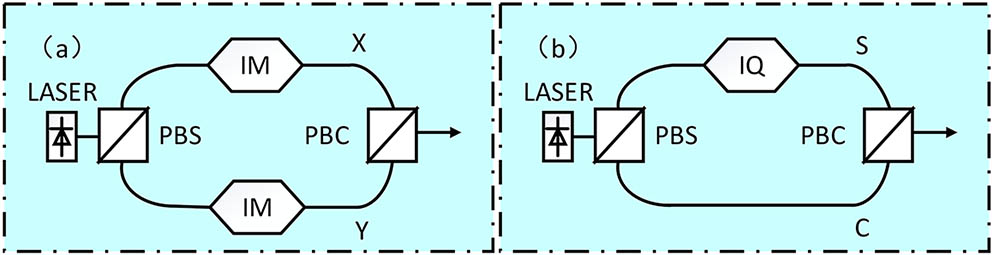
    Fig. 1. Structures of SV-DD transmitters: (a) polarization division multiplexing based on intensity modulation and (b) polarization division multiplexing with signal-carrier.
    Structures of SV-DD receivers. (a) Receiver A: with two BPDs, two PDs, and a 90° optical hybrid. (b) Receiver B: with four PDs, and a 90° optical hybrid. (c) Receiver C: with four PDs and a 3×3 coupler.
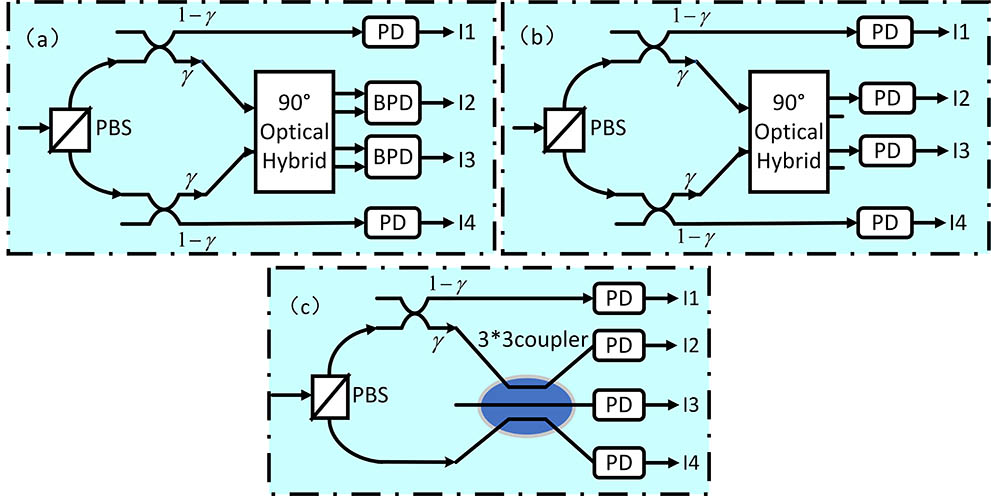
    Fig. 2. Structures of SV-DD receivers. (a) Receiver A: with two BPDs, two PDs, and a 90° optical hybrid. (b) Receiver B: with four PDs, and a 90° optical hybrid. (c) Receiver C: with four PDs and a 3×3 coupler.
    Normalized noise power as a function of the coupler splitting ratio of the PDM-IM: (a) for receiver A, (b) for receiver B, and (c) for receiver C.
    Fig. 3. Normalized noise power as a function of the coupler splitting ratio of the PDM-IM: (a) for receiver A, (b) for receiver B, and (c) for receiver C.
    Normalized noise power as a function of the coupler splitting ratio of the PDM-SC: (a) for receiver A, (b) for receiver B, and (c) for receiver C.
    Fig. 4. Normalized noise power as a function of the coupler splitting ratio of the PDM-SC: (a) for receiver A, (b) for receiver B, and (c) for receiver C.
    Simulation results for the PDM-IM system: (a) BER vs. coupler splitting ratio for different SOPs for receiver A, (b) BER vs. coupler splitting ratio for different SOPs for receiver B, (c) BER vs. coupler splitting ratio for different SOPs for receiver C, and (d) BER vs. received optical power for different SVRs in BTB transmissions.
    Fig. 5. Simulation results for the PDM-IM system: (a) BER vs. coupler splitting ratio for different SOPs for receiver A, (b) BER vs. coupler splitting ratio for different SOPs for receiver B, (c) BER vs. coupler splitting ratio for different SOPs for receiver C, and (d) BER vs. received optical power for different SVRs in BTB transmissions.
    Simulation results for the PDM-SC system: (a) BER vs. coupler splitting ratio for different SOPs for receiver A, (b) BER vs. coupler splitting ratio for different SOPs for receiver B, (c) BER vs. coupler splitting ratio for different SOPs for receiver C, and (d) BER vs. ROP for different SVRs in BTB transmissions.
    Fig. 6. Simulation results for the PDM-SC system: (a) BER vs. coupler splitting ratio for different SOPs for receiver A, (b) BER vs. coupler splitting ratio for different SOPs for receiver B, (c) BER vs. coupler splitting ratio for different SOPs for receiver C, and (d) BER vs. ROP for different SVRs in BTB transmissions.
    Simulation results with 2.5 dB EL for the 90° hybrid and 0.15 dB EL for the 3×3 coupler: BER vs. coupler splitting ratio for different SOPs (a) for receiver A for the PDM-IM system, (b) for receiver A for the PDM-SC system, (c) for receiver C for the PDM-IM system, and (d) for receiver C for the PDM-SC system.
    Fig. 7. Simulation results with 2.5 dB EL for the 90° hybrid and 0.15 dB EL for the 3×3 coupler: BER vs. coupler splitting ratio for different SOPs (a) for receiver A for the PDM-IM system, (b) for receiver A for the PDM-SC system, (c) for receiver C for the PDM-IM system, and (d) for receiver C for the PDM-SC system.
    ParameterValuesParameterValues
    Baud28 GbaudDAC/ADC rate56 GSam/s
    Laser linewidth5 MHzPD responsibility0.65 A/W
    Laser RIN160dB/HzPD thermal noise20pA/Hz0.5
    TX/RX bandwidth20 GHzPD dark current10 nA
    Table 1. General Simulation Parameters of 112 Gbit/s PDM-DD Systems
    System SchemeTransmitterReceiverELOptimum splitting ratioSOP independent splitting ratioROP sensitivity (@BER 3.8 × 10−3)
    PDM-PAM4-DD (hybrid)2×IM2PD+2BPDNo0.60.6676.8dBm
    PDM-PAM4-DD (hybrid)2×IM4PDNo0.75.7dBm
    PDM-PAM4-DD (3 × 3 coupler)2×IM4PDNo0.50.58.4dBm
    PDM-SC-16QAM-DD (hybrid)1×I/Q2PD+2BPDNo0.70.6678.7dBm
    PDM-SC-16QAM-DD (hybrid)1×I/Q4PDNo0.76.6dBm
    PDM-16QAM-DD (3×3 coupler)1×I/Q4PDNo0.50.59.6dBm
    PDM-PAM4-DD (hybrid)2×IM2PD+2BPDYes (2.5 dB)0.70.85dBm
    PDM-SC-16QAM-DD (hybrid)1×I/Q2PD+2BPDYes (2.5 dB)0.80.86.9dBm
    PDM-PAM4-DD (3×3 coupler)2×IM4PDYes (0.15 dB)0.50.58.15dBm
    PDM-16QAM-DD (3×3 coupler)1×I/Q4PDYes (0.15 dB)0.50.59.35dBm
    Table 2. Comparison of 112 Gbit/s PDM-PAM4 and PDM-SC Signals with Different SV-DD Receivers. IM: Intensity Modulation; I/Q: I/Q Modulator; BPD: Balanced Photodetector
    Xiaojie Shen, Jiahao Huo, Xian Zhou, Kangping Zhong, Jinhui Yuan, Jiajing Tu, Keping Long, Changyuan Yu, Alan Pak Tao Lau, Chao Lu. Performance comparison among three different Stokes vector direct-detection receivers[J]. Chinese Optics Letters, 2018, 16(10): 100605
    Download Citation