
Yong Zhang, David J. Smith. Comprehensive,in operando, and correlative investigation of defects and their impact on device performance[J]. Journal of Semiconductors, 2022, 43(4): 041102
- Journal of Semiconductors
- Vol. 43, Issue 4, 041102 (2022)
Abstract
1. Introduction
Defects in semiconductors consist of two major types, namely, point defects and extended defects[
There are many different methods available for characterizing the structure and properties of individual defects correlatively[
(i) How is device performance affected by an individual defect? Many such defects, including their atomic structure, can be imaged but the defects are typically not studied in functioning devices.
(ii) In what way does the impact of the defect depend on the device operation conditions? For instance, some defect types are likely to be more problematic at low carrier density, whereas others might be more detrimental at high carrier density. Such conditions could, for example, apply to a solar cell operating at one sun vs. 1000 suns or to an LED operating at 10 mA vs. 1000 mA.
(iii) How does the impact vary from one defect to another? One specific type of defect might be thought to be worse than another, but it is impractical to construct specific defects with known microscopic structure in a device and then compare their impact.
This type of information would enable a much more concrete understanding of the crucial role of defects in device operation, particularly providing the knowledge for assessing the need and possible strategies for removing or mitigating their impact.
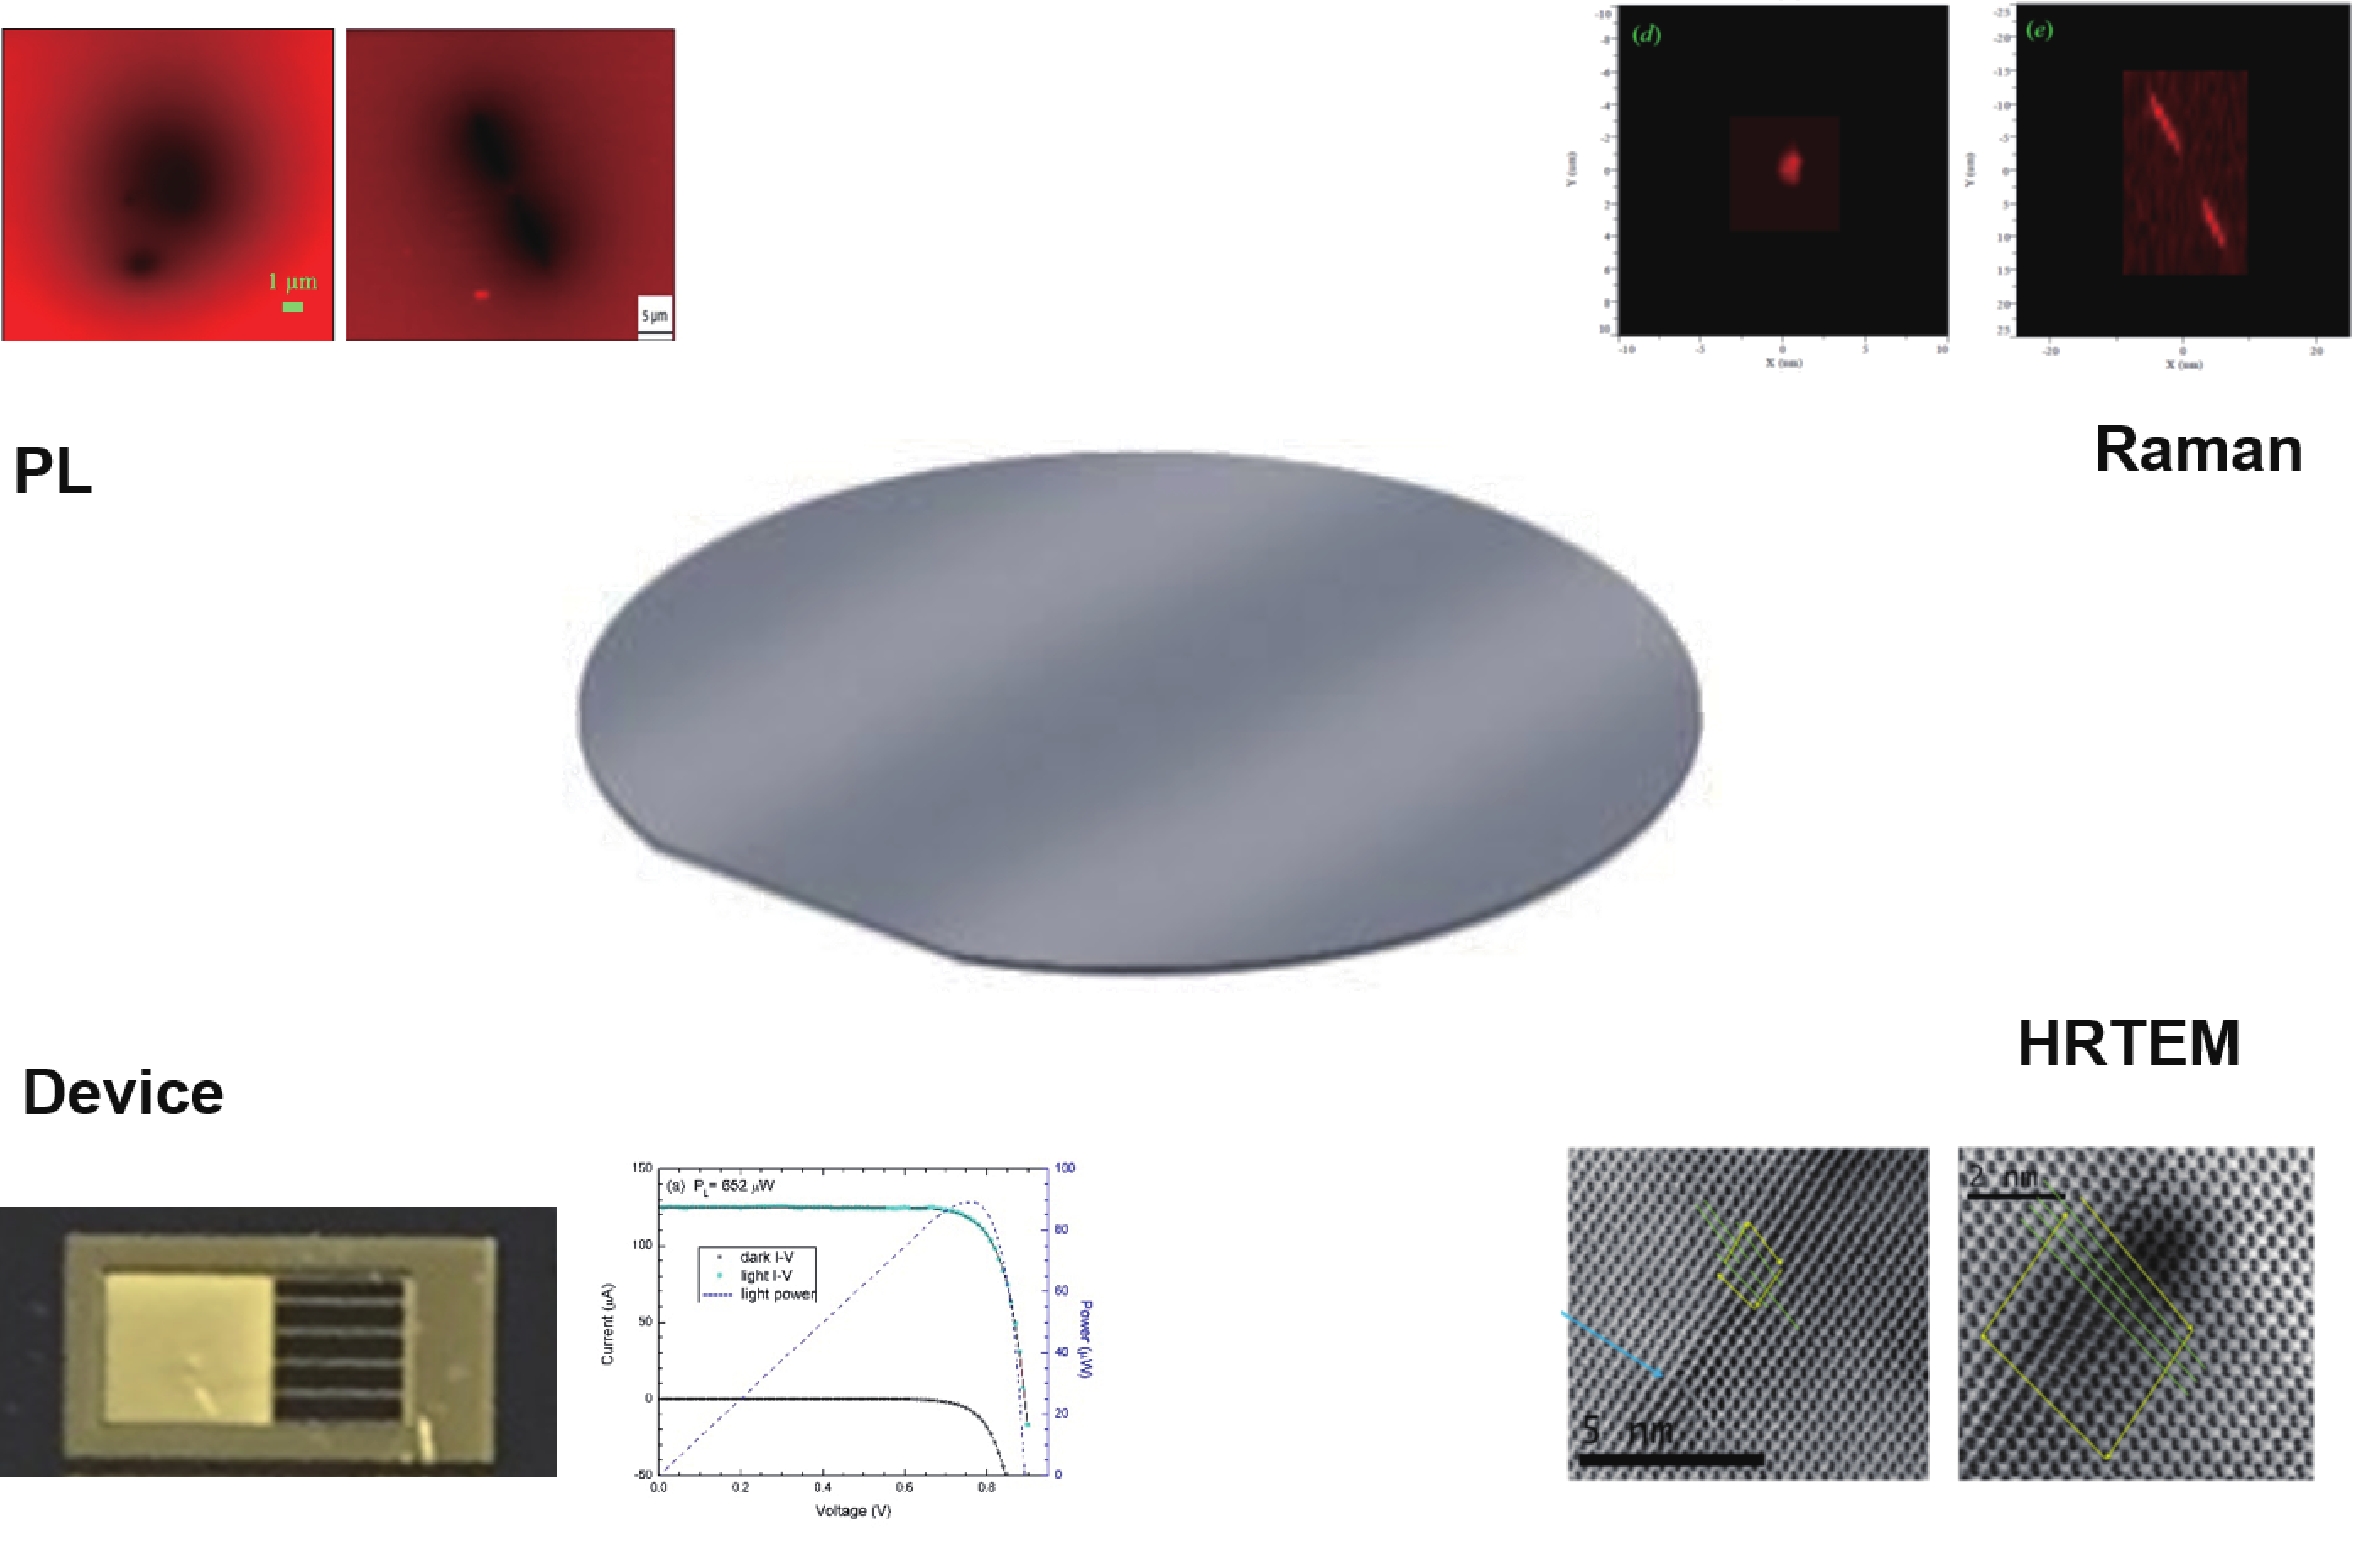
Despite the long history of semiconductor defect research, the efforts have not always been very effective. Defect studies have mostly been performed in a parallel mode. One wafer is divided into multiple pieces used separately for structural, optical, and electrical characterization, as well as device fabrication and testing, as illustrated in Fig. 1: confocal photoluminescence (PL) imaging in one piece identified some defects that quenched the PL signal; high-resolution Raman imaging in another piece showed enhanced Raman signal at certain defect sites; high-resolution transmission electron microscopy (HRTEM) in yet another piece observed a dislocation defect and determined its detailed structure; and one more piece was fabricated into a solar cell on which an individual defect was located, for example by PL imaging, and this defect was further found to significantly reduce the photovoltaic efficiency when a laser beam was focused at the defect location. This commonly adopted approach of defect study clearly yields a lot of interesting information about the defects present in a particular material, and the general practice appears to be efficient. Unfortunately, it is incapable of yielding conclusive information about how the specific defects might affect the device performance or provide definitive answers to the crucial questions posed above. The major limitation of this approach is that either the defect investigated by structural characterization techniques is not the same defect that is affecting the device performance (i.e., they are presumed to be similar defects but are nevertheless taken from different pieces of the material) or the defect is not characterized under normal device operating conditions.
![]()
Figure 1.(Color online) The parallel mode of defect characterization – wafer is cut into pieces for separate studies. Examples used are only for demonstration purposes. They are not necessarily obtained from the same wafer.
There are in fact many well-known defect characterization techniques that provide qualitative assessments of material quality, such as chemical etching where the observed etch pit density is used as a measure of defect density and often correlates well qualitatively with device performance. However, it is usually unclear what effects a defect corresponding to a specific etch pit would have if the material were used for fabricating a real device, for instance, a solar cell. Attempting to address this question, we decided to correlate PL imaging, chemical etching, and scanning electron microscopy (SEM) imaging of CdTe epilayers by carrying out the measurements in the same order as they are mentioned[
This background has inspired us to embrace a more comprehensive approach to defect study, namely applying an array of correlative and spatially-resolved optical, electrical, and structural characterization techniques, all at the individual defect level but applied sequentially, i.e., in a series mode[
![]()
Figure 2.(Color online) Series mode of defect study. Examples used are only for demonstration purposes. They are not necessarily obtained from the same device.
In this focused review, we describe some examples from our recent work[
2. Demonstration using GaAs solar cells
2.1. Identification of isolated defects in a finished device
Because of the relatively low density of dislocation defects (on the order of 103 cm–2 or lower) in the GaAs epilayer, it is inefficient and even challenging to identify individual defects using PL via raster scan. In a simple GaAs double heterostructure (DH) sample (e.g., GaInP/GaAs/GaInP), a PL imaging system was normally used to first identify the approximate locations of individual defects over a macroscopic area in the sample[
![]()
Figure 3.(Color online) Correlative optical characterization of dislocation defects in a GaAs solar cell. (a) EL image using a 50×/NA0.5 LWD lens for device #5-2, showing a cluster of defects. (b) Optical image of the same area of (a) where red dots indicate defect locations. (c) PL mapping near the defect cluster using a 100×/NA0.9 lens with beam size approximately shown by the size of the red dot in (b). (d) PL spectra from typical defect-free location and the largest defect (#5-2A). (e) Raman mapping near the largest defect (#5-2A). (f) Raman spectra from a typical defect-free location and the largest defect in (e). (reproduced with permission[
2.2. High resolution optical characterization of individual defects
Observations with high-resolution PL and Raman mapping scans were then used to confirm that the suspects located by EL imaging are indeed dislocation defects, because dislocation defects tend to exhibit certain distinctive features in PL and Raman[
2.3. Microscopic I–V measurements under illumination at defect sites
A dark I–V characteristic reflects the average property of the device, which obviously cannot probe individual defects. However, under the illumination of a focused beam, the inhomogeneity of the device can be investigated. By raster scanning the laser beam while monitoring the short-circuit current of a PV cell, one can have a so-called laser-beam-induced current (LBIC) map[
It is not always possible to make direct comparison between the macroscopic and microscopic I–V characteristics. The reason is that the device is operated under very different conditions between the two cases. Only a very small area is illuminated in the microscopic measurement, which is approximately equivalent to a solar cell with a small active area that is under illumination and a large electrode area, the whole non-illuminated area, that is under forward bias, thus resulting in much higher dark current. Hence, the microscopic light I–V curve tends to show reducedVoc and FF, which was very significant for the CZTSe cells[
Fig. 4 shows the microscopic light I–V characteristics measured at the location of the largest defect #5-2A identified in Fig. 3(a) under different illumination powers. For reference, the light and dark I–V curves for cell #5 as a whole are shown in Fig. 4(a). The dark I–V curve indicates a well-behaved diode characteristic. The light I–V curve is obtained using a solar simulator with a power density of 850 W/m2, which gives rise to Isc = 0.125 mA, Voc = 893 mV, and Pmax = 0.0892 mW. Using the total active device area (the sum of all the strips) of 0.767 mm2 or PL = 0.652 mW, the energy conversion efficiency of this small cell is η = Pmax/PL = 13.7%, and the fill factor is FF = Pmax/(IscVoc) = 0.799. Figs. 4(b)–4(d) show results obtained using a 532 nm focused laser beam (with a 50xLWD/ND0.5 lens) under three laser powers (roughly over three orders in magnitude), PL = 213, 18.5, and 1.82 µW, respectively. Key cell parameters were calculated from the measured data given in Table 1.
![]()
Figure 4.(Color online) Impact of a defect on solar cell characteristic: left axes for
All cell parameters are found to degrade at the defect site, regardless of the illumination power level, but the extent of degradation depends on the illumination density. From the high to low power, the reductions in efficiency are 72.3%, 66.5%, and 68.2%, respectively, for the three laser powers. For this particular defect, the variation in the magnitude of efficiency reduction does seem to depend on the illumination density. Because the laser spot size is much larger than the defect core, theI−V characteristic of the “defect site” actually reflects an average effect within the laser spot size which is comparable to the lateral carrier diffusion length in this device. These results provide semi-quantitative assessment of the impact of an individual defect in a solar cell. However, it is non-trivial to evaluate the impact of an individual defect exactly in a device, which depends on the impacted area relative to the total illuminated area. Despite the significant efficiency reductions, the ratios are nevertheless much smaller than those in PL, because PL is measured under the open-circuit condition where the nonradiative recombination is much more competitive than the radiative recombination. In fact, the GaAs materials comparable to the one used in this solar cell exhibited relatively low internal quantum efficiency in PL at the low excitation density (e.g., 1 sun)[
The light I–V characteristic of a well-behaved solar cell can be described by the standard model[
where IL is the photo-generated current, I0 is the dark reverse saturation current, V is the photo-voltage generated by the solar cell, n is the diode ideality factor (n = 1 for an ideal diode), Rsh is the shunt resistance (ideally infinity), and Rs is the series resistance (ideally zero). Additionally, q is the electron charge, k is the Boltzmann’s constant, and T is the absolute temperature. Eq. (1) is not, strictly speaking, applicable for the focused illumination. However, since the obtained I–V curves under focused illumination appear similar to a typical well-behaved solar cell, they can be fitted well using Eq. (1). The fitting curves are plotted in Figs. 4(b)–4(d), and show excellent agreement with the measured data. The effective n, Rsh and Rs values are obtained from the fitting, and are listed in Table 1. Quantitative comparisons of I0 and n between either uniform and focused illumination or defect-free and defect site are not straightforward to make, other than noting that I0 is significantly larger for focused illumination, because the dark area is much larger for the latter case. A more important finding between the defect-free and defect sites is that the latter consistently yields lower shunt resistance under the same illumination power, and more so for higher illumination power. This trend can be explained as follows: firstly, the dislocation defect provides a shunt to the photogenerated carriers; secondly, the effect is more significant for high excitation density, because the effect of the point defects is saturated, and the dislocation defect becomes more prevalent[
2.4. Impact variation for different defects
Several threading dislocation defects were characterized by PL, Raman, and I–V characteristic under the same conditions, as shown in Fig. 5
![]()
Figure 5.(Color online) Comparison of different defects. (a, b) PL and Raman mapping of defect #5-2B and #5-2C. (c, d) PL and Raman mapping of defect #5-3A. (e, f) PL and Raman spectra of defect #5-2A-C and #5-3A, and a defect-free site. (g, h) The same in
2.5. Correlative structural characterization of individual defects
Once optical and optoelectronic characterization of individual defects are completed, the next logical step is to investigate the microscopic structure of the same defects. However, this specific step has rarely been taken in the past defect research. In our study, the defect locations, defined as the lowest PL intensity positions, were carefully noted under high magnification optical microscope imaging (with about 0.1 μm accuracy), typically with respect to some nearby recognizable surface feature, so that they could be located again using the SEM in the dual-beam FIB system that was used for preparing the cross-sectional TEM samples. Several defects were investigated. Results are highlighted here for two of them: #5-2A and #5-3A.
![]()
Figure 6.(Color online) TEM images of defect #5-2A. (a) Low magnification image of defective region. (b) Enlargement taken from the area indicated by the yellow box in (a). (c–h) High-resolution images of areas indicated in (a): (c) from area 1; (d–f) from area 3 with different magnification, where in (e) the end of the stacking fault marked by a black square ends in a 30° partial dislocation while the other end terminates in a 90° partial dislocation, and in (f) enlarged view of the area marked by the black square has a single atomic column of arsenic atoms at the core of the 30° partial dislocation (marked by white arrow). (g, h) from area 4: (g) 60° dislocation near top of the image. The extra half-plane of paired columns is indicated with a white line. (h) Enlarged view of 60° dislocation in (g). Burgers circuit is shown in white with the resulting Burgers vector shown in red. The extra half-plane is marked in black. (reproduced with permission[
Fig. 7 shows the results of the microscopic characterization of defect #5-3A, which is structure-wise distinctly different from #5-2A, and has been shown to have comparable impact on the optical properties and device performance (Fig. 5). In the optical image of the device (not shown), there is a white spot right next to the EL dark spot at defect #5-3A. The low-resolution TEM image in Fig. 7(a) reveals that the white spot corresponds to a pit-like feature in GaAs near the device surface, which is covered over by the GaInP window layer, while the dark spot in the EL map is caused by the defect cluster adjacent to the pit. This defect cluster extends mostly along {111}-type directions from the surface of the solar cell down into the absorber material for at least 2 μm, but not apparently all the way through to the back-surface confinement layer. However, it is far less extended laterally compared to #5-2A. It includes many structural defects, which are mostly concentrated in the top 1 μm of the absorber layer. Fig. 7(b) is a HAADF image showing a major intersection of defect clusters and Fig. 7(c) is a corresponding large-angle BF (LABF) image taken at higher magnification. Fig. 7(d) is a LABF STEM image of the area in the white square in Fig. 7(c), and shows a single 30° partial dislocation that terminates an intrinsic stacking fault. The dislocation type is identified in Fig. 7(d) by drawing a Burgers circuit around the defect, as shown by the red arrows. The resulting projected Burgers vector is indicated by the red arrow. The extended stacking fault is terminated by a single, unpaired atomic column indicated by the white circle in the figure, which is identified as corresponding to As.
![]()
Figure 7.(Color online) TEM images of defect #5-3A. (a) Low magnification image of defective region (note the triangular-shaped pit beneath sample surface adjacent to the defect cluster); (b) HAADF image, and (c) LABF image, showing major intersection of stacking defects and dislocations; (d) Aberration-corrected LABF STEM image of an intrinsic stacking fault terminated by a 30° partial dislocation as identified by the Burgers′ circuit shown in yellow. Single As atomic column (circled) at the defect core. (reproduced with permission[
Each of the defect clusters was unique, yet they shared common characteristics. Visual comparison of the different defect clusters showed that every cluster was dominated by a collection of extended {111}-type stacking faults, mostly located near the top of the device in the GaAs emitter and absorber layers. In contrast to the common belief that dislocation defects in the GaAs epilayer originate from the substrate that happens to have a comparable defect density, these defects were typically initiated within the absorber layer at around 0.5 to 1.5 μm from the lower GaAs/GaInP interface, and passed through the GaAs emitter and the GaInP window layer. However, one defect cluster (#5-2A), with relatively short stacking faults, remained mostly confined to the n+ GaAs emitter layer, leaving the GaInP window layer nearly free of defects, and only extended down into the GaAs absorber layer over a short distance (~0.25 μm). It might seem counter-intuitive that the GaInP PL signal is often weaker from the non-defective GaInP site (#5-2A) than from the defective GaInP site (#5-3A), as shown in Fig. 5(e). The explanation could be that the carriers in the former case are mostly captured by the underneath GaAs layer, whereas the carriers are localized to the GaInP layer itself in the latter case.
Although we did not observe significant change (enhancement) of the TO mode intensity at the defect site, as previously suggested resulting from relaxation in selection rule due to defect induced disordering[
Overall, these observations reveal that those defects showing major impact on optoelectronic performance (e.g., reduction in PL intensity and photo-current) were most often associated with a cluster of extended defects rather than a single extended defect, as previously assumed based on optical data alone. Those extended defects that exhibited weaker impact on the material properties and device performance have not been carefully examined. Quite likely they were simpler defects, which remain to be investigated.
One further step towards advancing this correlative approach to defect characterization would naturally be to perform density-functional theory (DFT) level structural and electronic calculations using the HRTEM results as inputs. However, realistically, the defect complexes, such as those discussed above (e.g., #5-2A and #5-3A), are too challenging for the most capable DFT codes to deal with at this time. Nevertheless, one could begin with those well-defined sub-structures for the defect modeling.
The series approach illustrated above has provided unique and unprecedent insights for both practical knowledge of the adverse effects of defects and fundamental understanding of defect physics at the single defect level. The impact of the dislocation defect on the solar cell performance parameters tends to be more significant at higher illumination density, because of the competing roles of point and extended defects. In addition to reduction in photo-current and open-circuit voltage, the dislocation defects also reduce the shunt resistance, due to enhanced recombination loss through the defect states. The degree of impact varies significantly among different defects, and the trend is mostly consistent between the spectroscopy signatures (e.g., PL intensity) and optoelectrical characteristics (e.g., I–V characteristic). In the future, the same approach can be used to probe devices under high injection current or high illumination density to induce structural modifications of the defects, and then to investigate the effects.
3. 3-D Raman thermometry for device characterization
Several techniques are available to measure device temperature, from perhaps the most straightforward method – IR imaging[
Fig. 8 shows the LED device and the 3-D locations that were measured in this demonstration. Fig. 8(a) shows the optical image of the device, and Fig. 8(b) the cross-section SEM image. As shown schematically in Fig. 8(c), a total of 60 locations were measured on one vertical cross section area at different depths from the sapphire substrate/GaN buffer layer interface to the top surface of the device.
![]()
Figure 8.(Color online) Top and cross-sectional images of the LED, and temperature probing points on the device cross section. (a) Top view of optical microscope image, (b) cross-sectional SEM image, (c) cross-sectional schematic drawing showing the measured locations (blue dots) at four different depths, and (d) a cross-sectional TEM image from a similar device. (reproduced with permission[
The results are shown in Fig. 9 under 350 mA current (for a 1 mm size LED chip). Fig. 9(a) depicts the measured temperature contour in the x–z cross section. The overall temperature profile looks like a columnar shape along the vertical direction. Assuming the LED junction temperature is the same as the top surface temperature, we find that at 350 mA the average temperature difference is only approximately 2 °C between the top and bottom of the GaN epilayer, as shown in Fig. 9(b). However, we note that the magnitude of temperature fluctuation within the same depth can be significantly larger than the overall laterally averaged variation in the depth direction, because for various reasons the device simply does not have an axial symmetry to justify treating it as a 1-D system. Within the cross section, the maximum temperature of 86.2 °C (location no. 4) is measured at the top surface and a minimum temperature of 74.8 °C (no. 1) is measured at the bottom surface close to the sapphire substrate. Raman spectra of a few extreme points (no. 1 to no. 4) are included in Fig. 9(a). Moreover, we find that, despite some fluctuation, on average the GaN temperature near the top of the patterned sapphire pillars is lower than that of the region between the top sites at the same height. Fig. 9(c) plots the temperatures from 32 locations for each of the two types of sites and the averaged difference is approximately 5.7 °C. We note that the density of the hot spots is much lower than the typical defect density in this type of material, as shown by the TEM image from a similar device, Fig. 8(d).
![]()
Figure 9.(Color online) 3D temperature profile sampling results. (a) Cross-sectional temperature contours calculated from the intensity ratio of Stokes and anti-Stokes Raman scattering and Raman spectra of a few extreme points (no. 1 to no. 4) below. (b) Average temperatures at different depths. (c) Scattered plots of temperatures at two types of sites (“top” and “valley”) at the first depth. (reproduced with permission[
Clearly it is of great interest to further investigate the microscopic structure of the identified hot spots using HRTEM, as we have done for GaAs solar cells to correlate the spatially resolved optoelectronic characterization with structural analysis[
The 3-D Raman thermometry is equally applicable to other devices, such as monitoring highly non-uniform heating, potentially the failure mechanism, in power electronic devices. More effectively, one can apply a similar correlative approach demonstrated for the GaAs solar cells to power electronic devices based on III-nitrides, SiC, and Ga2O3, which likewise face device fabrication, performance, and reliability challenges related to extended defects. For example, we recently observed the morphology of failed GaN-on-GaN vertical p–i–n diode devices after reverse-bias electrical stressing to breakdown, and found large surface craters that were ~15–35 μm deep with lengthy surface cracks, and substantial concentrations of threading dislocations around the cracks and near the crater surfaces[
![]()
Figure 10.(Color online) Plan-view SEM image showing two distinct failure modes in GaN power devices stressed to breakdown: i) Black: deep cracks and surface crater; ii) Red: cracks branching out from device.
4. Concluding remarks
Using GaAs solar cells as prototype devices, we have demonstrated how a series approach to device characterization, which offers comprehensive, in operando and correlative information about defects in a semiconductor device, can lead to answers to the important questions that would otherwise never be answered with certainty. We anticipate that this novel approach, coupled with the various spatially-resolved characterization techniques described in this review, can be more broadly applied to investigate the physics of defect and the roles that they play in real devices under different operation conditions, and to assess practical device reliability issues.
Acknowledgements
This work was partially supported by ARO/Electronics (Grant No. W911NF-16-1-0263). YZ acknowledges the support of Bissell Distinguished Professorship at UNC-Charlotte.
References
[1]
[2]
[3]
[4]
[5] T H Gfroerer, Y Zhang, M W Wanlass. An extended defect as a sensor for free carrier diffusion in a semiconductor. Appl Phys Lett, 102, 012114(2013).
[6] F Zhang, J F Castaneda, S S Chen et al. Comparative studies of optoelectrical properties of prominent PV materials: Halide perovskite, CdTe, and GaAs. Mater Today, 36, 18(2020).
[7] Y Lin, Y Zhang, Z Q Liu et al. Interplay of point defects, extended defects, and carrier localization in the efficiency droop of InGaN quantum wells light-emitting diodes investigated using spatially resolved electroluminescence and photoluminescence. J Appl Phys, 115, 023103(2014).
[8] P Petroff, R L Hartman. Defect structure introduced during operation of heterojunction GaAs lasers. Appl Phys Lett, 23, 469(1973).
[9] C Kurtsiefer, S Mayer, P Zarda et al. Stable solid-state source of single photons. Phys Rev Lett, 85, 290(2000).
[10] S Francoeur, J F Klem, A Mascarenhas. Optical spectroscopy of single impurity centers in semiconductors. Phys Rev Lett, 93, 067403(2004).
[11] M J Romero, H Du, G Teeter et al. Comparative study of the luminescence and intrinsic point defects in the kesterite Cu2ZnSnS4 and chalcopyrite Cu(In, Ga)Se2 thin films used in photovoltaic applications. Phys Rev B, 84, 165324(2011).
[12] K Alberi, B Fluegel, H Moutinho et al. Measuring long-range carrier diffusion across multiple grains in polycrystalline semiconductors by photoluminescence imaging. Nat Commun, 4, 2699(2013).
[13] H N Liu, Y Zhang, Y P Chen et al. Confocal micro-PL mapping of defects in CdTe epilayers grown on Si (211) substrates with different annealing cycles. J Electron Mater, 43, 2854(2014).
[14] B Fluegel, K Alberi, M J DiNezza et al. Carrier decay and diffusion dynamics in single-crystalline CdTe as seen via microphotoluminescence. Phys Rev Applied, 2, 034010(2014).
[15] D Kuciauskas, T H Myers, T M Barnes et al. Time-resolved correlative optical microscopy of charge-carrier transport, recombination, and space-charge fields in CdTe heterostructures. Appl Phys Lett, 110, 083905(2017).
[16] X Xu, S P Beckman, P Specht et al. Distortion and segregation in a dislocation core region at atomic resolution. Phys Rev Lett, 95, 145501(2005).
[17] D J Smith, T Aoki, J Mardinly et al. Exploring aberration-corrected electron microscopy for compound semiconductors. Microscopy, 62, S65(2013).
[18] C Li, Y L Wu, T J Pennycook et al. Carrier separation at dislocation pairs in CdTe. Phys Rev Lett, 111, 096403(2013).
[19] B Hauer, C E Marvinney, M Lewin et al. Exploiting phonon-resonant near-field interaction for the nanoscale investigation of extended defects. Adv Funct Mater, 30, 1907357(2020).
[20] Q Chen, B S McKeon, S Y Zhang et al. Impact of individual structural defects in GaAs solar cells: A correlative and in operando investigation of signatures, structures, and effects. Adv Opt Mater, 9, 2001487(2021).
[21] Q Chen, B S McKeon, J Becker et al. Correlative characterization of dislocation defects and defect clusters in GaAs and CdTe solar cells by spatially resolved optical techniques and high-resolution TEM. 2018 IEEE 7th World Conference on Photovoltaic Energy Conversion, 3234(2018).
[22] Q Chen, Y Zhang. The reversal of the laser-beam-induced-current contrast with varying illumination density in a Cu2ZnSnSe4 thin-film solar cell. Appl Phys Lett, 103, 242104(2013).
[23] C H Lin, T A Merz, D R Doutt et al. Strain and temperature dependence of defect formation at AlGaN/GaN high-electron-mobility transistors on a nanometer scale. IEEE Trans Electron Devices, 59, 2667(2012).
[24] T Park, Y J Guan, Z Q Liu et al. In operando micro-Raman three-dimensional thermometry with diffraction-limit spatial resolution for GaN-based light-emitting diodes. Phys Rev Appl, 10, 034049(2018).
[25] F Chen, Y Zhang, T H Gfroerer et al. Spatial resolution versus data acquisition efficiency in mapping an inhomogeneous system with species diffusion. Sci Rep, 5, 10542(2015).
[26] C Hu, Q Chen, F Chen et al. Overcoming diffusion-related limitations in semiconductor defect imaging with phonon-plasmon-coupled mode Raman scattering. Light Sci Appl, 7, 23(2018).
[27] G Irmer, M Wenzel, J Monecke. Light scattering by a multicomponent plasma coupled with longitudinal-optical phonons: Raman spectra ofp-type GaAs:Zn. Phys Rev B, 56, 9524(1997).
[28] A Mooradian, G B Wright. Observation of the interaction of plasmons with longitudinal optical phonons in GaAs. Phys Rev Lett, 16, 999(1966).
[29]
[30] O Paetzold, G Irmer, J Monecke et al. Micro Raman study of dislocations in n-type doped GaAs. J Raman Spectrosc, 24, 761(1993).
[31] P Martín, J Jiménez, C Frigeri et al. A study of the dislocations in Si-doped GaAs comparing diluted Sirtl light etching, electron-beam-induced current, and micro-Raman techniques. J Mater Res, 14, 1732(1999).
[32] K S Chang, S C Yang, J Y Kim et al. Precise temperature mapping of GaN-based LEDs by quantitative infrared micro-thermography. Sensors, 12, 4648(2012).
[33] D T Wu, G Busse. Lock-in thermography for nondestructive evaluation of materials. Revue Générale De Thermique, 37, 693(1998).
[34] J Dallas, G Pavlidis, B Chatterjee et al. Thermal characterization of gallium nitride p-i-n diodes. Appl Phys Lett, 112, 073503(2018).
[35] J Senawiratne, Y Li, M Zhu et al. Junction temperature measurements and thermal modeling of GaInN/GaN quantum well light-emitting diodes. J Electron Mater, 37, 607(2008).
[36] Y Lin, Y Zhang, Z Liu et al. Spatially resolved study of quantum efficiency droop in InGaN light-emitting diodes. Appl Phys Lett, 101, 252103(2012).
[37] P Peri, K Fu, H Q Fu et al. Structural breakdown in high power GaN-on-GaN p-n diode devices stressed to failure. J Vac Sci Technol A, 38, 063402(2020).


Set citation alerts for the article
Please enter your email address

© Copyright 2018-2021 | Chinese Laser Press. All Rights Reserved 沪ICP备15018463号-20