• Photonics Research
  • Vol. 10, Issue 5, 1210 (2022)
Zheng Sun1、†, Minghui Duan1、†, Yabing Zheng, Yi Jin*, Xin Fan, and Jinjin Zheng
Author Affiliations
  • Department of Precision Machinery and Precision Instruments, University of Science and Technology of China, Hefei 230022, China
  • show less
    DOI: 10.1364/PRJ.451818 Cite this Article Set citation alerts
    Zheng Sun, Minghui Duan, Yabing Zheng, Yi Jin, Xin Fan, Jinjin Zheng. Intensity diffusion: a concealed cause of fringe distortion in fringe projection profilometry[J]. Photonics Research, 2022, 10(5): 1210 Copy Citation Text show less
    Illustration of the intensity diffusion. (a) Designed pattern. (b) Designed pattern without the central area. (c) The image of (a). (d) The image of (b). (e) Cross sections of the patterns in (a) and (b). (f) Cross sections of the images in (c) and (d).
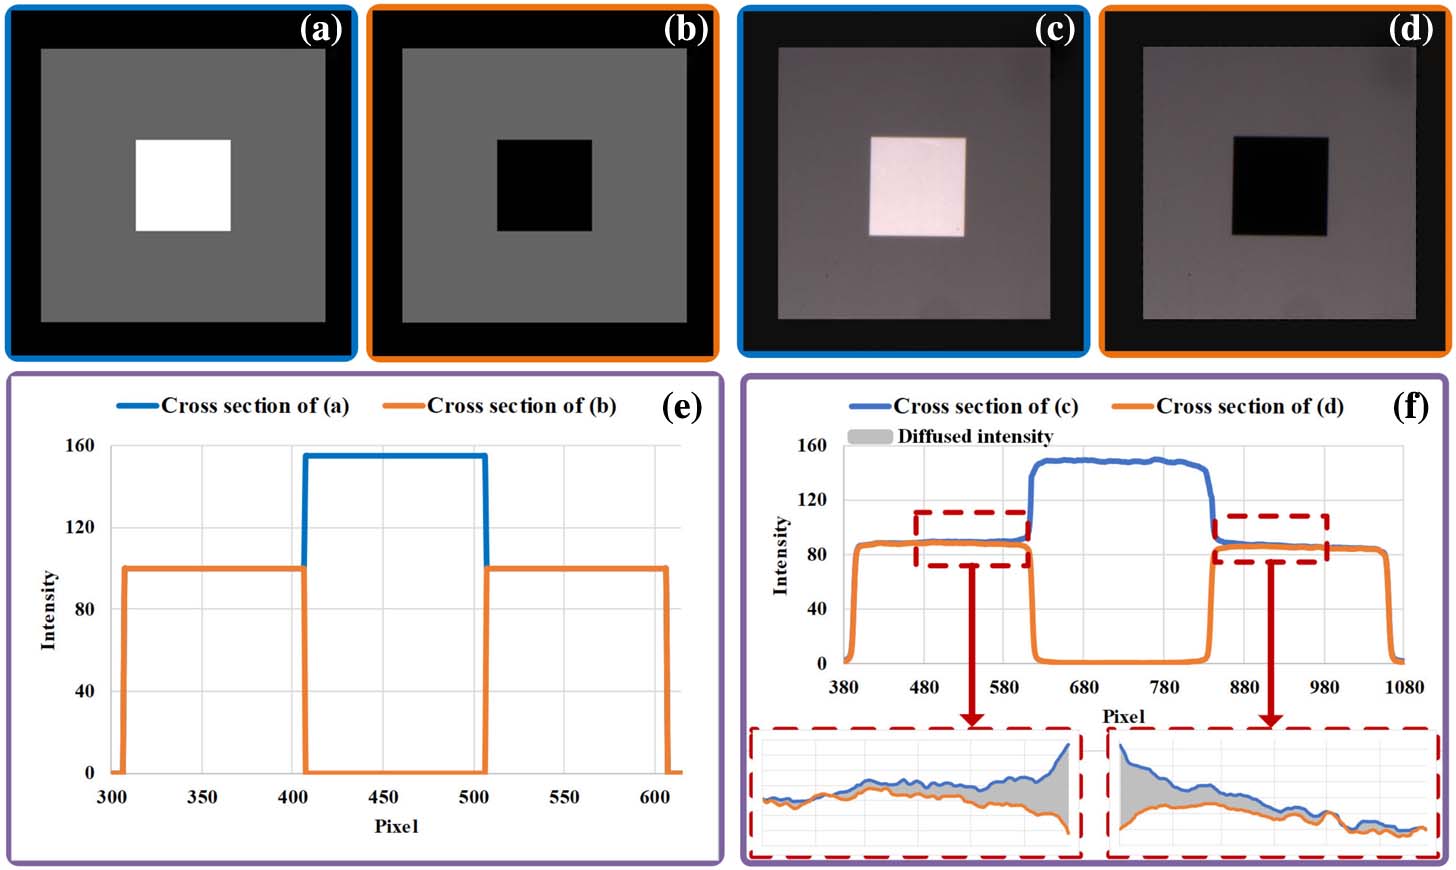
    Fig. 1. Illustration of the intensity diffusion. (a) Designed pattern. (b) Designed pattern without the central area. (c) The image of (a). (d) The image of (b). (e) Cross sections of the patterns in (a) and (b). (f) Cross sections of the images in (c) and (d).
    Fringe distortions induced by intensity diffusion, gamma distortion, high-order harmonics, and image saturation.
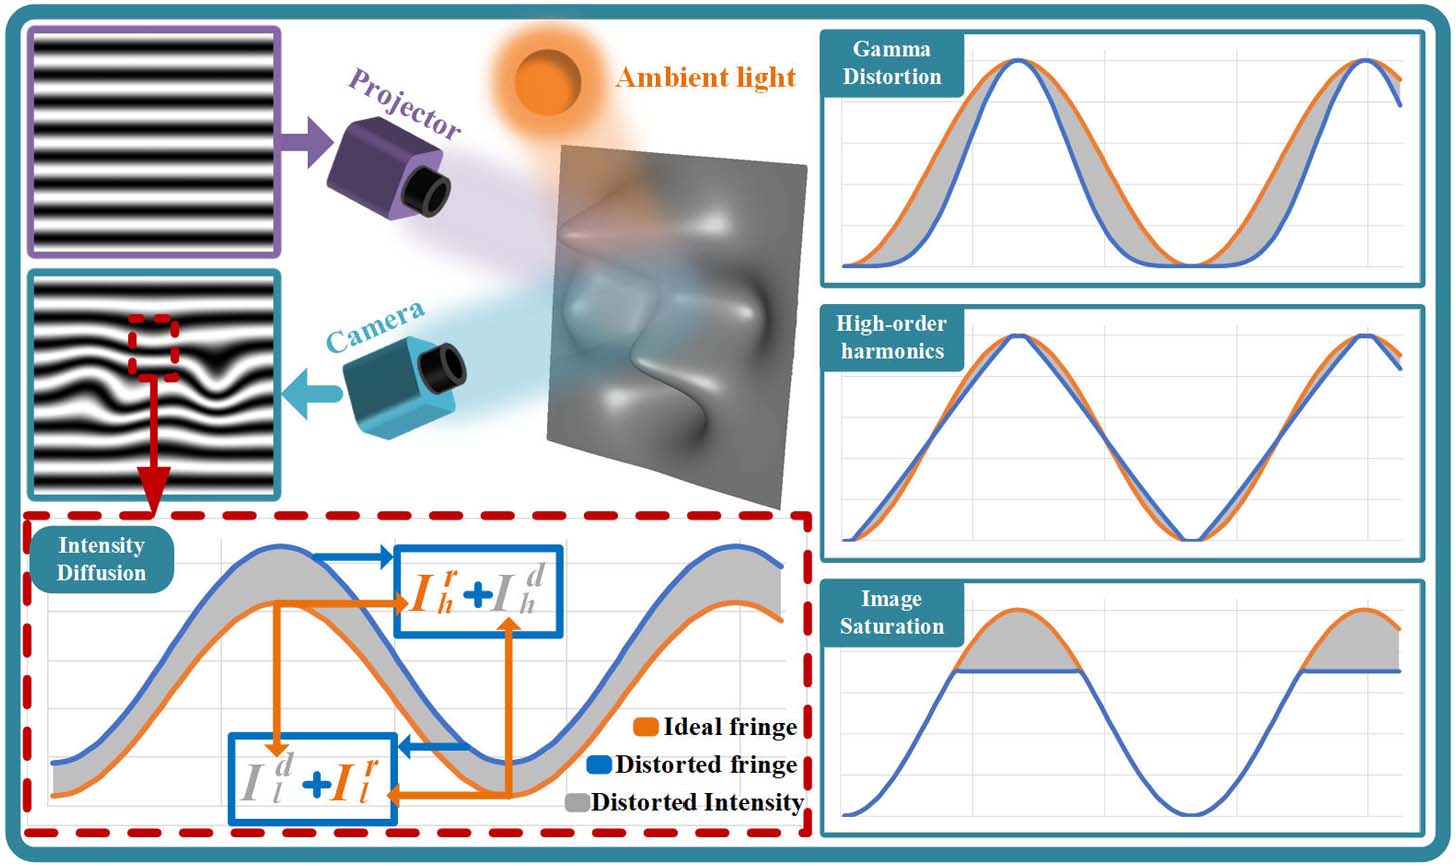
    Fig. 2. Fringe distortions induced by intensity diffusion, gamma distortion, high-order harmonics, and image saturation.
    Illustration of the TPU methods based on additional fringe patterns.
    Fig. 3. Illustration of the TPU methods based on additional fringe patterns.
    Illustration of the parameters in IDM.
    Fig. 4. Illustration of the parameters in IDM.
    Flow chart of the proposed method. (a) Procedures of establishing IDM. (b) Process of IDCA.
    Fig. 5. Flow chart of the proposed method. (a) Procedures of establishing IDM. (b) Process of IDCA.
    Cross sections of the fringes distorted by the intensity diffusion and the corresponding results corrected by IDCA. (a) Fringe with 40% of maximum illumination intensity. (b) Fringe with 50% of maximum illumination intensity. (c) Fringe with 60% of maximum illumination intensity. (d) Fringe with a fringe frequency of 32. (e) Fringe with a fringe frequency of 64. (f) Fringe with a fringe frequency of 128.
    Fig. 6. Cross sections of the fringes distorted by the intensity diffusion and the corresponding results corrected by IDCA. (a) Fringe with 40% of maximum illumination intensity. (b) Fringe with 50% of maximum illumination intensity. (c) Fringe with 60% of maximum illumination intensity. (d) Fringe with a fringe frequency of 32. (e) Fringe with a fringe frequency of 64. (f) Fringe with a fringe frequency of 128.
    3D reconstruction results of the standard plane in the four cases. (a) Normal image of the standard plane. (b) 3D reconstruction result in the case of IDCA[−,−]. (c) 3D reconstruction result in the case of IDCA[−,+]. (d) 3D reconstruction result in the case of IDCA[+,−]. (e) 3D reconstruction result in the case of IDCA[+,+]. (f) Cross sections of the reconstructed planes. (f) The local enlargement of the cross sections.
    Fig. 7. 3D reconstruction results of the standard plane in the four cases. (a) Normal image of the standard plane. (b) 3D reconstruction result in the case of IDCA[,]. (c) 3D reconstruction result in the case of IDCA[,+]. (d) 3D reconstruction result in the case of IDCA[+,]. (e) 3D reconstruction result in the case of IDCA[+,+]. (f) Cross sections of the reconstructed planes. (f) The local enlargement of the cross sections.
    3D reconstruction results of the standard sphere in the four cases. (a) Normal image of the standard sphere. (b) 3D reconstruction result in the case of IDCA[−,−]. (c) 3D reconstruction result in the case of IDCA[−,+]. (d) 3D reconstruction result in the case of IDCA[+,−]. (e) 3D reconstruction result in the case of IDCA[+,+]. (f) Cross sections of the reconstructed 3D profile. (f) The local enlargement of the cross sections.
    Fig. 8. 3D reconstruction results of the standard sphere in the four cases. (a) Normal image of the standard sphere. (b) 3D reconstruction result in the case of IDCA[,]. (c) 3D reconstruction result in the case of IDCA[,+]. (d) 3D reconstruction result in the case of IDCA[+,]. (e) 3D reconstruction result in the case of IDCA[+,+]. (f) Cross sections of the reconstructed 3D profile. (f) The local enlargement of the cross sections.
    3D measurement accuracy for the plane and sphere with different illumination intensities and fringe frequencies. (a) Reciprocals of RMSE with the increasing illumination intensity. (b) Gradient of 1/RMSE with the increasing illumination intensity. (c) Reciprocal of RMSE with the increasing fringe frequency. (d) Gradient of 1/RMSE with the increasing fringe frequency.
    Fig. 9. 3D measurement accuracy for the plane and sphere with different illumination intensities and fringe frequencies. (a) Reciprocals of RMSE with the increasing illumination intensity. (b) Gradient of 1/RMSE with the increasing illumination intensity. (c) Reciprocal of RMSE with the increasing fringe frequency. (d) Gradient of 1/RMSE with the increasing fringe frequency.
    Fringe images in the scenes with high contrast.
    Fig. 10. Fringe images in the scenes with high contrast.
    Unwrapped phase maps of the panda and zebra models. (a)–(d) Unwrapped phase maps of the panda model in the four cases. (e)–(h) Unwrapped phase maps of the zebra model in the four cases.
    Fig. 11. Unwrapped phase maps of the panda and zebra models. (a)–(d) Unwrapped phase maps of the panda model in the four cases. (e)–(h) Unwrapped phase maps of the zebra model in the four cases.
    3D reconstruction results of the steel plate. (a) Normal image of the steel plate. (b) Cross sections of the fringes in the high-reflectivity areas. (c) Image of the steel plate with fringes. (d) 3D reconstruction result in the case of IDCA[−,−]. (e) 3D reconstruction result in the case of IDCA[−,+]. (f) 3D reconstruction result in the case of IDCA[+,−]. (g) 3D reconstruction result in the case of IDCA[+,+].
    Fig. 12. 3D reconstruction results of the steel plate. (a) Normal image of the steel plate. (b) Cross sections of the fringes in the high-reflectivity areas. (c) Image of the steel plate with fringes. (d) 3D reconstruction result in the case of IDCA[,]. (e) 3D reconstruction result in the case of IDCA[,+]. (f) 3D reconstruction result in the case of IDCA[+,]. (g) 3D reconstruction result in the case of IDCA[+,+].
    RMSE (μm) and the Corresponding Reduction Rate
    ObjectFTP+PCUFTP+MFU
    IDCA [−,−]IDCA [−,+]IDCA [+,−]IDCA [+,+]IDCA [−,−]IDCA [−,+]IDCA [+,−]IDCA [+,+]
    Plane138.43127.95123.86117.45128.70121.78116.01111.53
    0.00%7.57%10.52%15.16%0.00%5.38%9.86%13.33%
    Sphere218.94201.31187.74179.16201.33189.59174.96168.01
    0.00%8.05%14.25%18.17%0.00%5.83%13.09%16.55%
    ObjectPSA+PCUPSA+MFU
    IDCA [−,−]IDCA [−,+]IDCA [+,−]IDCA [+,+]IDCA [−,−]IDCA [−,+]IDCA [+,−]IDCA [+,+]
    Plane40.2137.5536.3734.9338.1836.0135.0333.48
    0.00%6.64%9.55%13.14%0.00%5.67%8.25%12.32%
    Sphere60.1556.2253.9751.3856.1253.3850.7948.46
    0.00%6.52%10.26%14.57%0.00%4.88%9.49%13.66%
    Table 1. Accuracies of the 3D Measurement Results in Four Combinations
    Fringe FrequencyPlaneSphere
    RMSE (μm)Reduction RateRMSE (μm)Reduction Rate
    IDCA[−,−]IDCA[+,+]IDCA[−,−]IDCA[+,+]
    f=3242.0036.5912.87%63.4654.7813.68%
    f=4040.7136.7712.63%60.4452.3813.34%
    f=4839.4634.5512.45%58.1250.4913.12%
    f=5638.1833.4812.32%56.1248.4613.66%
    f=6436.9432.2412.72%53.6446.0714.11%
    f=7234.6230.0313.27%49.1141.8514.79%
    f=8031.6027.3413.49%47.4440.1615.35%
    Table 2. Accuracy Improvement with Different Fringe Frequencies
    Number of IterationsRMSE (μm)
    PSA+PCUPSA+MFU
    035.8734.14
    135.3933.82
    235.1033.67
    334.9333.48
    434.8333.55
    534.8433.52
    Table 3. Number of Iterations in the IDCA and the Corresponding RMSEs
    Zheng Sun, Minghui Duan, Yabing Zheng, Yi Jin, Xin Fan, Jinjin Zheng. Intensity diffusion: a concealed cause of fringe distortion in fringe projection profilometry[J]. Photonics Research, 2022, 10(5): 1210
    Download Citation