
Jianyang Shi, Zengyi Xu, Wenqing Niu, Dong Li, Xiaoming Wu, Ziwei Li, Junwen Zhang, Chao Shen, Guangxu Wang, Xiaolan Wang, Jianli Zhang, Fengyi Jiang, Shaohua Yu, Nan Chi, "Si-substrate vertical-structure InGaN/GaN micro-LED-based photodetector for beyond 10 Gbps visible light communication," Photonics Res. 10, 2394 (2022)
- Photonics Research
- Vol. 10, Issue 10, 2394 (2022)
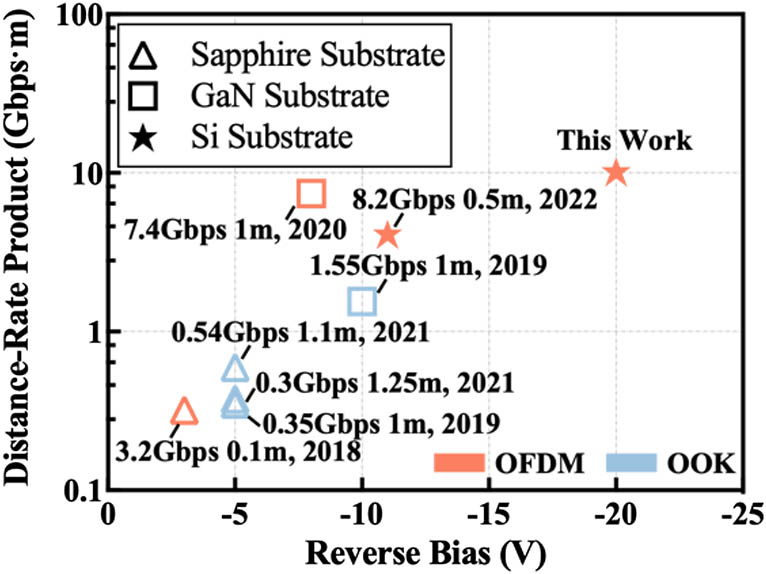
Fig. 1. Benchmark of distance-rate product versus reverse bias voltage for micro-LED-based photodetectors.
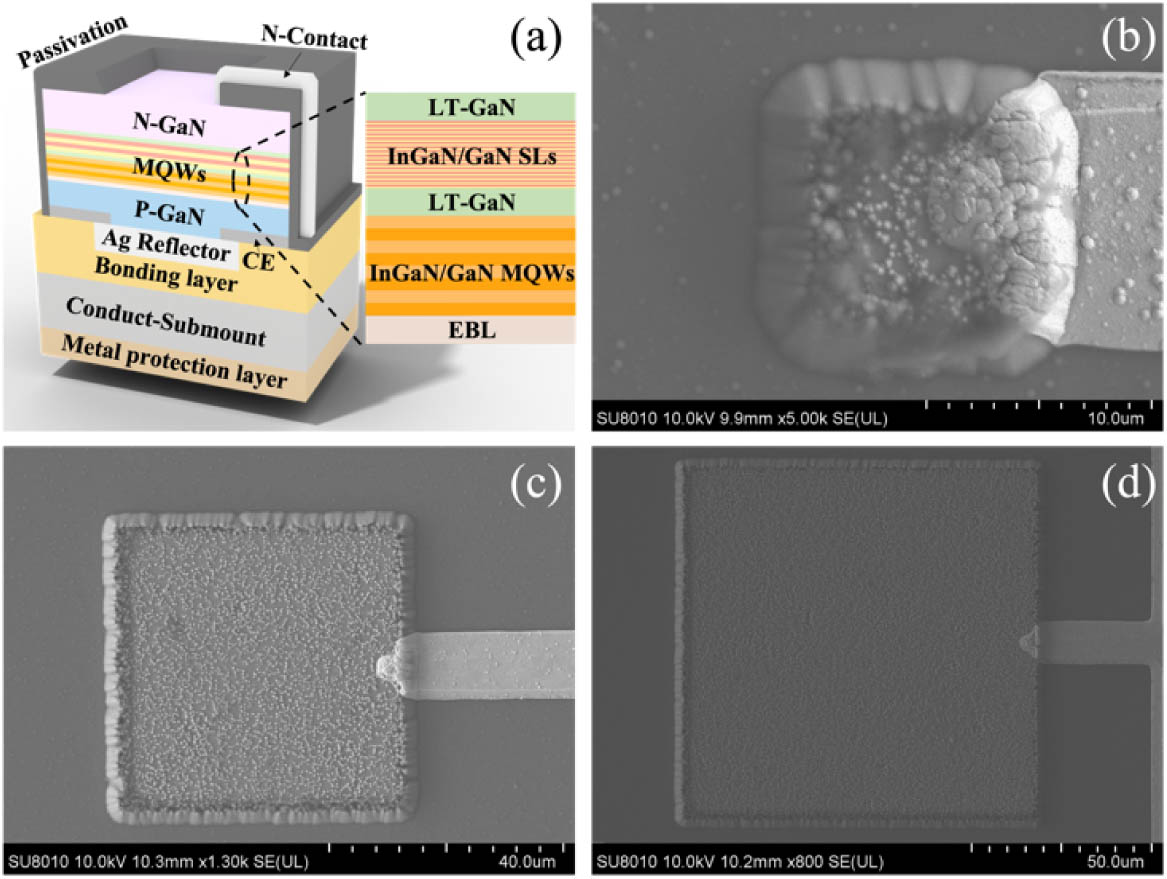
Fig. 2. (a) Schematic of the vertical structure of Si-substrate micro-LED-based photodetector; SEM images of (b) 10 μm, (c) 50 μm, and (d) 100 μm chips.
Fig. 3. (a) Schematic of layout for 4 × 4
Fig. 4. Responsivity spectra of (a) 10 μm, (b) 50 μm, and (c) 100 μm micro-LED-based photodetectors; electroluminescence spectra of (d) 10 μm, (e) 50 μm, and (f) 100 μm micro-LEDs.
Fig. 5. Current–voltage (I - V − 20 V
Fig. 6. Experimental setup of VLC system utilizing micro-LED-based photodetector.
Fig. 7. Measured forward transmission gains of (a) 10 μm, (b) 50 μm, and (c) 100 μm micro-LED-based photodetectors; (d) 10 and 20 dB bandwidths versus reverse bias.
Fig. 8. SNR versus reverse bias for (a) 10 μm, (b) 50 μm, and (c) 100 μm micro-LED-based photodetectors.
Fig. 9. Data rate versus bias current and signal Vpp for (a) 10 μm, (b) 50 μm, and (c) 100 μm micro-LED-based photodetectors.
Fig. 10. (a) Data rate versus reverse bias; (b) data rate versus incident light power for 10, 50, and 100 μm micro-LED-based photodetectors.
Fig. 11. Measured electrical spectra for (a) 10 μm, (b) 50 μm, and (c) 100 μm micro-LED-based photodetectors; maximum data rate and BER versus baudrate at 0.5 m for (d) 10 μm, (e) 50 μm, and (f) 100 μm micro-LED-based photodetectors.
Fig. 12. Data rate and BER versus transmission distance for 50 μm micro-LED-based photodetector.
Fig. 13. SNR and bit number versus frequency at 1.9 Gbaud for (a) 0.5 m and (b) 1 m transmission distance; power ratio versus frequency for (c) 0.5 m and (d) 1 m.
| ||||||||||||||||||||||||
Table 1. Capacitance versus Voltage of Micro-LED-Based Photodetectors
|
Table 2. Recent Achievements of Micro-LED-Based Photodetectors


Set citation alerts for the article
Please enter your email address

© Copyright 2018-2021 | Chinese Laser Press. All Rights Reserved 沪ICP备15018463号-20