
Md. Omar Faruque, Rabiul Al Mahmud, Rakibul Hasan Sagor. Heavily doped silicon: A potential replacement of conventional plasmonic metals[J]. Journal of Semiconductors, 2021, 42(6): 062302
- Journal of Semiconductors
- Vol. 42, Issue 6, 062302 (2021)
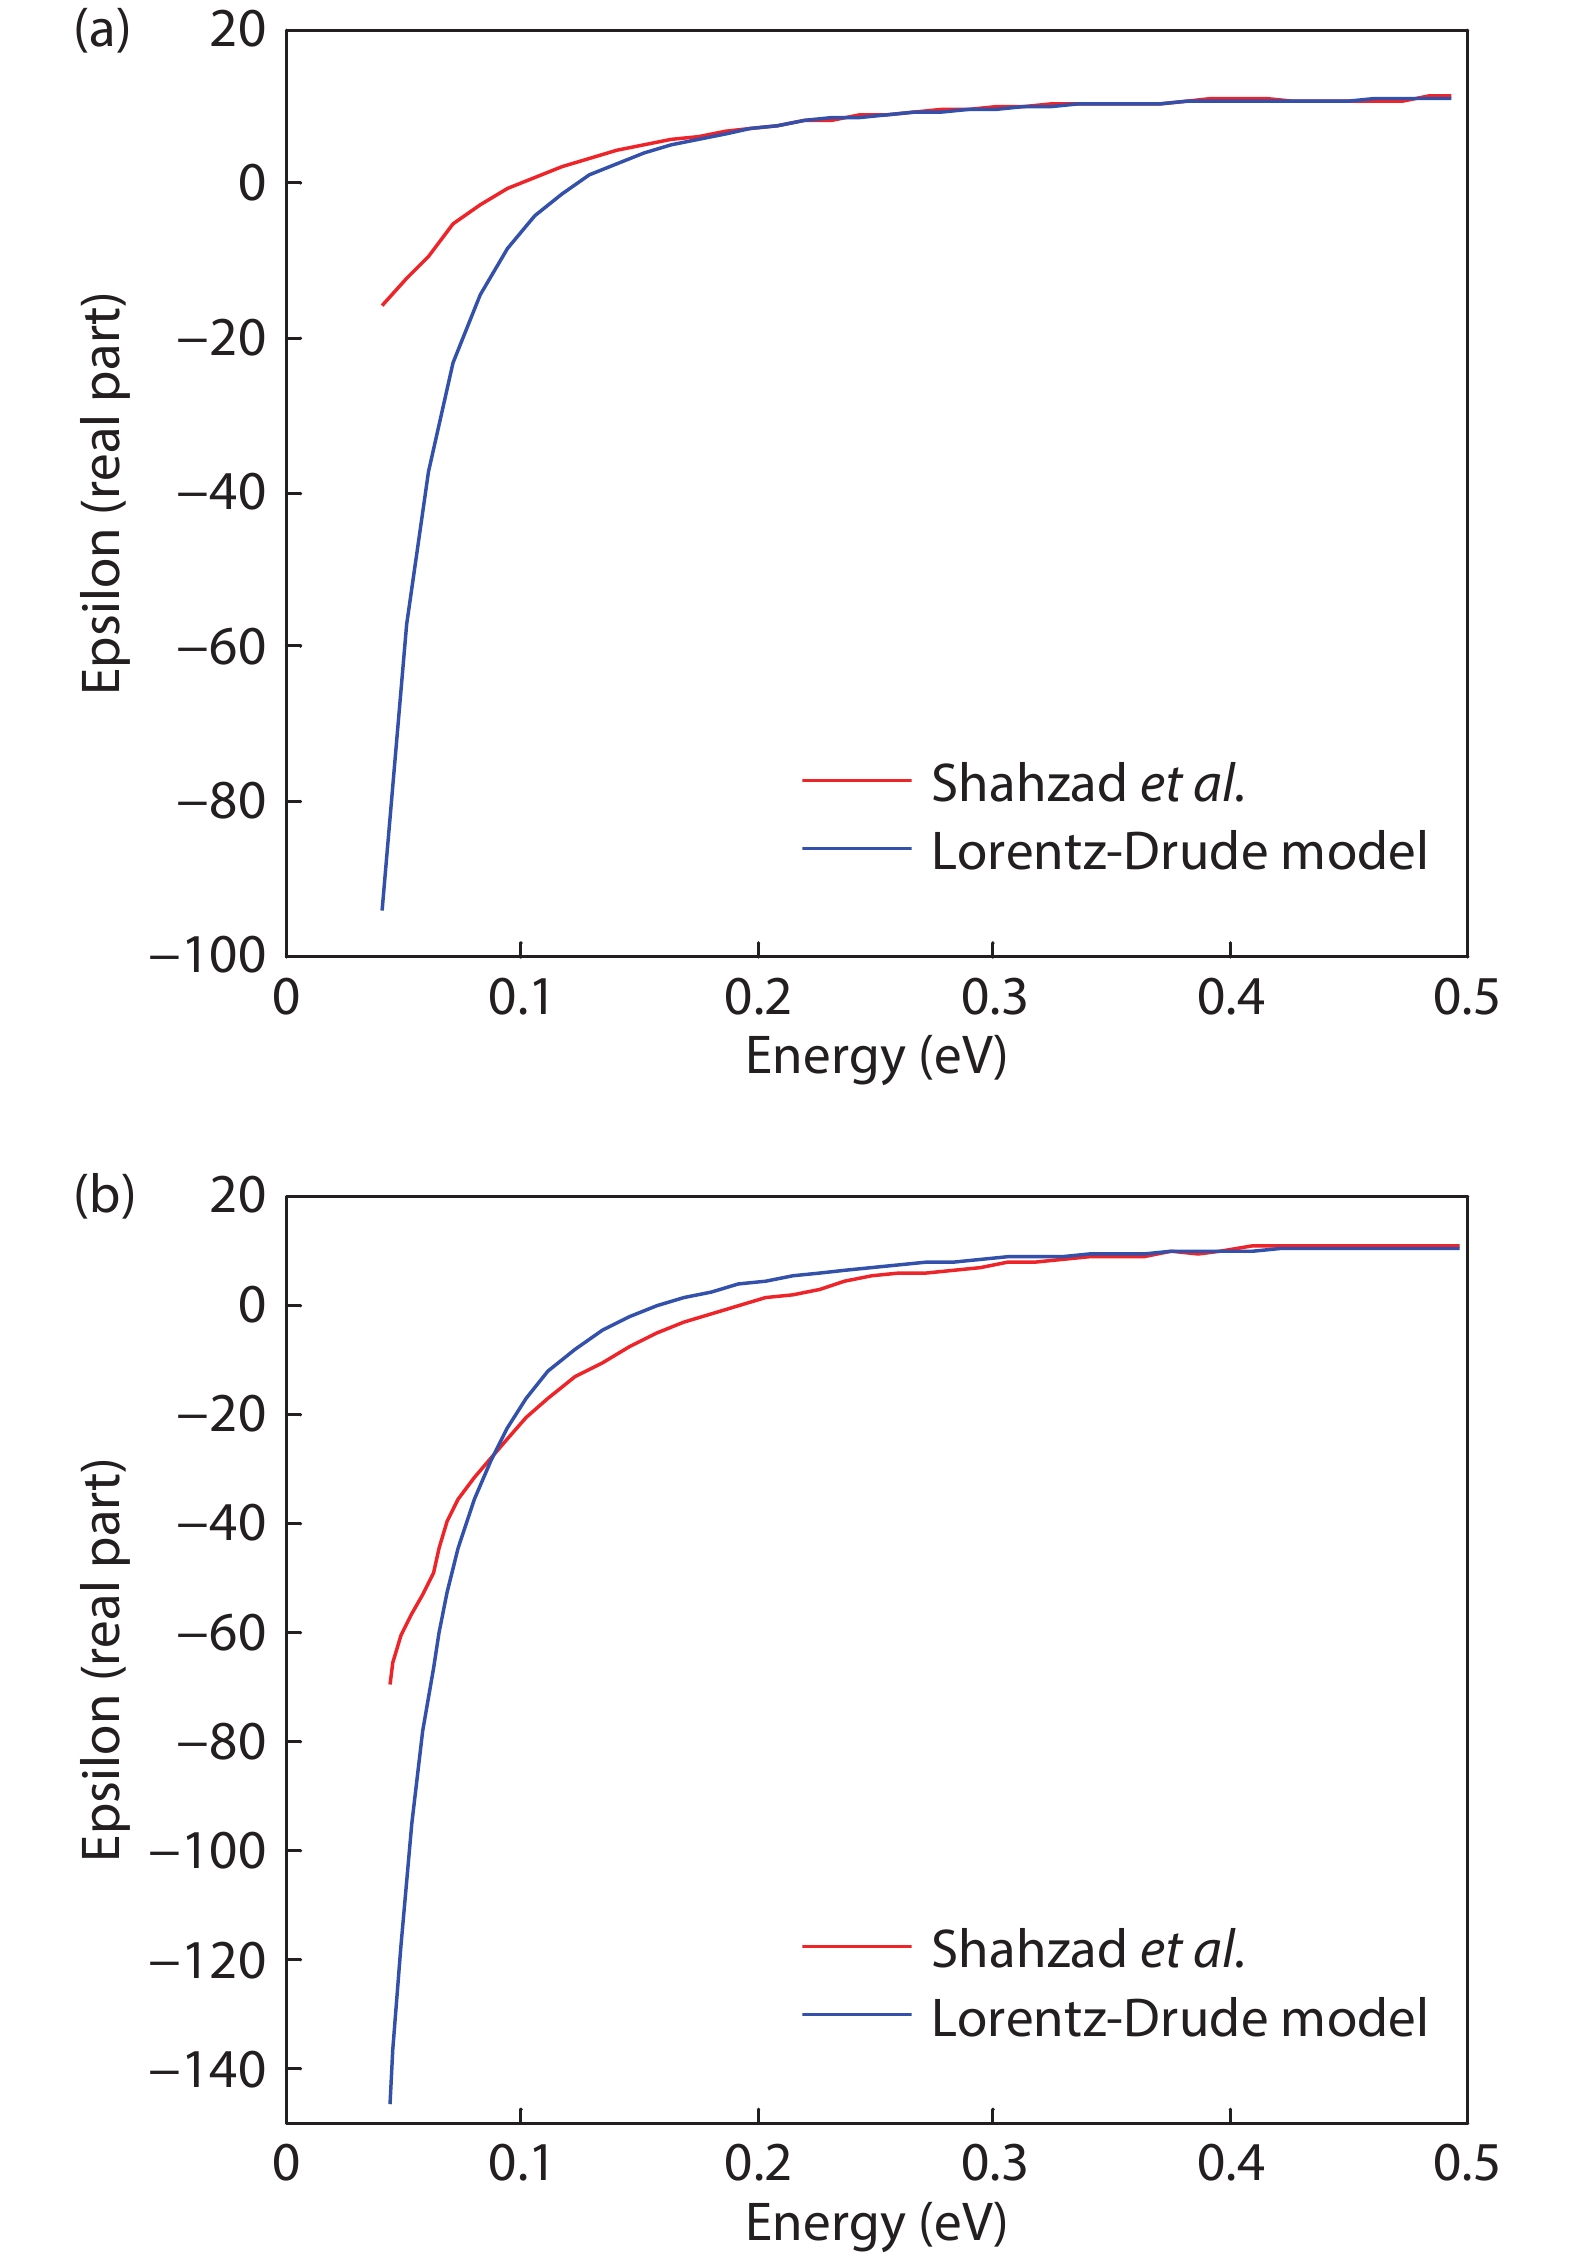
Fig. 1. (Color online) Comparison between theoretical value and experimental value for carrier concentration of (a) 6 × 1019 cm–3 and (b) 1 × 1020 cm–3.
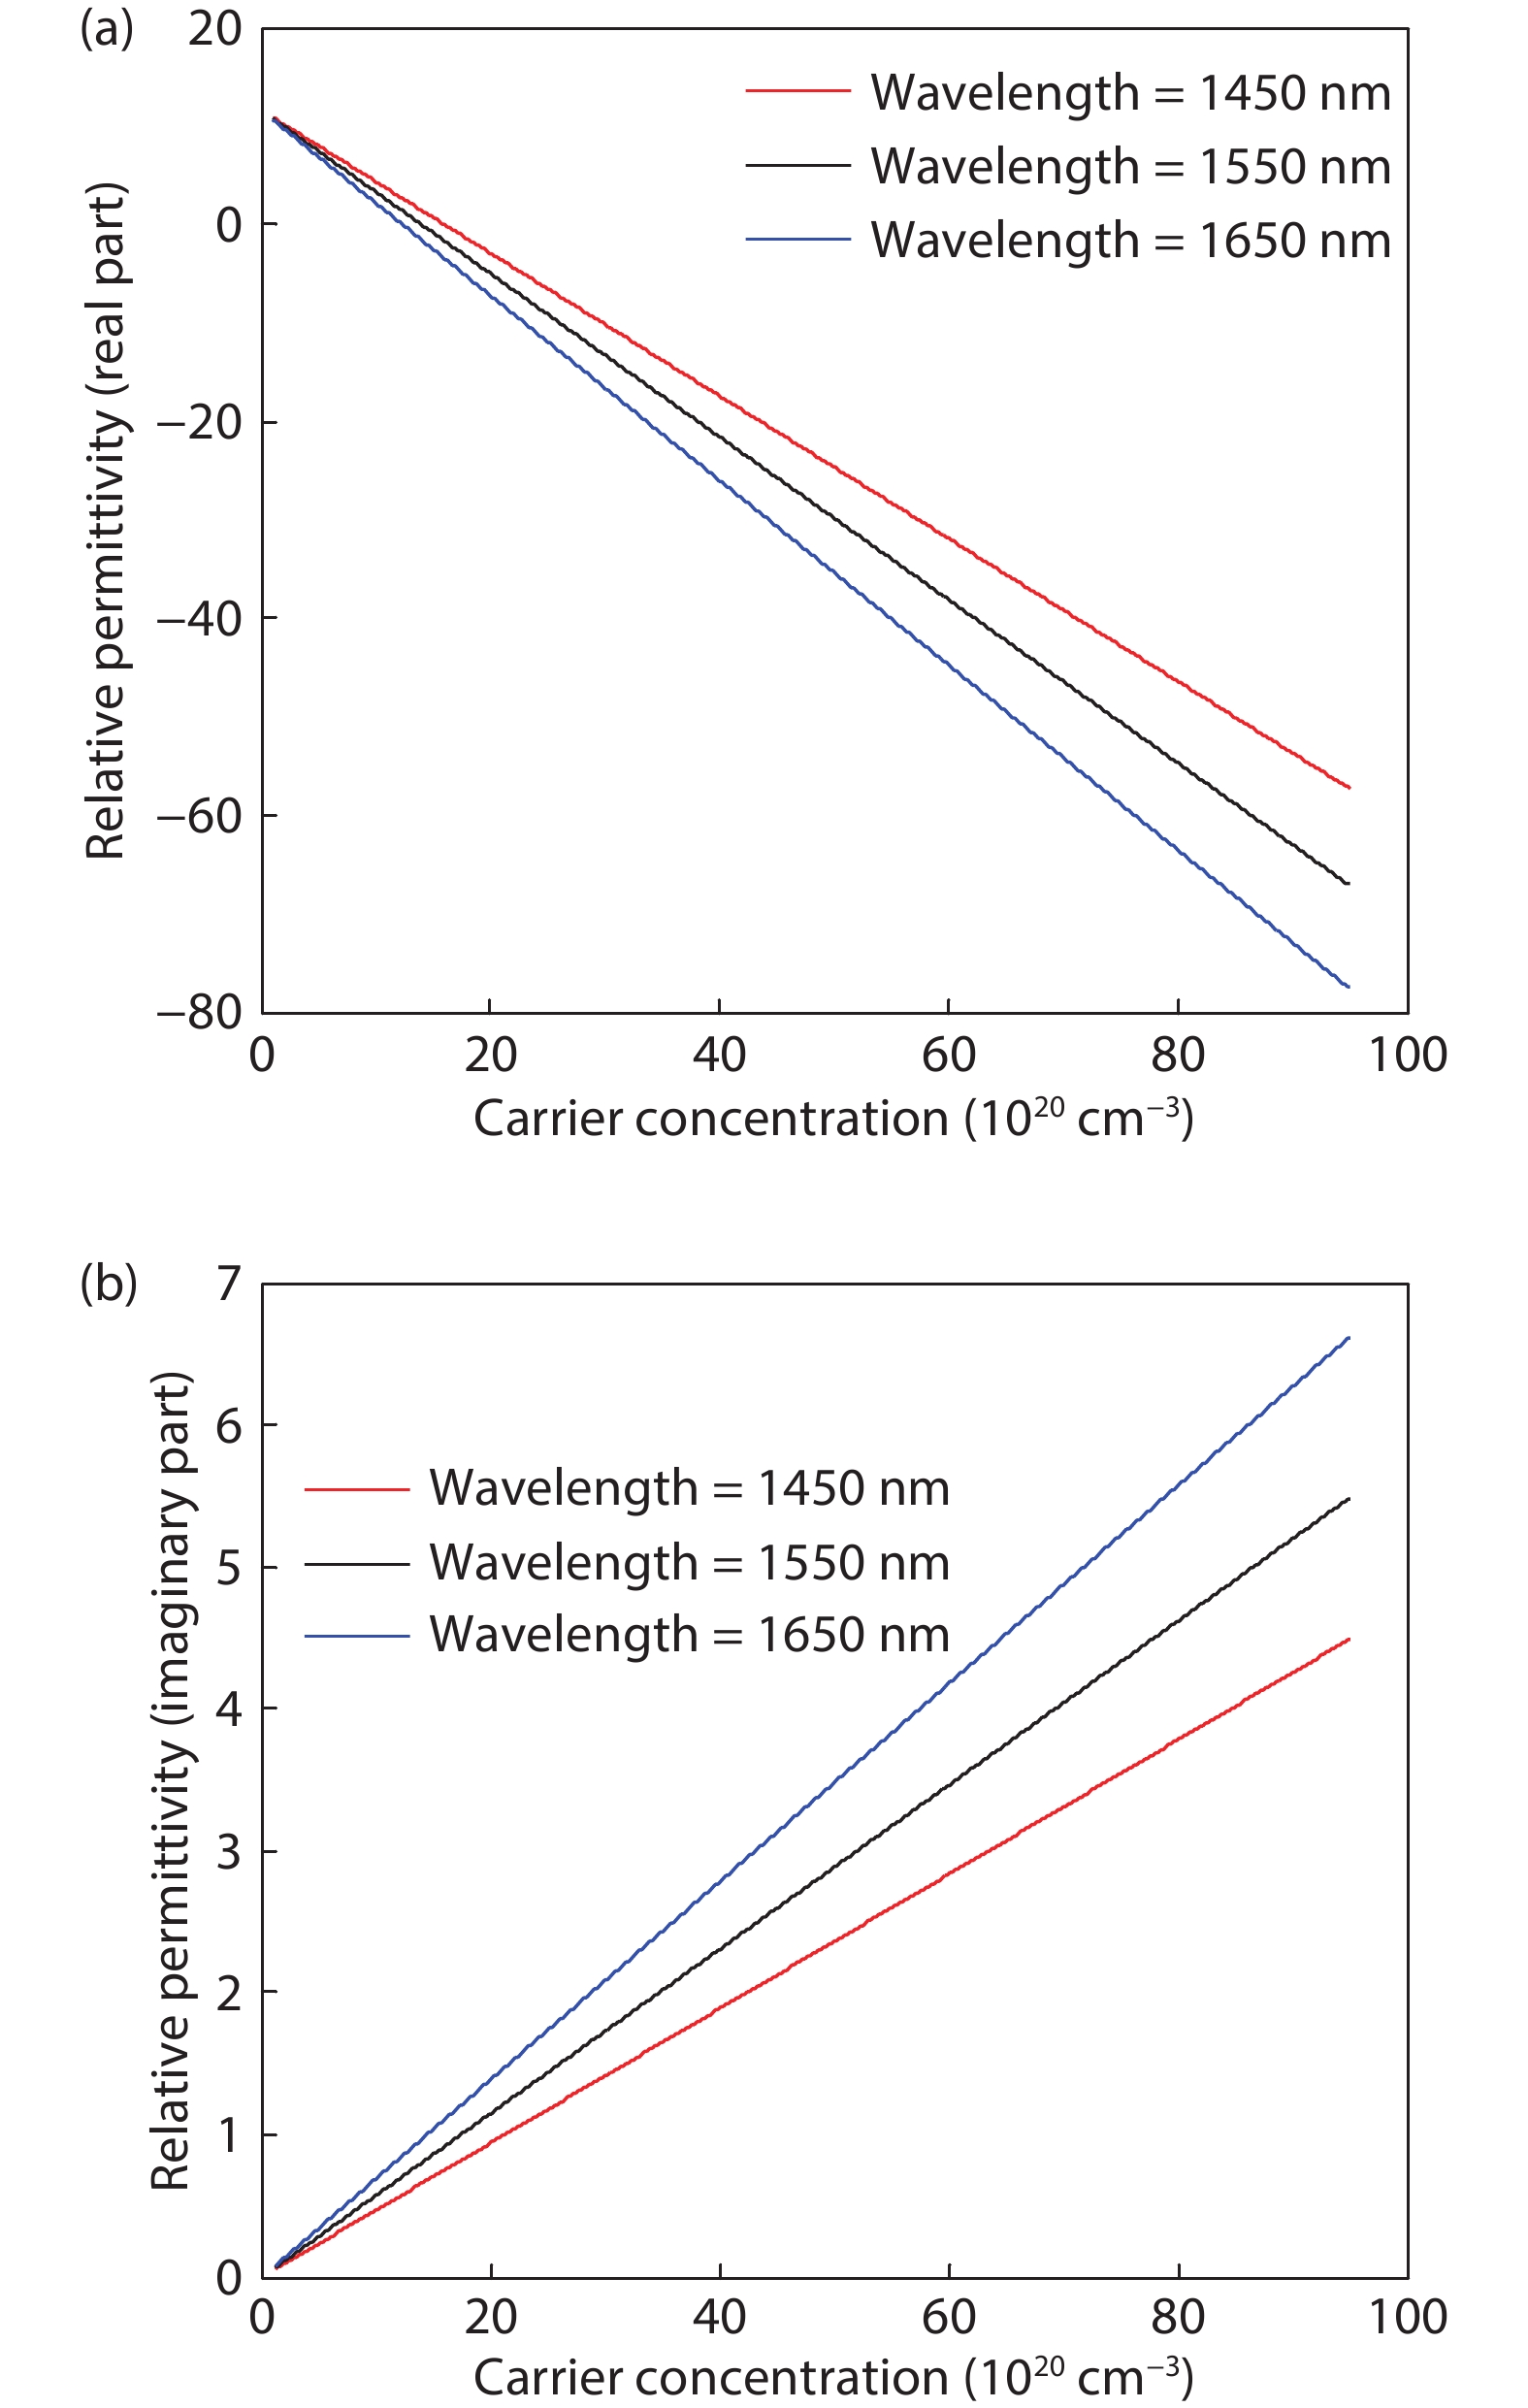
Fig. 2. (Color online) Relative permittivity (a) real part and (b) imaginary part versus carrier concentration at different wavelength.
Fig. 3. (Color online) Real part of relative permittivity for silver, gold and, p-silicon for different values of carrier concentration of p-silicon.
Fig. 4. (Color online) Imaginary part of relative permittivity for silver and gold, and p-silicon for different values of carrier concentration.
Fig. 5. (Color online) Propagation of SPP along the silicon–air–silicon waveguide.
Fig. 6. (Color online) Comparison of the transmittance between (a) the silver and p-silicon waveguide and (b) the gold and p-silicon waveguide.
Fig. 7. (Color online) Notch type transmission response shown by ring resonators using gold, silver and psilicon.
Fig. 8. (Color online) Sensing characteristics shown by ring resonators formed with heavily doped silicon.
|
Table 1. Modelling parameters of heavily doped p-silicon by the Lorentz-Drude model.
| |||||||||||||||||||||||||||||||||||||||||||||||
Table 2. Comparison of relative permittivity of p-silicon between the theoretical value and the experimental value for a carrier concentration of 6 × 1019 cm–3.
| |||||||||||||||||||||||||||||||||||||||||||||||
Table 3. Comparison of relative permittivity of p-silicon between the theoretical value and the experimental value for a carrier concentration of 1 × 1020 cm–3.
|
Table 4. Modelling parameters of gold and silver by the Drude and Lorentz-Drude model.

Set citation alerts for the article
Please enter your email address
© Copyright 2018-2021 | Chinese Laser Press. All Rights Reserved 沪ICP备15018463号-20