• Photonics Research
  • Vol. 7, Issue 7, B36 (2019)
Jan Ruschel1、*, Johannes Glaab1, Batoul Beidoun1, Neysha Lobo Ploch1, Jens Rass1, Tim Kolbe1, Arne Knauer1, Markus Weyers1, Sven Einfeldt1, and Michael Kneissl1、2
Author Affiliations
  • 1Ferdinand-Braun-Institut, Leibniz-Institut für Höchstfrequenztechnik, Gustav-Kirchhoff-Str. 4, 12489 Berlin, Germany
  • 2Technische Universität Berlin, Institut für Festkörperphysik, Hardenbergstr. 36, EW 6-1, 10623 Berlin, Germany
  • show less
    DOI: 10.1364/PRJ.7.000B36 Cite this Article Set citation alerts
    Jan Ruschel, Johannes Glaab, Batoul Beidoun, Neysha Lobo Ploch, Jens Rass, Tim Kolbe, Arne Knauer, Markus Weyers, Sven Einfeldt, Michael Kneissl. Current-induced degradation and lifetime prediction of 310  nm ultraviolet light-emitting diodes[J]. Photonics Research, 2019, 7(7): B36 Copy Citation Text show less
    Representative emission spectra of the investigated 310 nm UV LEDs normalized to the emission peak. The spectra were measured at 100 mA at a heat sink temperature of 25°C before aging and after aging experiment 3 (Table 1).
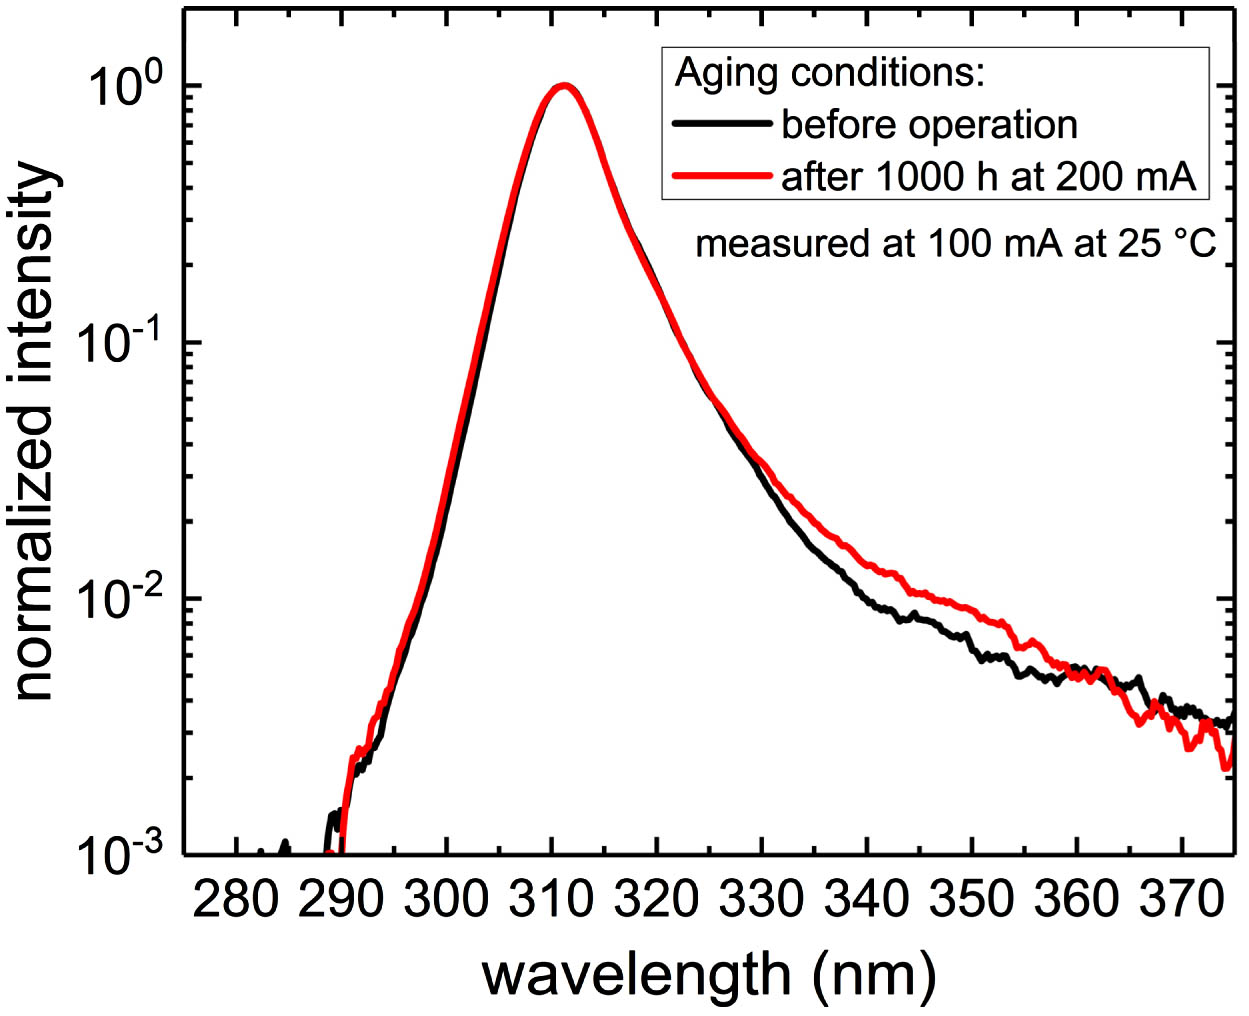
    Fig. 1. Representative emission spectra of the investigated 310 nm UV LEDs normalized to the emission peak. The spectra were measured at 100 mA at a heat sink temperature of 25°C before aging and after aging experiment 3 (Table 1).
    Optical power over time of LEDs run at different current densities. The values are normalized to the initial value and averaged over 15 LEDs. For all currents, the junction temperature was kept at (90±5)°C.
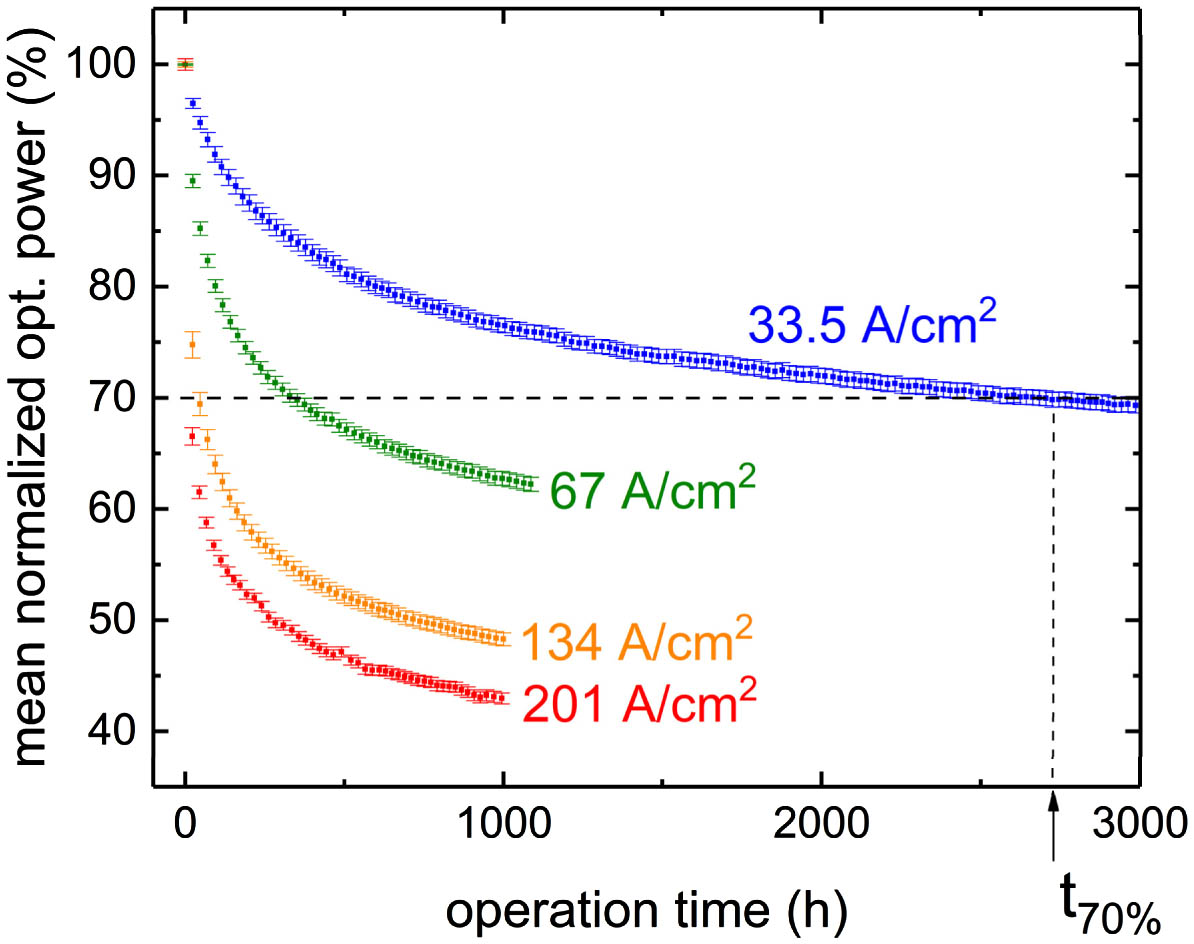
    Fig. 2. Optical power over time of LEDs run at different current densities. The values are normalized to the initial value and averaged over 15 LEDs. For all currents, the junction temperature was kept at (90±5)°C.
    Operation time at which the optical power has reduced to 70% (t70%) of the initial value versus current density.
    Fig. 3. Operation time at which the optical power has reduced to 70% (t70%) of the initial value versus current density.
    Mean normalized optical power of the LEDs versus the product of the operation time and the cube of the current density.
    Fig. 4. Mean normalized optical power of the LEDs versus the product of the operation time and the cube of the current density.
    Mean normalized optical power (see Fig. 2) versus logarithmic time scale. For different current densities, the characteristic times τ are indicated. Also shown are the logarithmic functions (dashed lines) from Eq. (2) and the extended logarithmic function (solid line) from Eq. (4).
    Fig. 5. Mean normalized optical power (see Fig. 2) versus logarithmic time scale. For different current densities, the characteristic times τ are indicated. Also shown are the logarithmic functions (dashed lines) from Eq. (2) and the extended logarithmic function (solid line) from Eq. (4).
    ExperimentCurrentNom. Current DensityHeat Sink Temp.Operation Time
    No.(mA)(A/cm2)(°C)(h)
    15033.575±14300
    210067.071±11000
    320013441±11000
    430020114±11000
    Table 1. Experimental Conditions Applied to the Investigated 310 nm UV LEDs
    Jan Ruschel, Johannes Glaab, Batoul Beidoun, Neysha Lobo Ploch, Jens Rass, Tim Kolbe, Arne Knauer, Markus Weyers, Sven Einfeldt, Michael Kneissl. Current-induced degradation and lifetime prediction of 310  nm ultraviolet light-emitting diodes[J]. Photonics Research, 2019, 7(7): B36
    Download Citation