
Limei Qi, Chang Liu, "Complex band structures of 1D anisotropic graphene photonic crystal," Photonics Res. 5, 543 (2017)
- Photonics Research
- Vol. 5, Issue 6, 543 (2017)
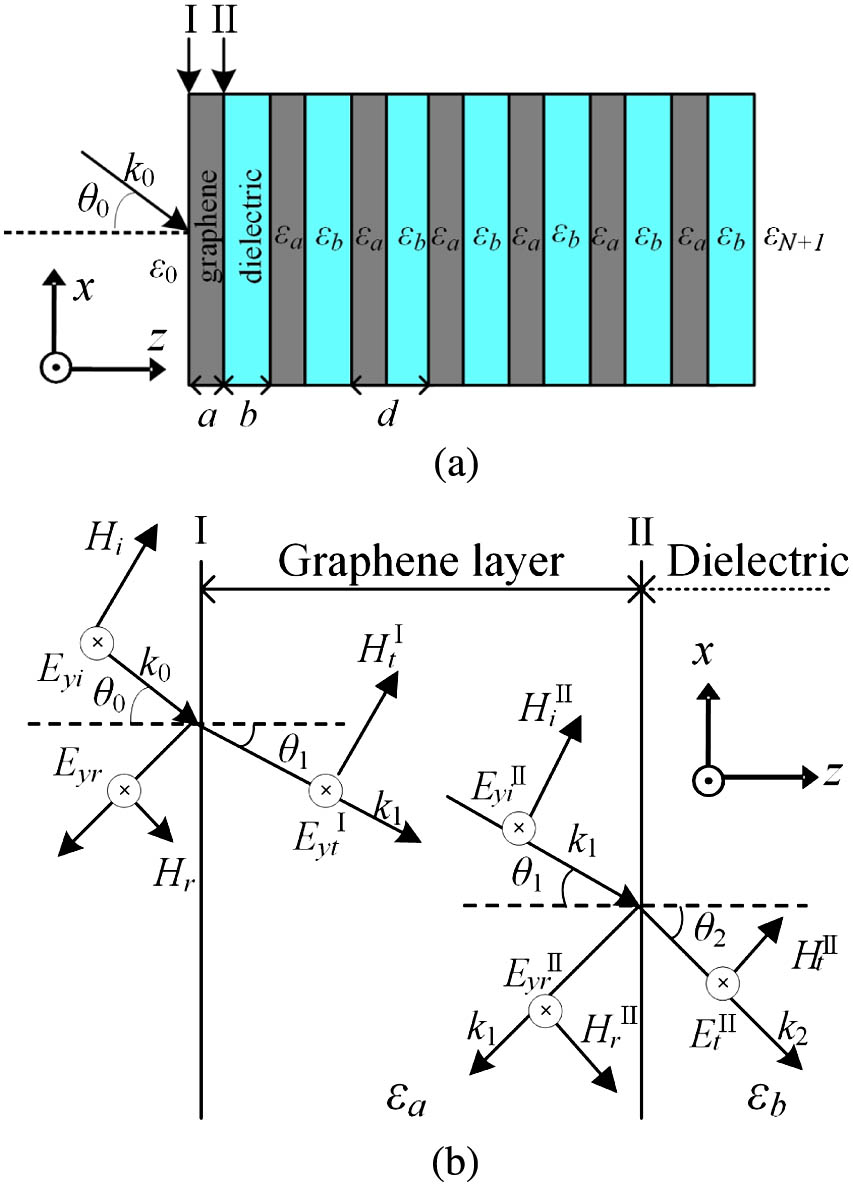
Fig. 1. (a) Schematic view of oblique wave in 1D GPC. (b) Field distribution of TE polarization in the graphene layer.

Fig. 2. Dispersion relation of the 1D GPC at normal incidence. (a) Real part. (b) Imaginary part.
Fig. 3. Transmission, reflection, and absorption curves using the TMM (solid line) and CST simulation (dotted line). Insert shows the simulation model with N = 20
Fig. 4. Dispersion curves of TM and TE polarization using EMT method (solid line) and dispersion equation. (a) Real part. (b) Imaginary part.
Fig. 5. Color map of (a) transmission, (b) absorption, and (c) the difference of reflection and absorption versus frequencies and incident angles for TM and TE polarizations.
Fig. 6. Dispersion relation for chemical potential μ c = 0.1
Fig. 7. Transmission and absorption curves for chemical potential μ c = 0.1
Fig. 8. Color map of (a) transmission and (b) absorption for different μ c = 0.1 – 1.0 eV
Fig. 9. Influence of the chemical potential on real and imaginary part of (a) graphene tangential permittivity and (b) effective dielectric constant of the multilayer for normal incidence.


Set citation alerts for the article
Please enter your email address

© Copyright 2018-2021 | Chinese Laser Press. All Rights Reserved 沪ICP备15018463号-20