• Journal of Semiconductors
  • Vol. 41, Issue 12, 122103 (2020)
Yongkang Xu1、2, Sannian Song1, Wencheng Fang1、2, Chengxing Li1、2, and Zhitang Song1
Author Affiliations
  • 1State Key Laboratory of Functional Materials for Informatics, Shanghai Institute of Microsystem and Information Technology, Chinese Academy of Sciences, Shanghai 200050, China
  • 2University of Chinese Academy of Sciences, Beijing 100049, China
  • show less
    DOI: 10.1088/1674-4926/41/12/122103 Cite this Article
    Yongkang Xu, Sannian Song, Wencheng Fang, Chengxing Li, Zhitang Song. The etching process and mechanism analysis of Ta-Sb2Te3 film based on inductively coupled plasma[J]. Journal of Semiconductors, 2020, 41(12): 122103 Copy Citation Text show less
    Effect of gas composition on etching rate and surface roughness.
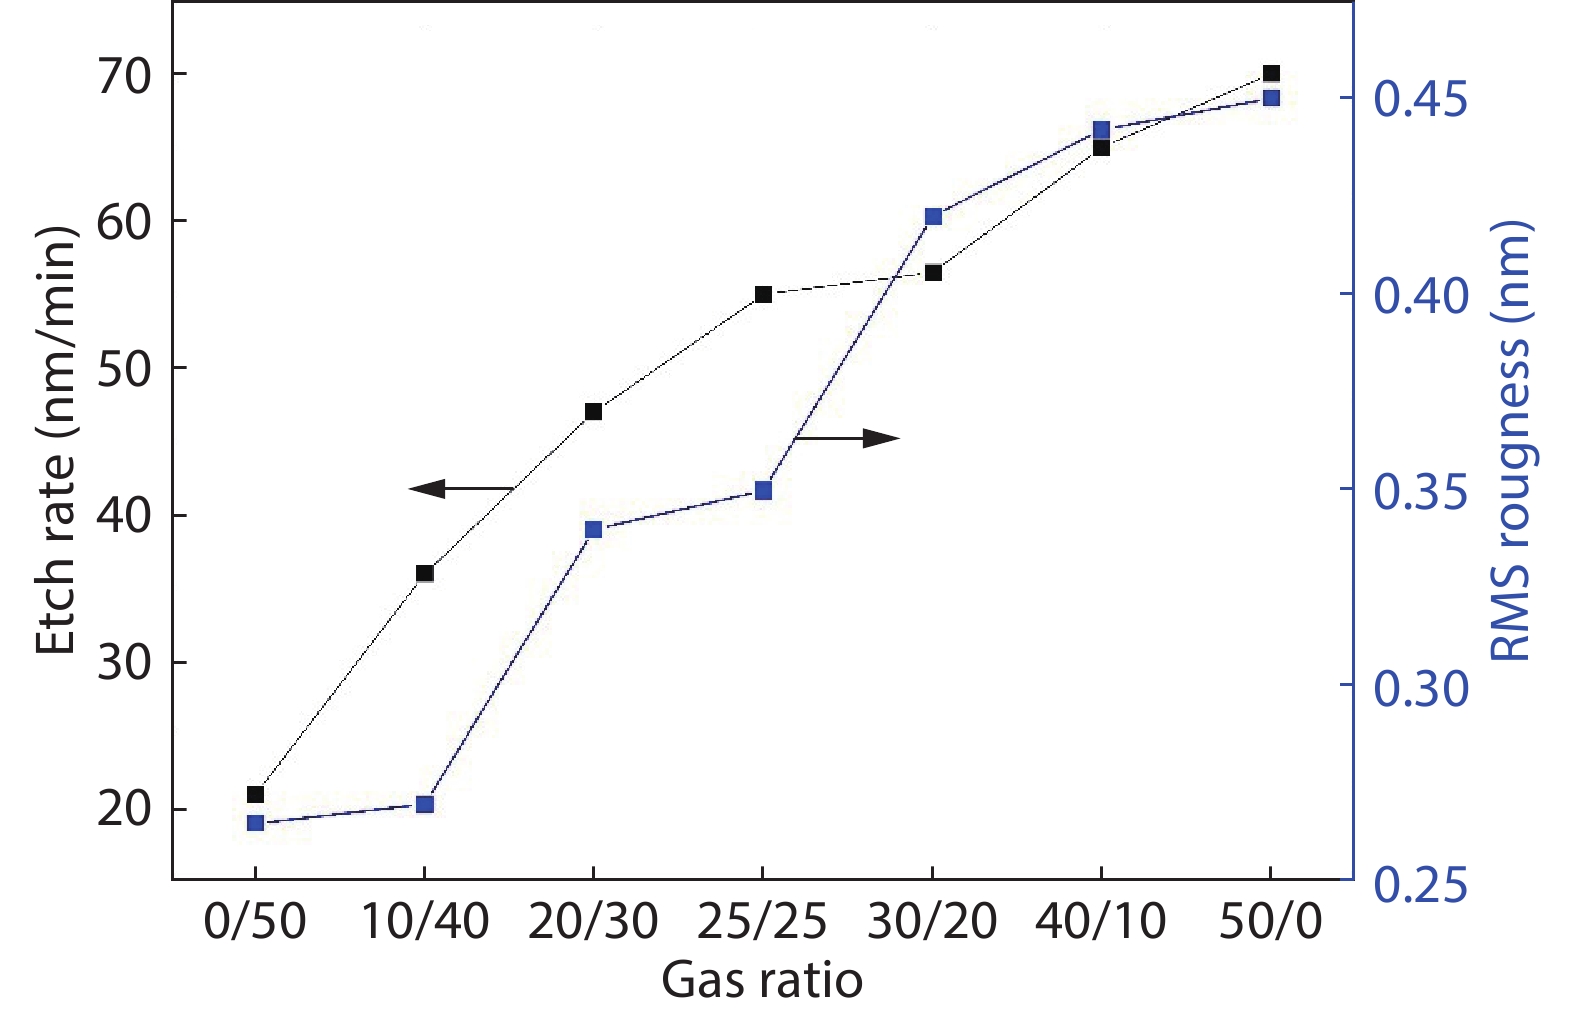
    Fig. 1. Effect of gas composition on etching rate and surface roughness.
    (Color online) AFM images of Ta-Sb2Te3 surface (a) CF4/Ar = 10/40, RMS = 0.27, (b) CF4/Ar = 20/30, RMS = 0.34, (c) CF4/Ar = 25/25, RMS = 0.35, (d) CF4/Ar = 30/20 and RMS = 0.42.
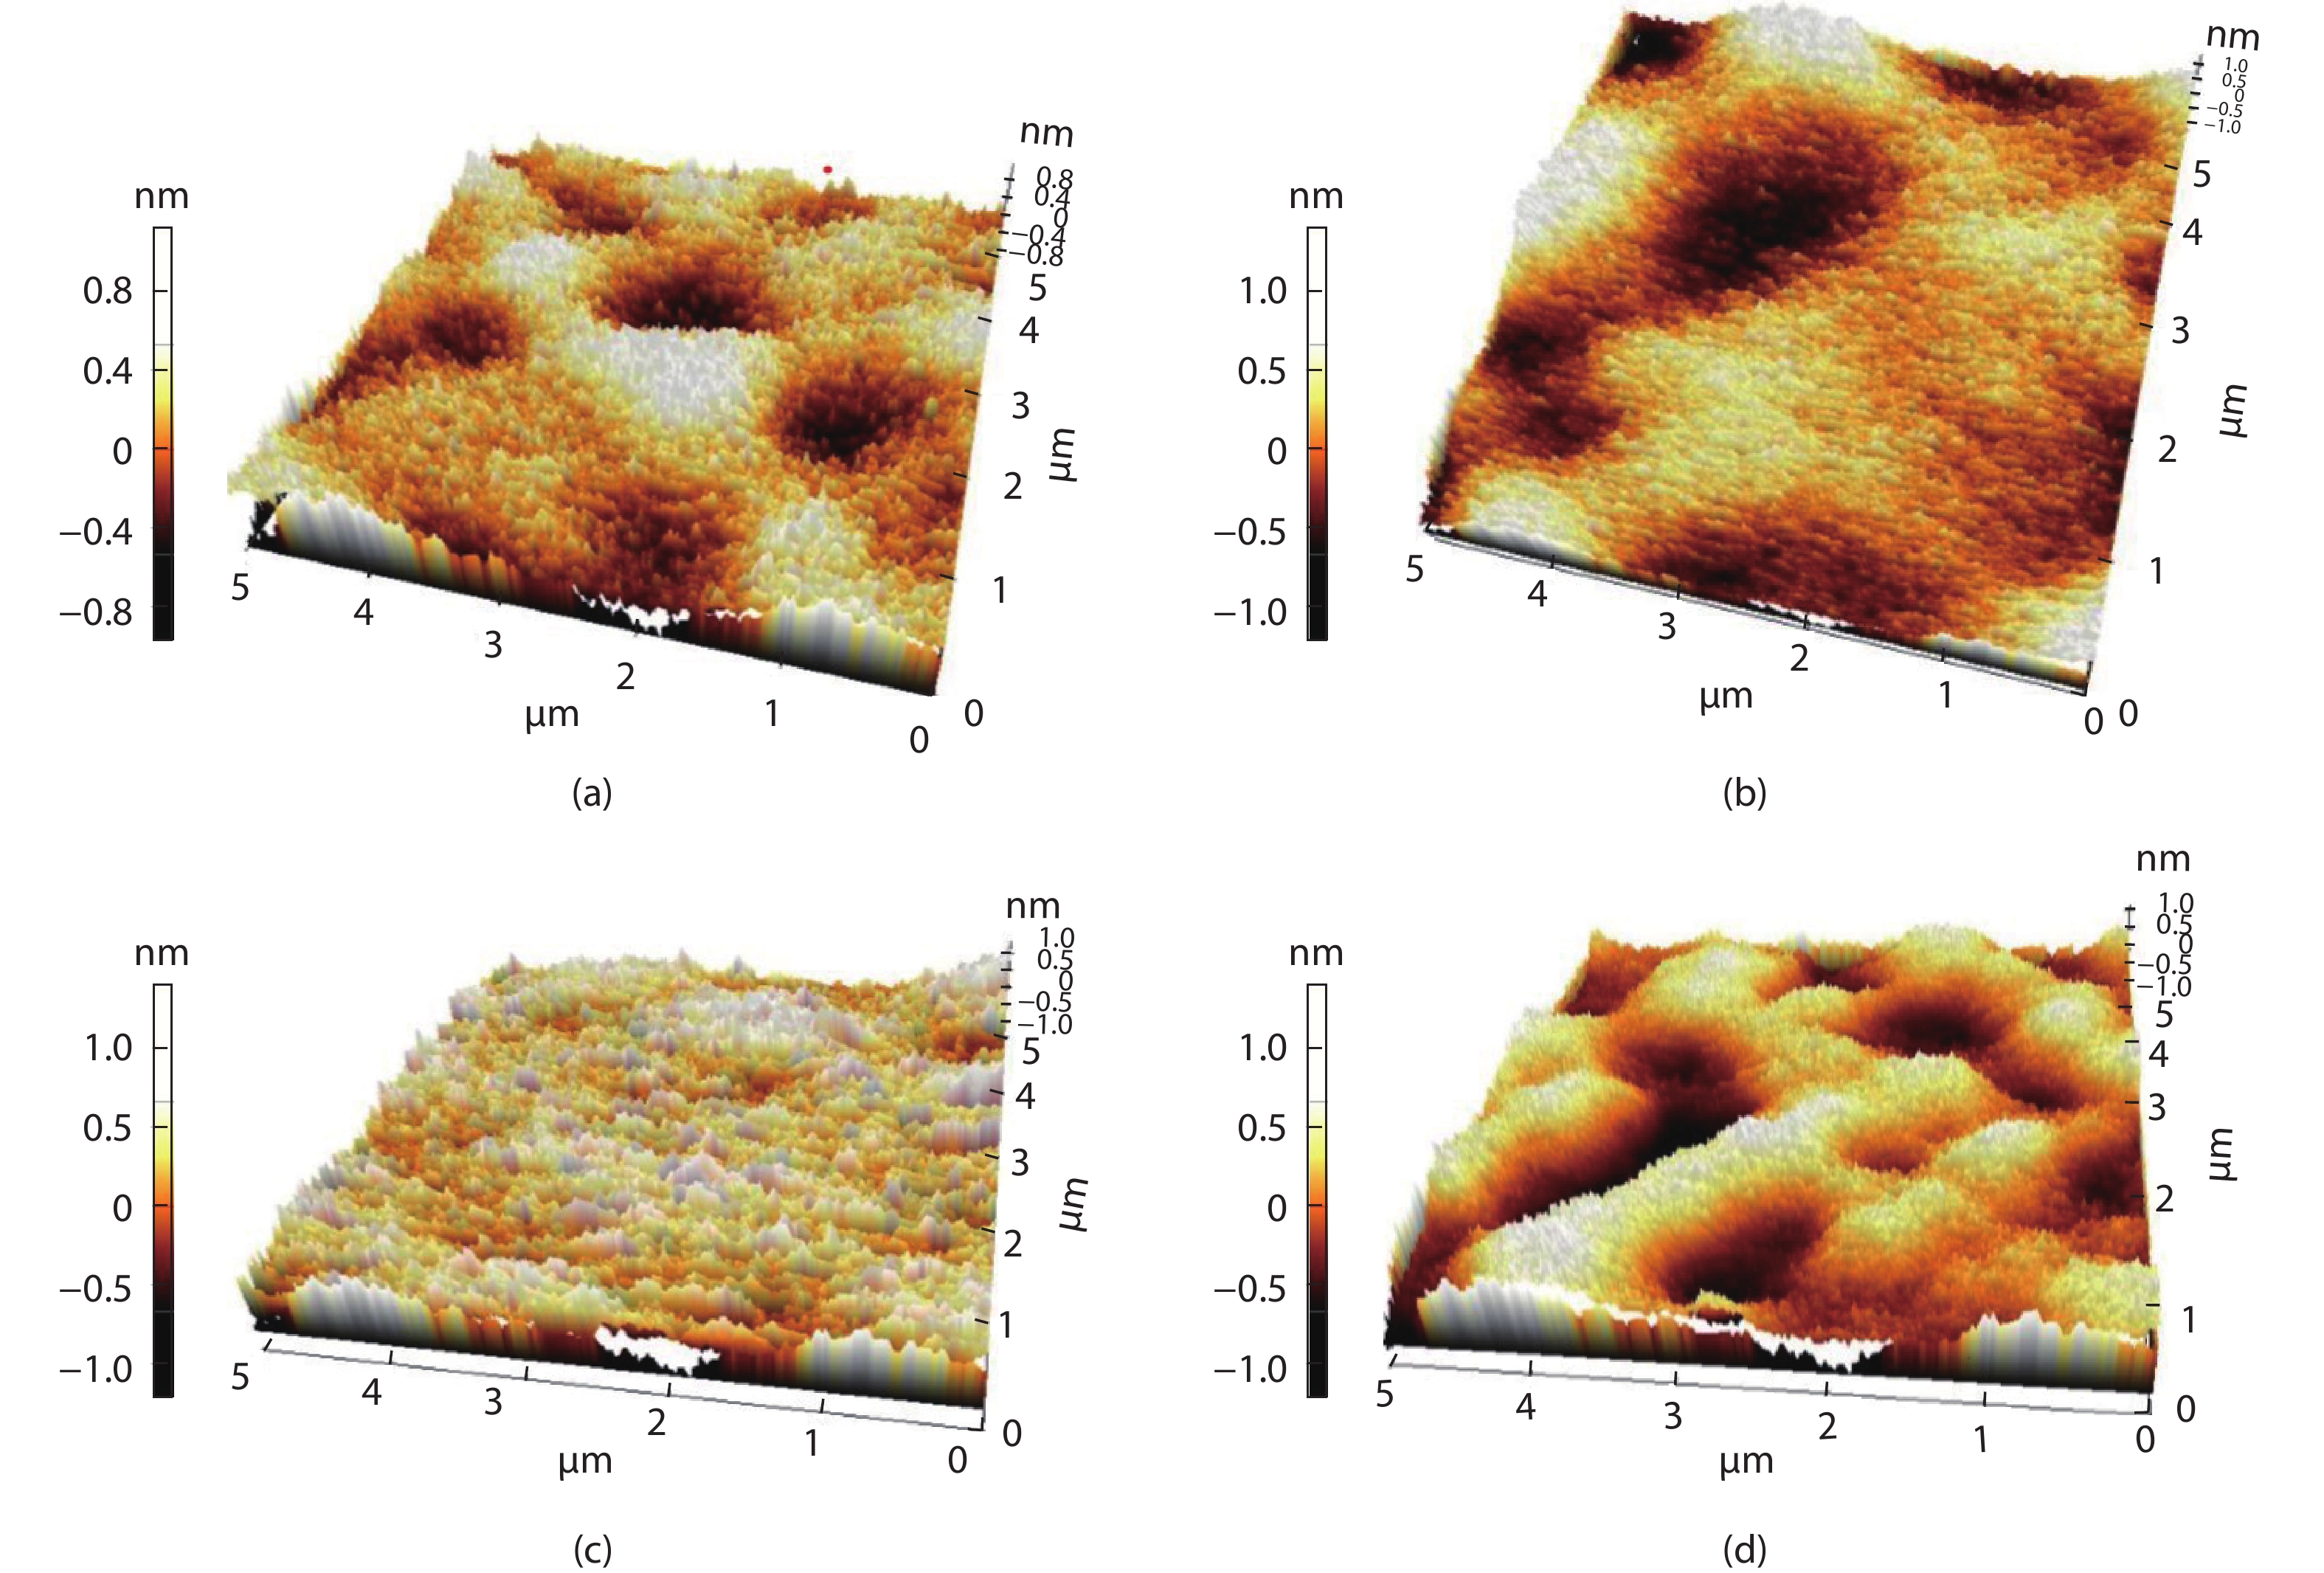
    Fig. 2. (Color online) AFM images of Ta-Sb2Te3 surface (a) CF4/Ar = 10/40, RMS = 0.27, (b) CF4/Ar = 20/30, RMS = 0.34, (c) CF4/Ar = 25/25, RMS = 0.35, (d) CF4/Ar = 30/20 and RMS = 0.42.
    Effect of chamber pressure on etching rate and surface roughness.
    Fig. 3. Effect of chamber pressure on etching rate and surface roughness.
    SEM of cross sections of Ta-Sb2Te3 after ICP etching with pressure of (a)1.0 Pa, (b) 1.5 Pa, (c) 2.0 Pa, (d) 2.25 Pa, (e) 2.5 Pa, (f) 2.75 Pa with CF4 flow of 25 sccm, Ar flow of 25 sccm, ICP power of 600 W.
    Fig. 4. SEM of cross sections of Ta-Sb2Te3 after ICP etching with pressure of (a)1.0 Pa, (b) 1.5 Pa, (c) 2.0 Pa, (d) 2.25 Pa, (e) 2.5 Pa, (f) 2.75 Pa with CF4 flow of 25 sccm, Ar flow of 25 sccm, ICP power of 600 W.
    Effects of ICP source power on RMS roughness and etching rate of Ta-Sb2Te3.
    Fig. 5. Effects of ICP source power on RMS roughness and etching rate of Ta-Sb2Te3.
    (Color online) XPS spectrum of each component of the Ta-Sb2Te3 film after ICP etching.
    Fig. 6. (Color online) XPS spectrum of each component of the Ta-Sb2Te3 film after ICP etching.
    (Color online) XRD curves before and after ICP etching.
    Fig. 7. (Color online) XRD curves before and after ICP etching.
    ElementChemical compoundBoiling point (°C)
    SbSbF5141
    SbSbF3345
    TeTeF4195
    TeTeF6–39
    Table 1. The boiling point of fluoride.
    Yongkang Xu, Sannian Song, Wencheng Fang, Chengxing Li, Zhitang Song. The etching process and mechanism analysis of Ta-Sb2Te3 film based on inductively coupled plasma[J]. Journal of Semiconductors, 2020, 41(12): 122103
    Download Citation