
Liu Yang, Yongyong Zhuang, Yifan Zhang, Yaojing Zhang, Shuangyou Zhang, Zhuo Xu, Pascal Del’Haye, Xiaoyong Wei, "Electromagnetically induced transparency-like effect in a lithium niobate resonator via electronic control," Photonics Res. 11, 773 (2023)
- Photonics Research
- Vol. 11, Issue 5, 773 (2023)
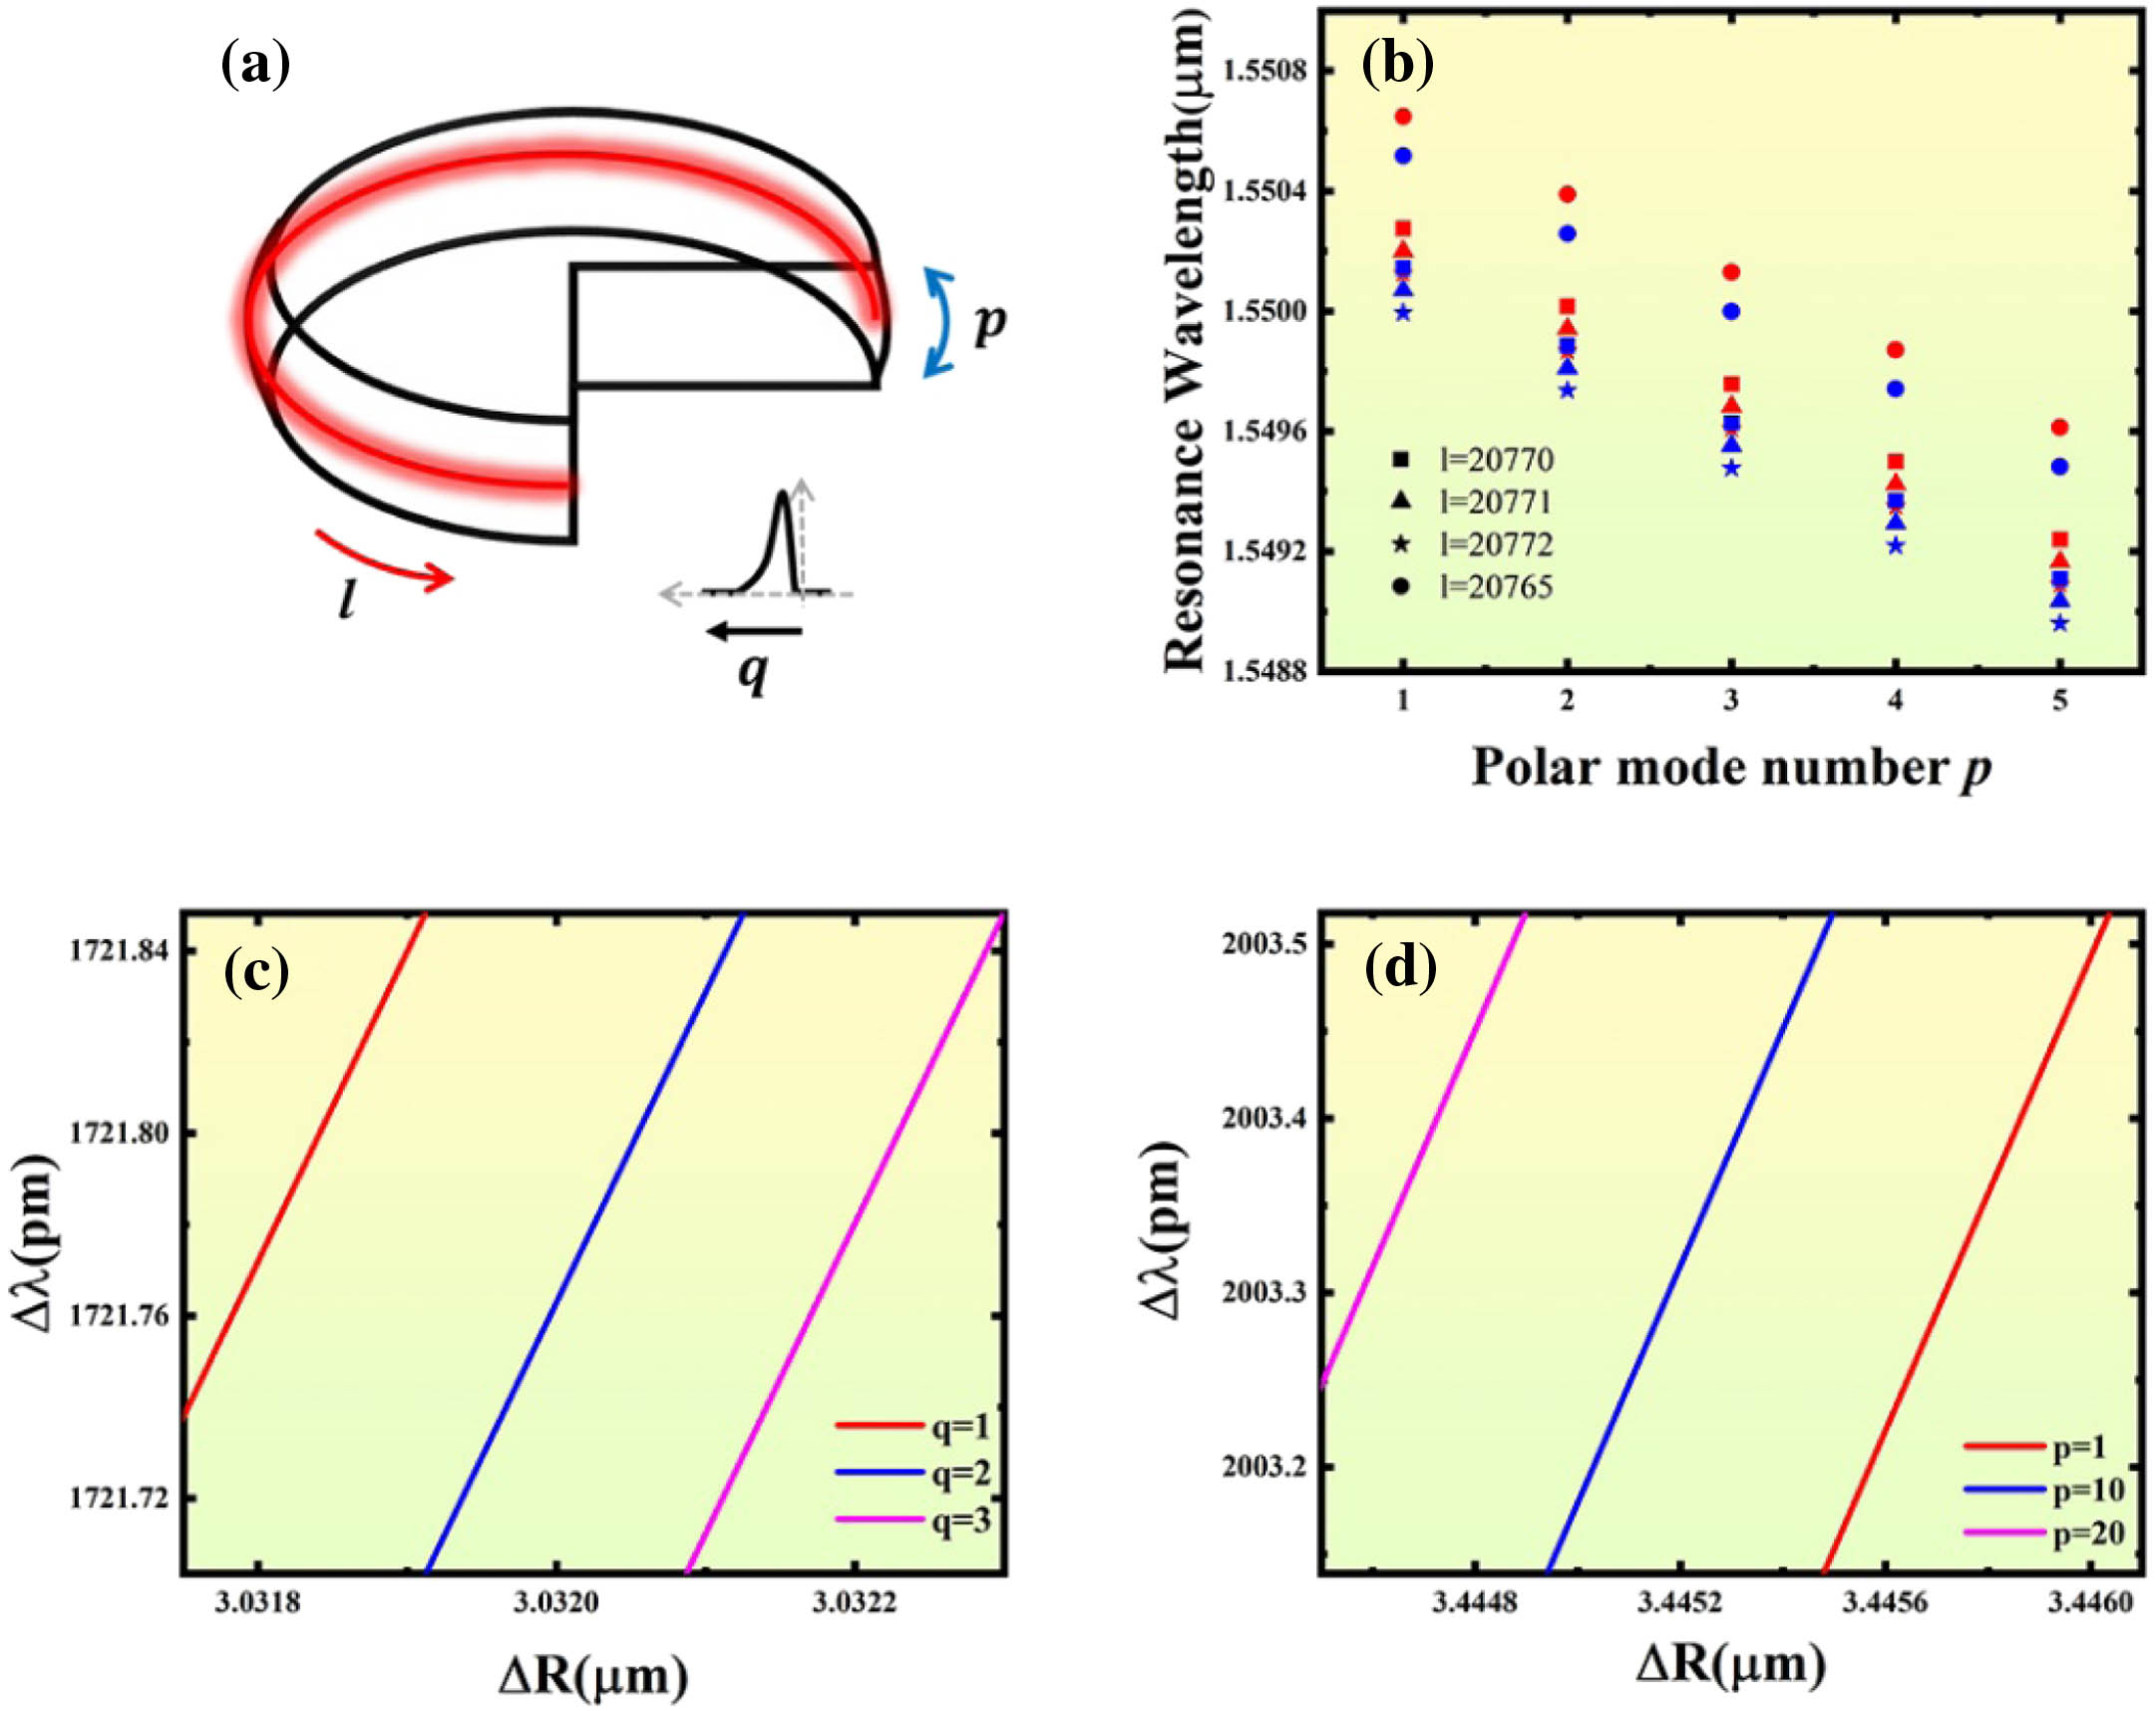
Fig. 1. (a) WGM schematic diagram. (b) Resonance wavelengths as a function of polar mode numbers in a single WGMR with R = 2.4 mm ρ = 0.05 R q = 1 q = 2 l = 20 , 770 p = 0 l = 20 , 770 q = 1
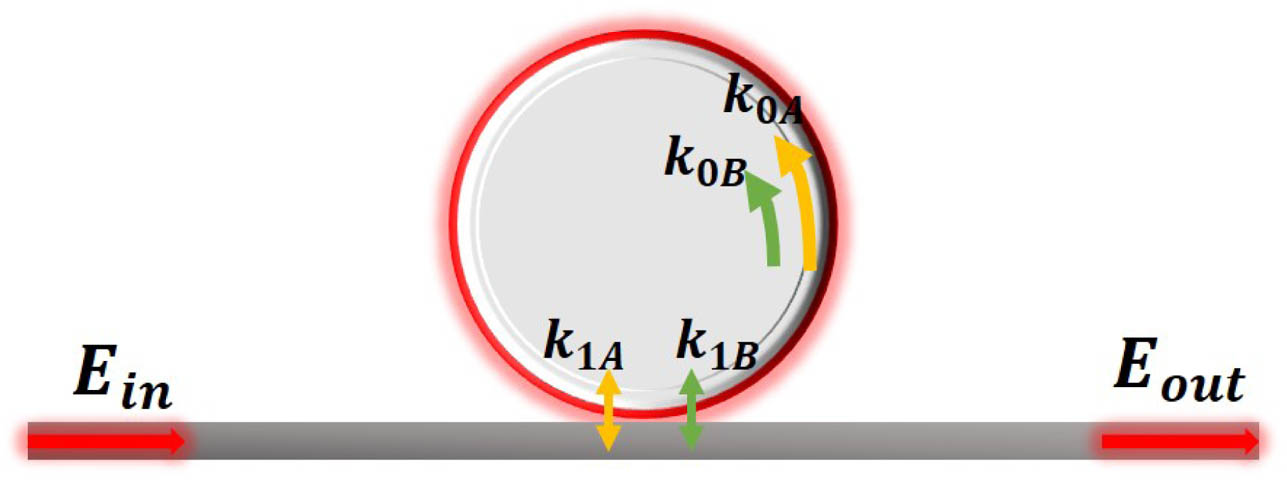
Fig. 2. Schematic illustration of a resonator with two WGMs.
Fig. 3. (a) LN WGMR with copper electrodes. (b) Schematic of the experimental setup. An LN WGMR is coupled to a rutile prism. HWP, half-wave plate; and PD, photodetector.
Fig. 4. (a)–(e) Normalized experimental transmission spectrum changes with increasing voltage. The pink arrow indicates mode 1, while the blue arrow indicates mode 2. (f) Zoom-in for the normalized transmission of adjacent modes 1 and 2, corresponding to the green box in Fig. 3 (a). (g) Resonance wavelength shifts of two modes as a function of the applied voltage.
Fig. 5. (a)–(e) Experimental data for the normalized transmission spectra of the LN WGM coupled via a rutile prism at different voltages. From the top panel to the bottom panel, the voltage changes from 0 V to 160 V, at intervals of 40 V. (f), (g) Theoretical calculation of the spectrum of the coupled system. The theoretical parameters are: [ k 0 A , k 1 A , k 0 B , k 1 B , g , Δ ω A B ] = [ 0.95 π , 11 π , − 9.6 π , − 0.17 π , 0.03 π , − 105 ] MHz [ 0.95 π , 11.8 π , − 9.6 π , − 0.4 π , 0.44 π , − 46 ] MHz [ 0.95 π , 10.8 π , − 9.6 π , − 0.5 π , 0.2 π , 0 ] MHz [ 0.95 π , 11.2 π , − 9.6 π , − 0.4 π , 0.14 π , 24 ] MHz [ 0.95 π , 10 π , − 9.6 π , − 0.14 π , 1.8 π , 145 ] MHz


Set citation alerts for the article
Please enter your email address

© Copyright 2018-2021 | Chinese Laser Press. All Rights Reserved 沪ICP备15018463号-20