
Mingsheng Tian, Fengxiao Sun, Kaiye Shi, Haitan Xu, Qiongyi He, Wei Zhang, "Nonreciprocal amplification transition in a topological photonic network," Photonics Res. 11, 852 (2023)
- Photonics Research
- Vol. 11, Issue 5, 852 (2023)
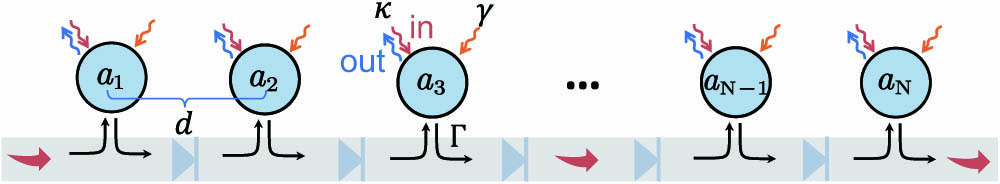
Fig. 1. Chain of N Γ κ γ d d = 1
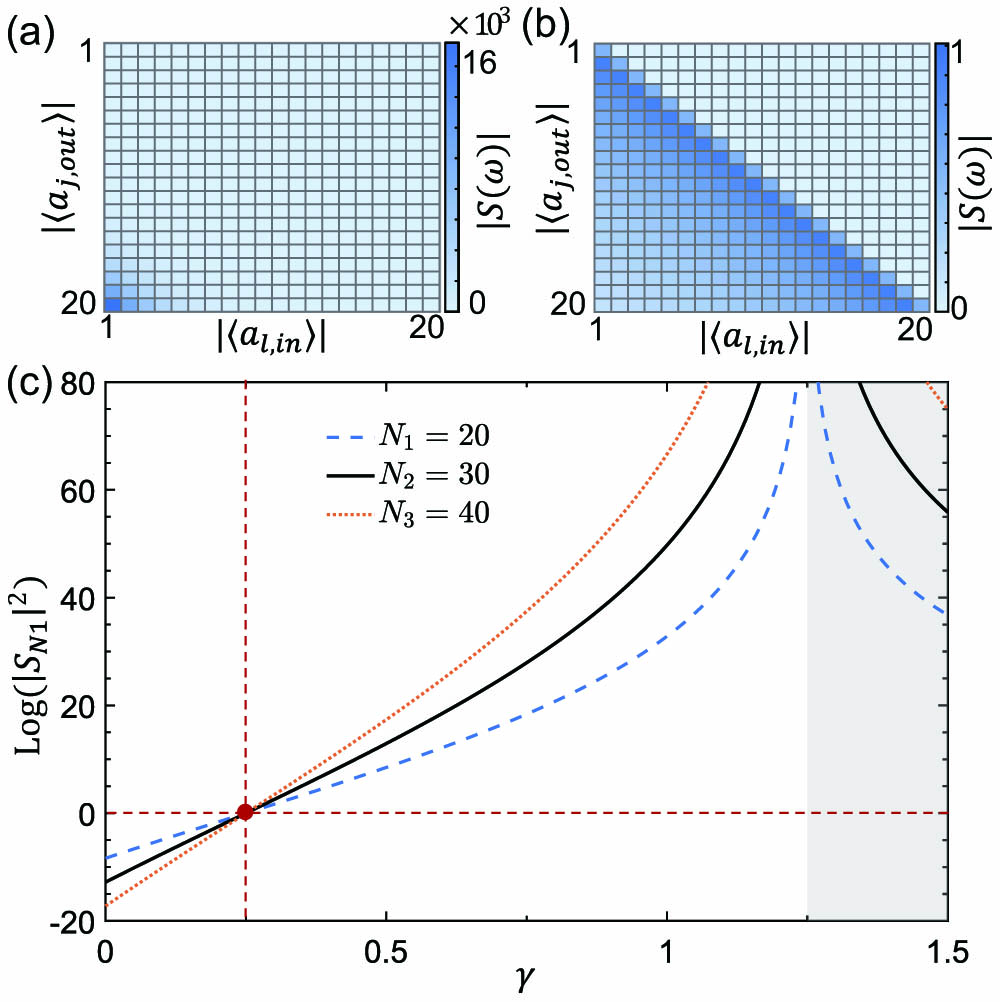
Fig. 2. Scattering matrices for (a) γ = 0.5 γ = 0.2 N = 20 | S N 1 | 2 γ Γ = 1 κ = 0.25 Δ ω = 0 ζ ≫ N
Fig. 3. Gain | S N 1 | 2 γ ζ ζ ≪ N ζ N = 100 Γ = 1 κ = 0.25
Fig. 4. Gain | S N 1 | 2 γ Δ ω ζ ≫ N γ N = 100 Γ = 1 κ = 0.25


Set citation alerts for the article
Please enter your email address

© Copyright 2018-2021 | Chinese Laser Press. All Rights Reserved 沪ICP备15018463号-20