
Zhengfen Jiang, Boyi Li, Tho N. H. T. Tran, Jiehui Jiang, Xin Liu, Dean Ta, "Fluo-Fluo translation based on deep learning," Chin. Opt. Lett. 20, 031701 (2022)
- Chinese Optics Letters
- Vol. 20, Issue 3, 031701 (2022)
Abstract
1. Introduction
Fluorescence microscopy uses fluorescent dyes to provide highly specific visualization of cell components, which plays an important role in understanding the subcellular structure of cells[
Recently, convolutional neural networks (CNNs) have been proved to have unprecedented performance in microscopy image analysis tasks[
The conditional generative adversarial network (cGAN)[
Sign up for Chinese Optics Letters TOC. Get the latest issue of Chinese Optics Letters delivered right to you!Sign up now
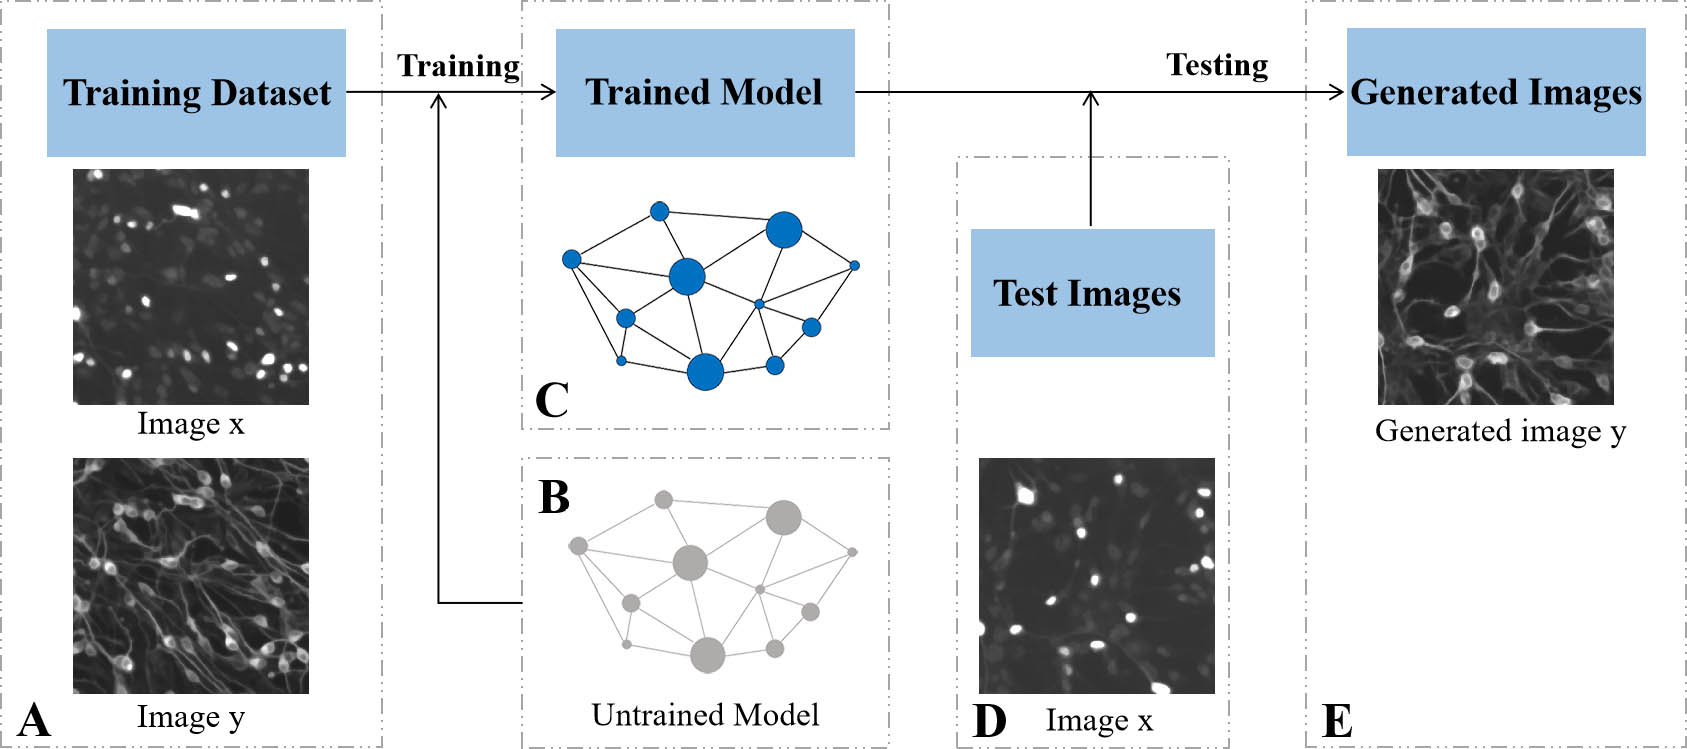
Figure 1 illustrates the cGAN-based system for Fluo-Fluo translation. Briefly, in this work, cGAN is employed to predict the location of III-tubulin (TuJ1) protein, from Islet1 protein to predict the location and intensity of membrane from DAPI, to predict whether the cell dies from Hoechst, to predict microtubule-associated protein-2 (MAP2) and neurofilament-F (NFH) from DAPI, and to further realize multi-label fluorescent staining. Especially to improve the network output quality, a new loss function combining the advantages of the L1 loss function and the multi-scale structural similarity (MS-SSIM) loss function[
![]()
Figure 1.System for Fluo-Fluo translation based on cGAN. (A) The training dataset is composed of fluorescence images x and y in the same field of view. (B) A deep neural network is composed of untrained parameters. (C) The deep neural network trained with data in (A). (D) Test image. (E) Based on the trained deep learning model, the fluorescence image y is predicted from the fluorescence image x.
2. Principle
2.1. Conditional generative adversarial network
The purpose of image-to-image translation is to learn the mappings between different domains in order to complete the image translation across domains[
![]()
Figure 2.cGAN framework for Fluo-Fluo translation based on deep learning. (A) The generator network attempts to generate image y with respect to image x, and the discriminator network attempts to distinguish between the generated image y and the true image y. There is a competitive relationship between these two networks. Briefly, image x is used as the input of the generator to obtain the generated image G(x), and then G(x) and x are combined as the input of the discriminator. During training, two error functions are calculated: (i) L1 and MS-SSIM loss functions are used to measure the similarity between the generated image G(x) and the target image y; (ii) the cGAN error attempts to distinguish the generated image G(x) from the target image y corresponding to the input image x. The combined loss functions are optimized by the Adam algorithm. (B) Once trained, the generator can immediately predict the fluorescence image y from the fluorescence image x of the test dataset.
2.2. Loss function
The selection of loss function is a key component of the deep neural network design. The L1 loss function can keep the brightness and color unchanged, but it assumes that the influence of noise and the local characteristics of the image are independent. The MS-SSIM loss function is an index that integrates human subjective perception, taking into account subjective factors such as brightness, contrast, structure, and resolution. However, the MS-SSIM loss function can easily lead to brightness changes and color deviations[
The loss function of cGAN is defined as follows:
The L1 loss function can be added to ensure that the output image is clear[
In addition, the MS-SSIM loss function is also added, as follows:
The final loss function of our network is formulated as
3. Experiment and Analysis
3.1. Experimental dataset
A part of the experimental dataset comes from a public dataset[
| Groups | Cell Type | Fluorescence Label | Marked Location | Training Set | Test Set |
|---|---|---|---|---|---|
| Group 1 | Human motor neurons | Islet1 | Motor neurons | 1280 | 320 |
| TuJ1 | Neurons | ||||
| Group 2 | Human breast cancer cells | DAPI | Nuclei | 300 | 75 |
| CellMask | Membrane | ||||
| Group 3 | Rat cortical neurons | Hoechst | Nuclei | 5760 | 1440 |
| PI | Dead cells | ||||
| Group 4 | Human motor neurons | DAPI | Nuclei | 2400 | 600 |
| MAP2 | Dendrites | ||||
| NFH | Axons |
Table 1. Detailed Information of Experimental Data
In addition, the rat cardiomyocytes data from our own experiment, in which DAPI is used to label cell nuclei and CellMask is used to label cell membrane, have also been used to evaluate the generalization capability of the proposed method in Fluo-Fluo translation.
3.2. Training
Our deep neural network is implemented using Python version 3.8.3. cGAN is implemented using PyTorch framework version 1.6.0. Other Python libraries include torchvision, dominate, visdom, os, time, Python Imaging Library (PIL), and Numpy. The network implementation is carried out on a desktop computer with Intel®Xeon® Gold 6248R CPU at 3.00 GHz and 3.00 GHz (two processors), 256G RAM, and running Windows 10 operating system. We train the network model for 200 epochs by the Adam optimization algorithm, and the batch size of each optimization traversal is set to four. The regularization parameters
In this work, the average training time of each group is 6.8 h, and the average test time of each image is 0.5 s.
3.3. Evaluation criteria
In order to evaluate the performance of the network, we calculate the structural similarity (SSIM)[
In this work, SSIM is calculated as
PSNR is defined as follows:
MAE is calculated as follows:
4. Experimental Results and Analysis
4.1. Predict Fluo-Fluo translation image
Figure 3 shows the prediction results of Groups 1–3 obtained by the proposed method. The input image, the true image, the network generated image, the absolute error map, and the scatter plot are shown, respectively. Here, the absolute error represents the difference of each pixel value between the true and the generated fluorescence images. With the higher values of absolute errors, the color of the absolute error map becomes closer to red. On the contrary, the color of the absolute error map becomes closer to blue[
![]()
Figure 3.Prediction results obtained by the proposed method. (A) Predict TuJ1 protein from Islet1 protein based on deep learning. (B) Predict CellMask from DAPI based on deep learning. (C) Predict PI from Hoechst based on deep learning. From left to right, the input image, the true image (ground truth), the network generated image, the absolute error map, and the scatter plot are displayed in turn.
4.1.1. Predict TuJ1 protein from Islet1 protein
The cell type is human motor neurons. Islet1 protein can be used as a motor neuron marker. TuJ1 is a tubulin involved in neuronal cell type-specific differentiation and can be used as a neuronal marker. The experimental results show that the absolute error maps [Fig. 3(a)] are mostly blue, indicating that the difference in pixel values between the true fluorescence image (true TuJ1) and the virtual fluorescence image (generated TuJ1) is very small. In addition, the distributions of the scatter plot [Fig. 3(a)] are generally in the shape of a straight bar, showing linear and diagonal distribution. That means there is a strong linear relationship between the true and the generated fluorescence images. These results indicate that cGAN can accurately predict TuJ1 protein from Islet1 protein.
4.1.2. Predict CellMask from DAPI
The cell type is human breast cancer cells. DAPI is a fluorescent dye that can bind strongly to DNA and can be used to label nuclei. CellMask dye can label membranes quickly and evenly. Based on the experimental results from Fig. 3(b), we can observe that the absolute error map is mostly blue, indicating that the pixel value difference between the true fluorescence image (true CellMask) and the virtual fluorescence image (generated CellMask) is insignificant. The scatter distribution in the scatter plot is basically linear and has a tendency to align towards the Y axis. It indicates that there is a certain linear relationship between the true and the generated fluorescence images. But, the fluorescence intensity of the true fluorescence image is higher than that of the generated fluorescence image.
4.1.3. Predict PI from Hoechst
The cell type is rat cortical neurons. PI can enter dead cells and bind to DNA; therefore, dead cells can be identified by PI staining. As expected, the absolute error map shown in Fig. 3(c) is almost all blue, indicating that the difference in pixel values between true PI and the generated PI is small. Furthermore, the scatter distribution in the scatter plot is linear and diagonal distribution, indicating that there is a very strong linear relationship between the true and the generated fluorescence images.
![]()
Figure 4.Prediction results obtained by the proposed method. (A) Predict MAP2 from DAPI based on deep learning. (B) Predict NFH from DAPI based on deep learning. (C) Multi-label visualization co-localization.
4.1.4. Predict MAP2 and NFH from DAPI
In addition to the above prediction from a fluorescence image to another fluorescence image, we also train cGAN to predict MAP2 and NFH from DAPI and realize the prediction of a variety of other fluorescence images from one fluorescence image. Furthermore, we have achieved multi-label fluorescent staining by merging different fluorescence images generated by the network. Based on the multi-label results, we can better analyze the co-expression and co-localization of different proteins in cell samples[
The cell type is human motor neurons. MAP2 is a neuron-specific cytoskeleton protein, which can be used as a neuron dendritic marker. NFH is a neuron-specific intermediate filament protein, which can be used as a neuron axon marker. The absolute error map in Fig. 4(a) is mostly blue, indicating that the pixel value difference between the true MAP2 and the generated MAP2 is minor. The distribution in the scatter plot is generally in the shape of a straight bar, indicating that there is a strong linear relationship between the true and the generated fluorescence images. These results exhibit that cGAN can accurately predict MAP2 from DAPI. However, only part of the absolute error map in Fig. 4(b) is blue, indicating that there is a certain difference between the pixel values of the true fluorescence image (true NFH) and the virtual fluorescence image (generated NFH). Furthermore, the distribution of the scatter plot in Fig. 4(b) is generally fan-shaped. It means that the true and the generated fluorescence images are moderately correlated. These results demonstrate that cGAN can predict NFH from DAPI, but the prediction capability is average. Finally, Fig. 4(c) shows the merged images of various fluorescence images to visualize co-localization. The fourth column of Fig. 4(c) is the merged image of the input DAPI label and the generated MAP2 and NFH labels. Comparably, the fifth column is the merged image of the input DAPI label and the true MAP2 and NFH labels. Compared to the above results, they are found to be similar, indicating that cGAN can effectively reconstruct a variety of fluorescence images from a single fluorescence image.
In addition to the visual comparison provided in Figs. 3 and 4, we further quantitatively compare the difference between the true and the network generated images in terms of SSIM, PSNR, and MAE. For each group, 20 randomly selected images are used to calculate the quantitative indicators. Table 2 summarizes the obtained SSIM, PSNR, and MAE values. These results further demonstrate that cGAN successfully generates virtual fluorescence images similar to ground-truth fluorescence images.
| Comparisons | SSIM | PSNR (dB) | MAE | |||
|---|---|---|---|---|---|---|
| Mean | Std | Mean | Std | Mean | Std | |
| TUJ1 (true) vs TUJ1 (generated) | 0.802 | 0.024 | 21.845 | 0.821 | 5.682 | 1.468 |
| CellMask (true) vs CellMask (generated) | 0.849 | 0.028 | 23.732 | 0.948 | 6.348 | 1.232 |
| PI (true) vs PI (generated) | 0.980 | 0.009 | 29.456 | 3.266 | 0.885 | 0.610 |
| MAP2 (true) vs MAP2 (generated) | 0.888 | 0.030 | 23.172 | 1.595 | 3.999 | 1.821 |
| NFH (true) vs NFH (generated) | 0.729 | 0.065 | 18.130 | 1.536 | 4.616 | 1.638 |
Table 2. SSIM, PSNR, and MAE Values Between the True and the Network Generated Images
4.2. Evaluate the effect of the number of training sets on the prediction results
Figure 5 demonstrates the dependence of the prediction results on the number of training sets used. Figures 5(a) and 5(b) show the prediction results from Group 1 and Group 3, respectively. The outputs are obtained based on the network model trained with different numbers of training images. Furthermore, Figs. 5(c) and 5(d) quantify the differences in terms of the SSIM, PSNR, and MAE indicators. The experimental results show that with an increase in the number of training images, the prediction capability increases gradually. But, when reaching a high training data number (e.g., 2000 images in Group 3), the prediction capability seems not to be obviously improved [Fig. 5(d)]. In addition, we can also observe that relatively few training data can already produce meaningful results [Figs. 5(c) and 5(d)]. Similar phenomena have also been demonstrated in LaChance and Cohen[
![]()
Figure 5.Effects of the number of training sets on the prediction performance of the proposed method. (A) and (B) Prediction results obtained by using the reduced training sets. (A) Predict TuJ1 from Islet1. (B) Predict PI from Hoechst. (C) and (D) Quantify the differences in terms of the SSIM, PSNR, and MAE indicators, respectively.
4.3. Evaluate the generalization capability in Fluo-Fluo translation
Figure 6 demonstrates the prediction capability of the proposed method by our own experimental data. The cell type of the dataset is rat cardiomyocytes. DAPI is used to label the cell nuclei, and CellMask is used to label the cell membrane. To further demonstrate the generalization performance, in this case, we use the public dataset from Group 2 (predicting CellMask from DAPI based on human breast cancer cells) for network training, and then the trained model is used to predict our own experimental data. Furthermore, to calculate the quantitative indicators, 20 randomly selected test images are used. The obtained values of SSIM, PSNR, and MAE were
![]()
Figure 6.Predict CellMask from DAPI based on our rat cardiomyocyte dataset. The public dataset from Group 2 (predicting CellMask from DAPI based on human breast cancer cells) is used for network training, and then the trained model is used to predict our own experimental data.
5. Conclusion
This work proposes a method based on deep learning to predict a fluorescence image in the same field of view from another fluorescence image. cGAN is used to generate virtual fluorescence images. To improve the quality of the generated image, we add the L1 loss function and the MS-SSIM loss function to the original loss function. In addition to intuitive visual comparison, we also use three indicators (SSIM, PSNR, and MAE) to quantitatively evaluate the performance of the network. The experimental results show that cGAN successfully generates virtual fluorescence images similar to true fluorescence images. It should be noted that we have also achieved multi-label fluorescent staining by merging fluorescent images of different labels.
In summary, this study shows that a deep neural network can achieve Fluo-Fluo translation and describe the localization relationship between subcellular structures labeled with different fluorescent markers. Our Fluo-Fluo translation method can avoid non-specific cross labeling in multi-label fluorescence staining and is free from spectral overlaps. Theoretically, an unlimited number of fluorescence images can be predicted from one fluorescence image for cell characterization.
References
[1] A. Nwaneshiudu, C. Kuschal, F. H. Sakamoto, R. R. Anderson, K. Schwarzenberger, R. C. Young. Introduction to confocal microscopy. J. Investig. Dermatol., 132, e3(2012).
[2] S. Rohilla, B. Kraemer, F. Koberling, I. Gregor, A. C. Hocke. Multi-target immunofluorescence by separation of antibody cross-labelling via spectral-FLIM-FRET. Sci. Rep., 10, 3820(2020).
[3] P. van Horssen, M. Siebes, I. Hoefer, J. A. E. Spaan, J. P. H. M. van den Wijngaard. Improved detection of fluorescently labeled microspheres and vessel architecture with an imaging cryomicrotome. Med. Biol. Eng. Comput., 48, 735(2010).
[4] D. Shen, G. Wu, H. Suk. Deep learning in medical image analysis. Annu. Rev. Biomed. Eng., 19, 221(2017).
[5] N. Aloysius, M. Geetha. A review on deep convolutional neural networks. International Conference on Communication and Signal Processing, 2(2017).
[6] E. Nehme, L. E. Weiss, T. Michaeli, Y. Shechtman. Deep-STORM: super-resolution single-molecule microscopy by deep learning. Optica, 5, 458(2018).
[7] H. Wang, Y. Rivenson, Y. Jin, Z. Wei, R. Gao, H. Gunaydin, L. A. Bentolila, C. Kural, A. Ozcan. Deep learning enables cross-modality super-resolution in fluorescence microscopy. Nat. Methods, 16, 103(2019).
[8] X. Chai, Q. Ba, G. Yang. Characterizing robustness and sensitivity of convolutional neural networks for quantitative analysis of mitochondrial morphology. Quant. Biol., 6, 344(2018).
[9] H. Shen, J. Gao. Deep learning virtual colorful lens-free on-chip microscopy. Chin. Opt. Lett., 18, 121705(2020).
[10] E. M. Christiansen, S. J. Yang, D. M. Ando, A. Javaherian, G. Skibinski, S. Lipnick, E. Mount, A. O’Neil, K. Shah, A. K. Lee, P. Goyal, W. Fedus, R. Poplin, A. Esteva, M. Berndl, L. L. Rubin, P. Nelson, S. Finkbeiner. In silico labeling: predicting fluorescence images in unlabeled images. Cell, 173, 792(2018).
[11] T. Nguyen, V. Bui, A. Thai, C. Raub, L. C. Chang, G. Nehmetallah. Virtual organelle self-coding for fluorescence imaging via adversarial learning. J. Biomed. Opt., 25, 9(2020).
[12] K. Shigene, Y. Hiasa, Y. Otake, M. Soufi, S. Janewanthanakul, T. Nishimura, Y. Sato, S. Suetsugu. Translation of cellular protein localization using convolutional. Front. Cell. Dev. Biol., 9, 635231(2021).
[13] P. Isola, J. Y. Zhu, T. Zhou, A. A. Efros. Image-to-image translation with conditional adversarial networks. Conference on Computer Vision and Pattern Recognition, 2(2017).
[14] Z. Yu, Z. Ju, X. Zhang, Z. Meng, F. Yin, K. Xu. High-speed multimode fiber imaging system based on conditional generative adversarial network. Chin. Opt. Lett., 19, 081101(2021).
[15] J. Feng, X. Feng, J. Chen, X. Cao, X. Zhang, L. Jiao, T. Yu. Generative adversarial networks based on collaborative learning and attention mechanism for hyperspectral image classification. Remote Sens., 12, 1149(2020).
[16] Z. Wang, E. P. Simoncelli, A. C. Bovik. Multi-scale structural similarity for image quality assessment. Asilomar Conference on Signals, Systems & Computers, 3(2003).
[17] S. Basavaraju, P. K. Sharma, A. Sur. Memorability based image to image translation. 12th International Conference on Machine Vision, 1(2019).
[18] D. Li, H. Hui, Y. Zhang, W. Tong, F. Tian, X. Yang, J. Liu, Y. Chen, J. Tian. Deep learning for virtual histological staining of bright-field microscopic images of unlabeled carotid artery tissue. Mol. Imaging Biol., 22, 1301(2020).
[19] M. Darvishi, H. G. Hamidabadi, S. S. Negah, A. Moayeri, T. Tiraihi, J. Mirnajafi-Zadeh, A. J. Jahan-Abad, A. Shojaei. PuraMatrix hydrogel enhances the expression of motor neuron progenitor marker and improves adhesion and proliferation of motor neuron-like cells. Iran. J. Basic. Med. Sci., 23, 4(2020).
[20] R. Matsuno, H. Ohtaki, T. Nakamachi, J. Watanabe, S. Yofu, D. Hayashi, T. Takeda, N. Nonaka, M. Seki, M. Nakamura, K. Itabashi, S. Shioda. Distribution and localization of pituitary adenylate cyclase-activating polypeptide-specific receptor (PAC1R) in the rostral migratory stream of the infant mouse brain. Regul. Pept., 145, 80(2008).
[21] D. Wlodkowic, W. Telford, J. Skommer, Z. Darzynkiewicz. Apoptosis and beyond: cytometry in studies of programmed cell death. Methods Cell Biol., 103, 55(2011).
[22] R. Kleiman, G. Banker, O. Steward. Development of subcellular mRNA compartmentation in hippocampal neurons in culture. J. Neurosci., 14, 1130(1994).
[23] D. C. Molliver, M. J. Radeke, S. C. Feinstein, W. D. Snider. Presence or absence of TrkA protein distinguishes subsets of small sensory neurons with unique cytochemical characteristics and dorsal horn projections. J. Comp. Neurol., 361, 404(1995).
[24] Z. Wang, A. C. Bovik, H. R. Sheikh, E. P. Simoncelli. Image quality assessment: from error visibility to structural similarity. IEEE Trans. Image Process, 13, 600(2004).
[25] S. Bolte, F. P. Cordelieres. A guided tour into subcellular colocalization analysis in light microscopy. J. Microsc., 224, 213(2006).
[26] B. G. Qian, J. Lei. Application of multiplexed immunofluorescent staining and multi-spectral imaging in histological studies. J. Histochem. Cytochem., 26, 5013(2017).
[27] J. LaChance, D. J. Cohen. Practical fluorescence reconstruction microscopy for large samples and low-magnification imaging. PLoS Comput. Biol., 16, e1008443(2020).


Set citation alerts for the article
Please enter your email address

© Copyright 2018-2021 | Chinese Laser Press. All Rights Reserved 沪ICP备15018463号-20