
Tifeng Xia, Wenqian Cao, Yuanjing Cui, Yu Yang, Guodong Qian. Water-sensitive multicolor luminescence in lanthanide-organic framework for anti-counterfeiting[J]. Opto-Electronic Advances, 2021, 4(8): 200063-1
- Opto-Electronic Advances
- Vol. 4, Issue 8, 200063-1 (2021)
![(a) Structure of 12-connected hexanuclear Eu cluster [Eu6(μ3-OH)8(CO2)12]. Eu, blue; C, black; O, red. (b) Crystal structure of Eu(BDC-NH2) viewed along the a axis. Eu, blue polyhedra; C, gray; O, red; N, blue; H atoms, Me2NH2 cations and free DMF molecules are omitted for clarity. (c) Powder X-ray diffraction patterns of Eu(BDC-NH2), Tb(BDC-NH2) and Gd(BDC-NH2).](/richHtml/OEA/2021/4/8/08200063/img_1.jpg)
Fig. 1. (a ) Structure of 12-connected hexanuclear Eu cluster [Eu6(μ 3-OH)8(CO2)12]. Eu, blue; C, black; O, red. (b ) Crystal structure of Eu(BDC-NH2) viewed along the a axis. Eu, blue polyhedra; C, gray; O, red; N, blue; H atoms, Me2NH2 cations and free DMF molecules are omitted for clarity. (c ) Powder X-ray diffraction patterns of Eu(BDC-NH2), Tb(BDC-NH2) and Gd(BDC-NH2).
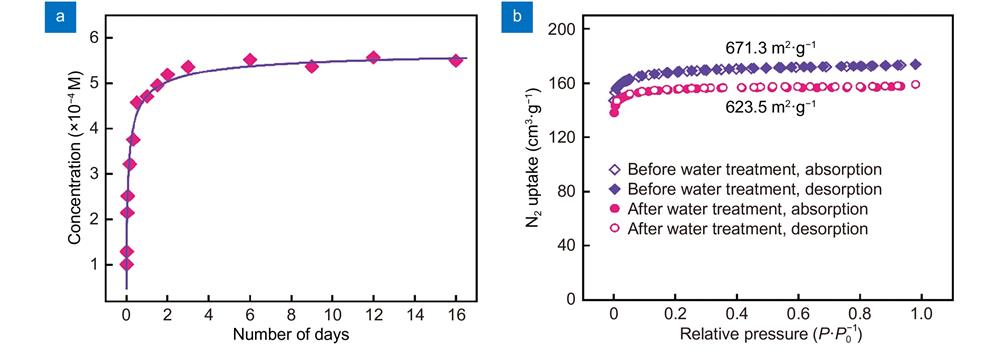
Fig. 2. (a ) The concentration of dissolved ligand H2BDC-NH2 in Eu(BDC-NH2) suspension at different time. (b ) N2 sorption isotherms of Eu(BDC-NH2) before (red) and after (blue) being treated with water at 77 K. Solid symbols: adsorption, open symbols: desorption.
Fig. 3. Emission spectra of Eu(BDC-NH2) in the solid state (a ) suspended in THF (b ) and in water (c ) excited at 375 nm.
Fig. 4. (a ) Emission spectra of Eu(BDC-NH2) suspended in THF with different water content excited at 375 nm. (b ) Intensities of ligand luminescence and 5D0 → 7F2 transition of Eu(BDC-NH2) in the presence of various content of water. (c ) The relationship of luminescence intensity ratio (I 430/I 614) and water content. (d ) Luminescence intensity ratio (I 430/I 614) measured in THF/H2O mixture with given water content (0.5, 1 and 2 vol%) using different amounts of Eu(BDC-NH2) (0.5, 1.0 and 1.5 mg).
Fig. 5. (a ) CIE chromaticity coordinates of the luminescence color of Eu(BDC-NH2) in THF with different water content (c = 0, 0.01, 0.04, 0.1, 0.3, 0.5, 0.7, 1, 1.5, 2, 3, and 5 vol%, respectively). Photographs of Eu(BDC-NH2) in (b ) THF and (c ) EtOH with different water content excited at 365 nm.
Fig. 6. (a ) Schematic representation of energy transfer process in Eu(BDC-NH2). (b ) Phosphorescence spectra of Gd(BDC-NH2) at 77 K excited at 375 nm in frozen THF and water.


Set citation alerts for the article
Please enter your email address

© Copyright 2018-2021 | Chinese Laser Press. All Rights Reserved 沪ICP备15018463号-20