
Dingbo Zhang, Jun Li, Wei Zhang, Xingchao Duan, Xinwei Zhang, Tian Ma, Weifeng Wang. Application of Fiber Bragg Grating Sensing Technology in the Health Monitoring of Special-Shaped Structures[J]. Laser & Optoelectronics Progress, 2022, 59(5): 0505001
- Laser & Optoelectronics Progress
- Vol. 59, Issue 5, 0505001 (2022)
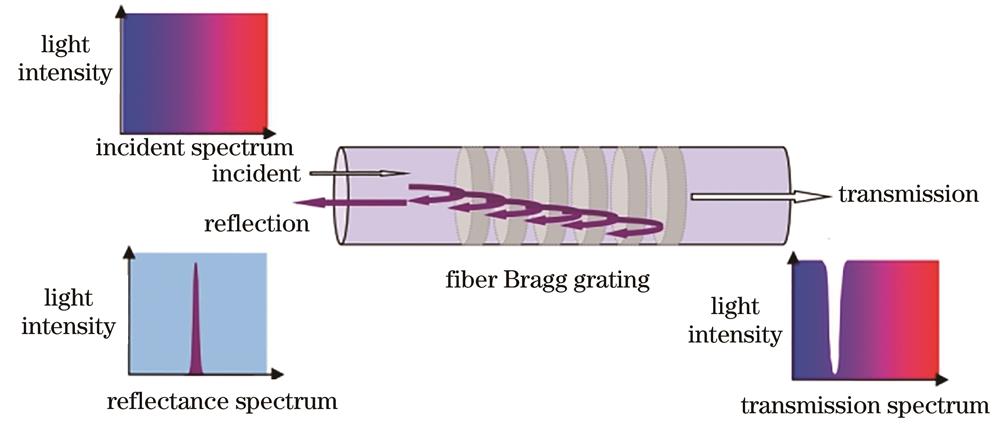
Fig. 1. Schematic diagram of the structure of fiber Bragg grating
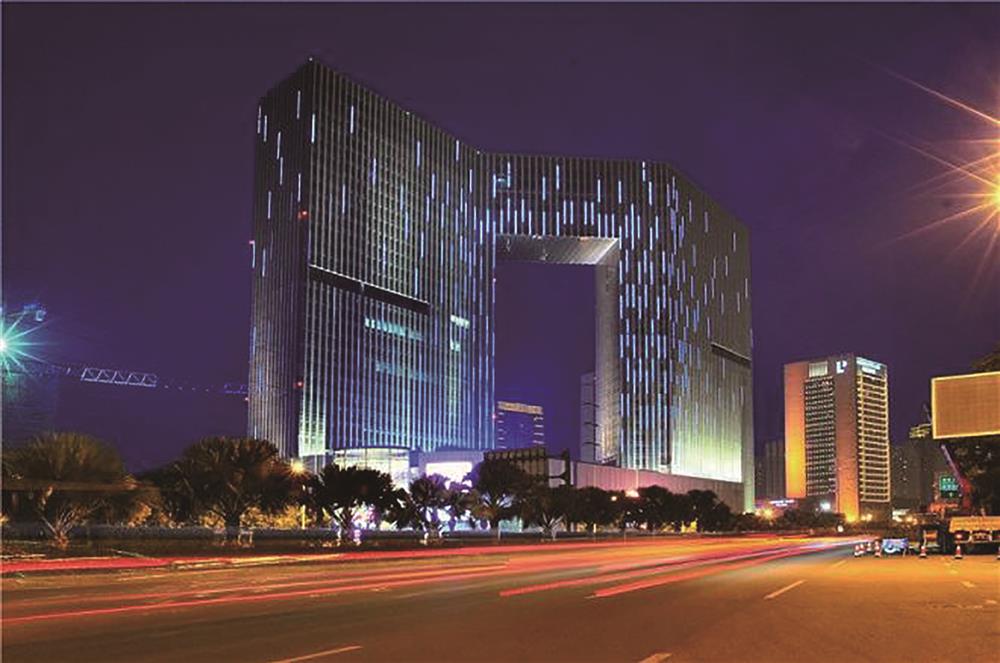
Fig. 2. Financial center tower
Fig. 3. Topology diagram of health monitoring and early warning system
Fig. 4. Temperature sensor layout diagram
Fig. 5. Effect picture of on-site installation of temperature sensor
Fig. 6. Displacement sensor layout diagram
Fig. 7. Effect picture of on-site installation of displacement sensor
Fig. 8. Strain sensor layout diagram
Fig. 9. Effect picture of on-site installation of strain sensor
Fig. 10. Settlement sensor layout diagram
Fig. 11. Effect picture of on-site installation of settlement sensor
Fig. 12. Tilt sensor layout diagram
Fig. 13. Effect picture of on-site installation of tilt sensor
Fig. 14. Daily data statistics of a temperature sensor (SW-OU-TE1) in September
Fig. 15. Temperature time history curve in the southwest corner of the corridor
Fig. 16. Daily data statistics of a displacement sensor (B1-ES-RD1) in September
Fig. 17. Relative displacement time history curve of the corridor
Fig. 18. Daily data statistics of a strain sensor (B1-ES-ST1) in September
Fig. 19. Strain time history curve of the corridor
Fig. 20. Daily data statistics of a settlement sensor (WA-SE-ST1) in September
Fig. 21. Settlement time history curve of steel corridor
Fig. 22. Daily data statistics of a tilt sensor (WA-NS-TL1) in September
Fig. 23. Time history curve of the inclination angle of steel corridor
| |||||||||||||||||||||||||||||||||||||||||||||||||||||||||||
Table 1. Measured temperature statistics table
| |||||||||||||||||||||||||||||||||||||||||||||||||||||||||||
Table 2. Part of the measured relative displacement statistics table
| |||||||||||||||||||||||||||||||||||||||||||||||||||||
Table 3. Part of the measured strain statistics table
| |||||||||||||||||||||||||||||||||||
Table 4. Measured settlement statistics
| |||||||||||||||||||||||
Table 5. Measured tilt angle statistics table

Set citation alerts for the article
Please enter your email address
© Copyright 2018-2021 | Chinese Laser Press. All Rights Reserved 沪ICP备15018463号-20