
Weike Gao, Xiaoping Du, Yang Wang, Buyi Yang. Analysis of Influences of Micro-Rough Surface Parameters on Laser Speckle Field[J]. Acta Optica Sinica, 2021, 41(11): 1103001
- Acta Optica Sinica
- Vol. 41, Issue 11, 1103001 (2021)
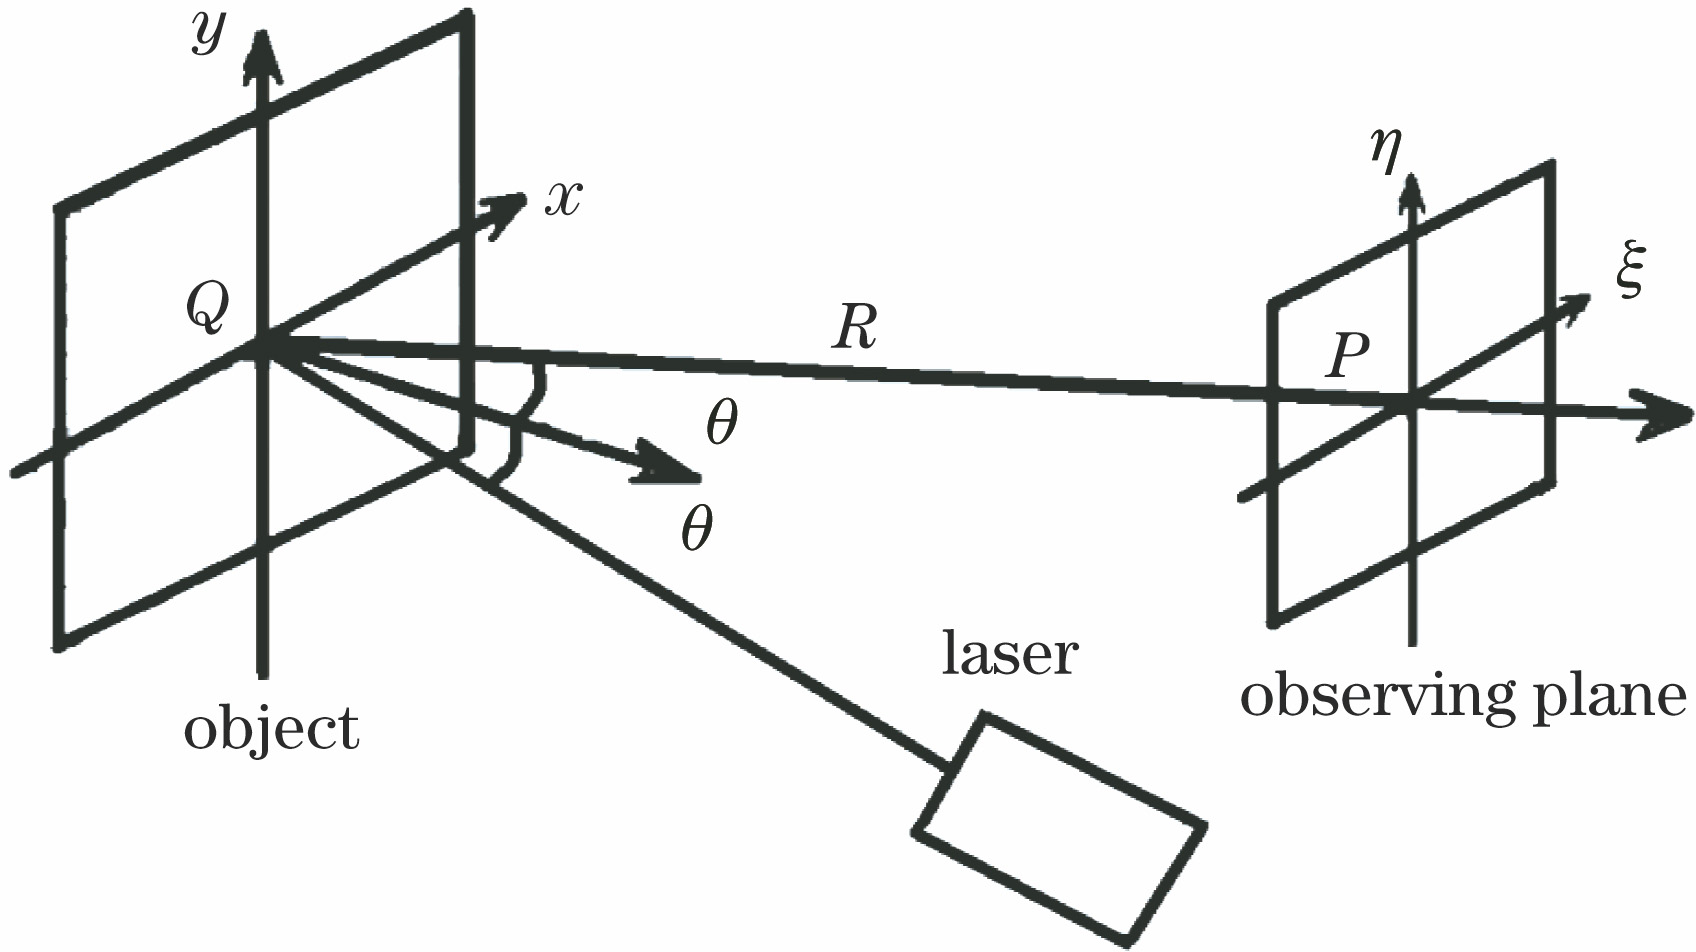
Fig. 1. Schematic diagram of speckle field formation
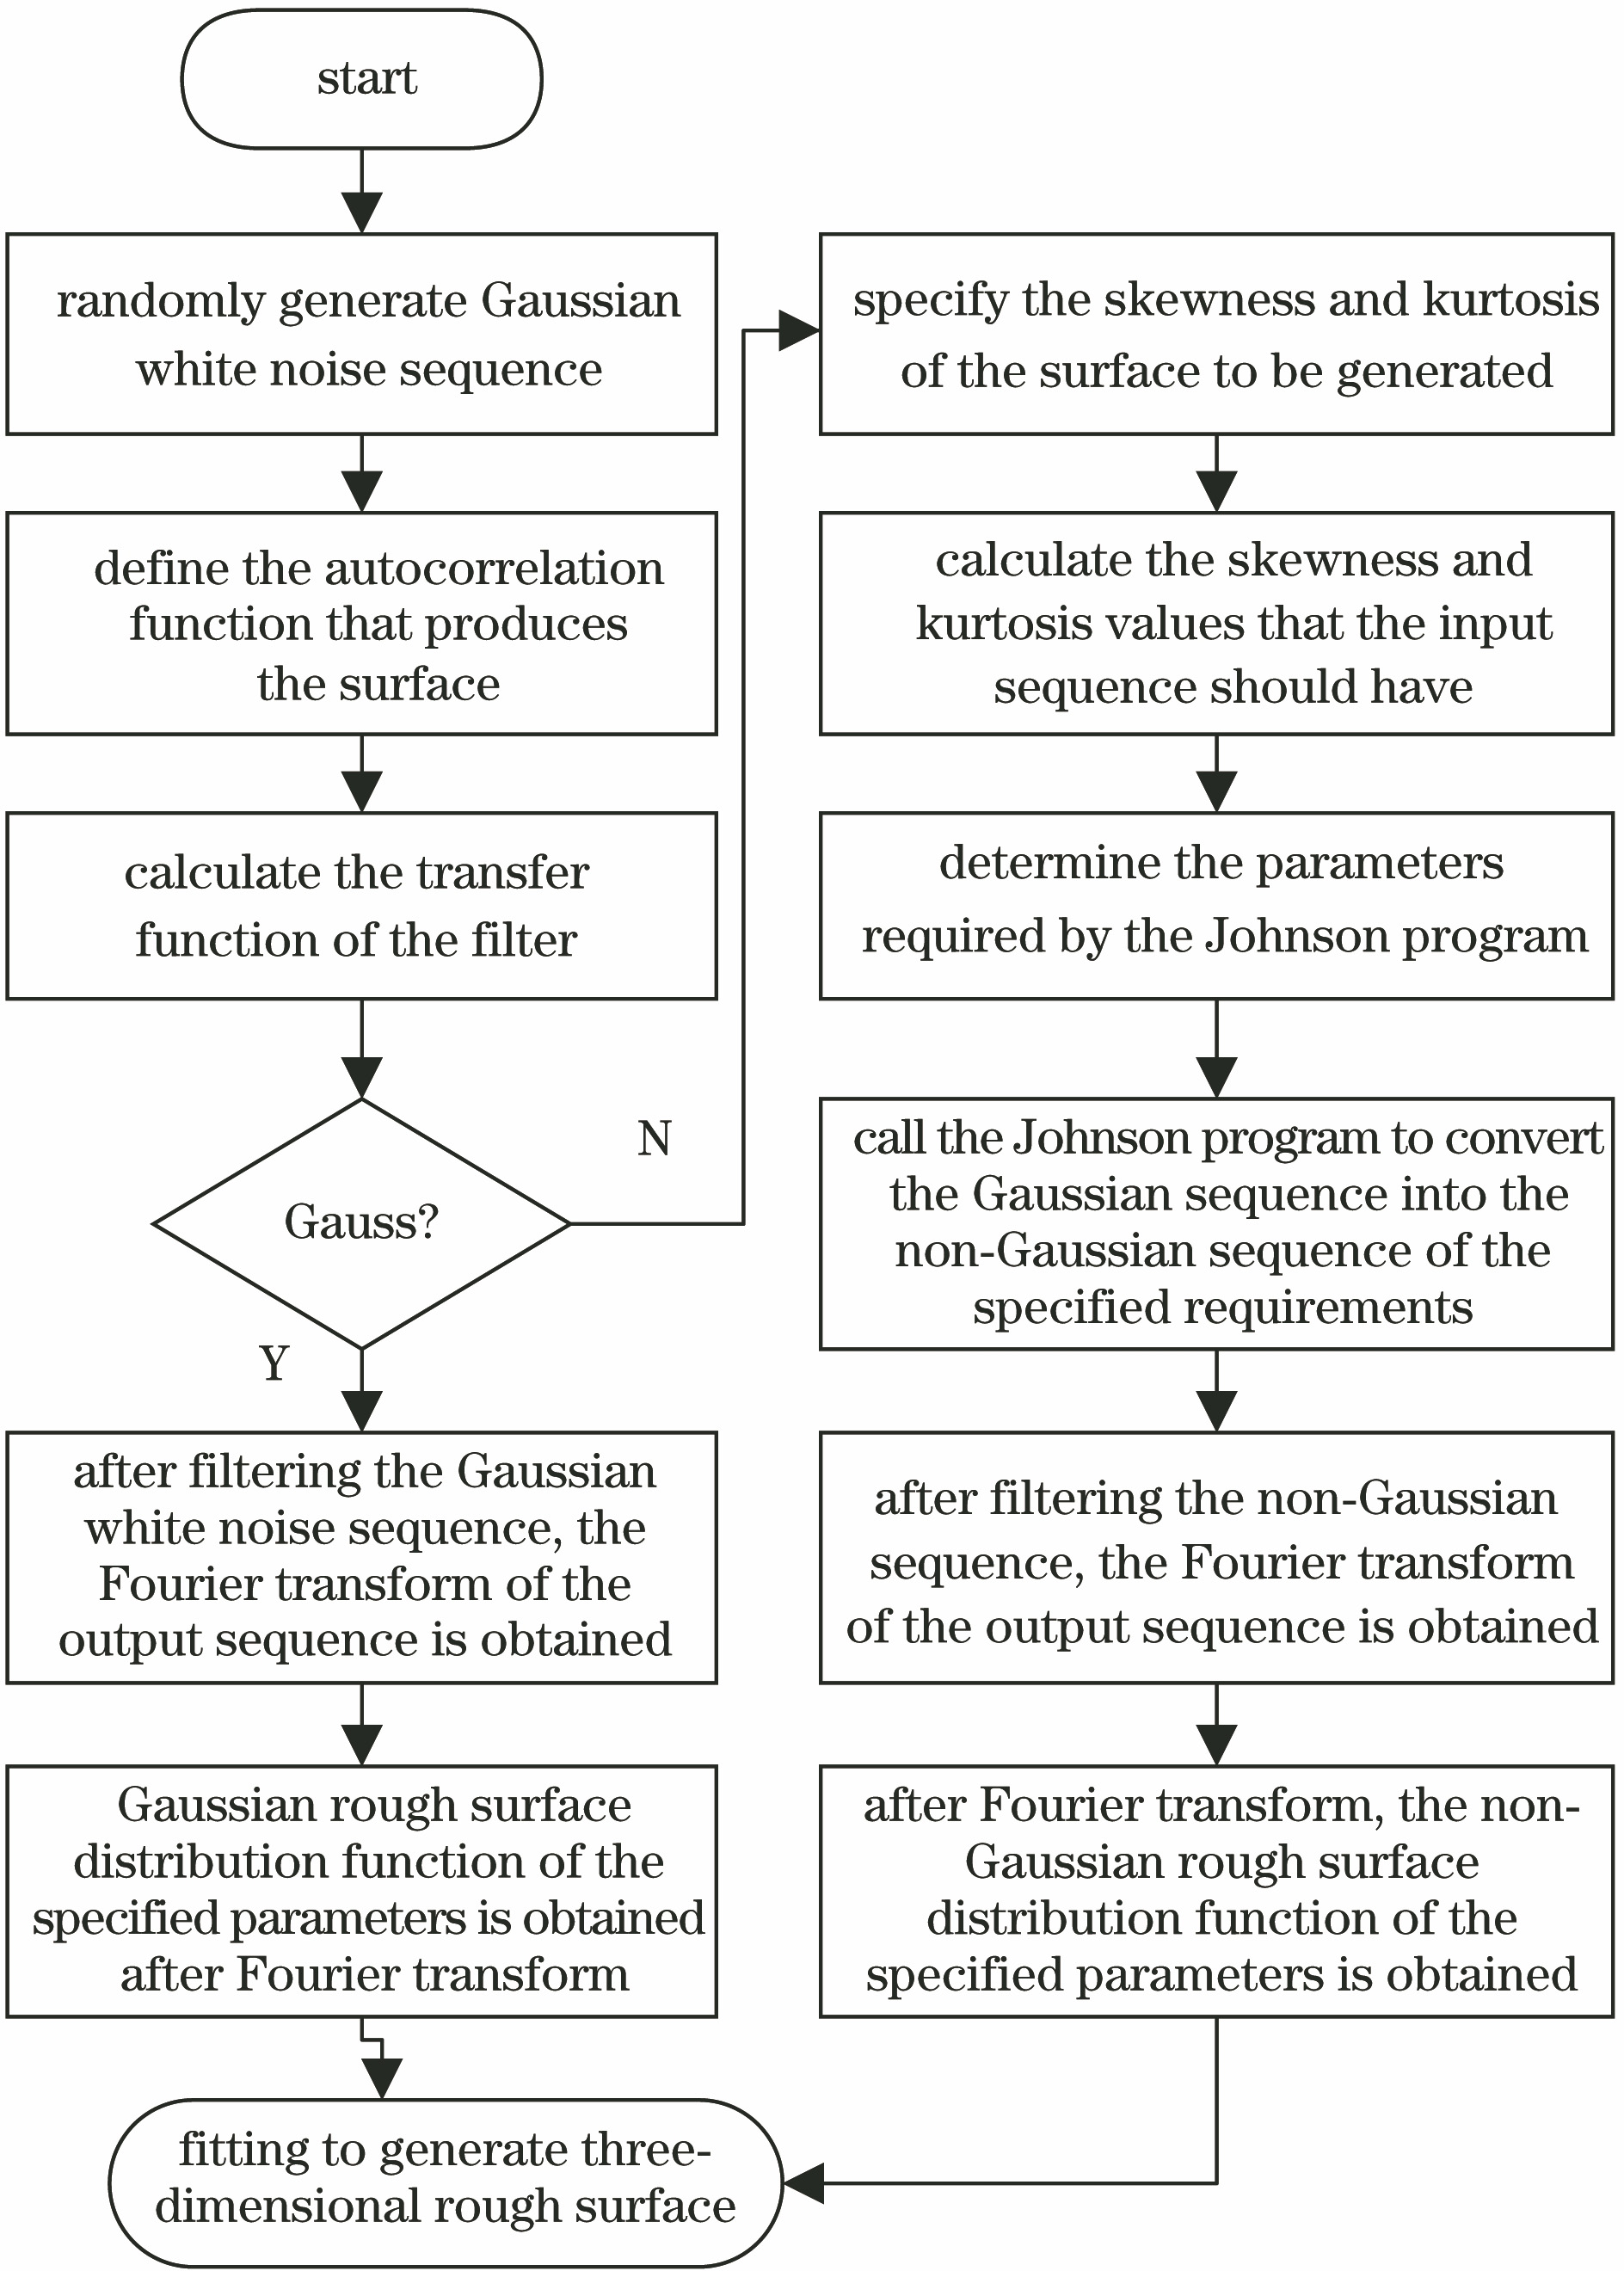
Fig. 2. Flowchart of rough surface simulation
Fig. 3. Schematic diagram of root mean square roughness
Fig. 4. Schematic diagram of skewness
Fig. 5. Schematic diagram of kurtosis
Fig. 6. Setup of laser speckle experiment
Fig. 7. Laser speckle pattern of 0.2 μm sample
Fig. 8. Speckle autocorrelation function
Fig. 9. Probability density distribution function of speckle light intensity of 0.2 μm sample. (a) Experiment; (b) simulation
Fig. 10. Probability density distribution function of speckle light intensity of 0.4 μm sample. (a) Experiment; (b) simulation
Fig. 11. Laser speckle patterns under different root mean square roughness. (a) 0.05 μm; (b) 0.5 μm
Fig. 12. Influences of Gaussian surface parameters on speckle contrast
Fig. 13. Influences of Non-Gaussian surface parameters on speckle contrast. (a) Rms=0.1 μm; (b) Rms=0.2 μm; (c) Rms=0.3 μm; (d) Rms=0.4 μm
Fig. 14. Influence of root mean square roughness on autocorrelation function of speckle
Fig. 15. Influence of correlation length on speckle autocorrelation function
Fig. 16. Two random rough surfaces with different correlation lengths. (a) 0.3 mm; (b) 3.0 mm
Fig. 17. Influences of non-Gaussian surface parameters on autocorrelation function of speckle. (a) Rms=0.1 μm, Sk=-0.5; (b) Rms=0.1 μm, Sk=0; (c) Rms=0.1 μm, Sk=0.5; (d) Rms=0.3 μm, Sk=-0.5; (e) Rms=0.3 μm, Sk=0; (f) Rms=0.1 μm, Sk=0.5; (g) Rms=0.5 μm, Sk=-0.5; (h) Rms=0.5 μm, Sk=0; (i) Rms=0.5 μm, Sk=0.5
Fig. 18. Influence of root mean square roughness on probability distribution function of light intensity
Fig. 19. Influence of correlation length on probability distribution function of light intensity
Fig. 20. Influences of non-Gaussian surface parameters on probability distribution function of speckle intensity. (a) Rms=0.1 μm, Sk=-0.5; (b) Rms=0.1 μm, Sk=0; (c) Rms=0.1 μm, Sk=0.5; (d) Rms=0.3 μm, Sk=-0.5; (e) Rms=0.3 μm, Sk=0; (f) Rms=0.1 μm, Sk=0.5; (g) Rms=0.5 μm, Sk=-0.5; (h) Rms=0.5 μm, Sk=0; (i) Rms=0.5 μm, Sk=0.5
|
Table 1. Characteristic parameters of micro rough surface blocks
|
Table 2. Laser speckle contrast
| ||||||||||||||||||||||||||||||||||||||||||||||||||||||||||||||||||||||||||||||||
Table 3. Parameter combinations of Gaussian rough surface
| ||||||||||||||||||||||||||||||||||||||||||||||||||||||||||||||||||||||||||||||||
Table 4. Parameter combinations of non-Gaussian rough surface
| ||||||||||||||||||||||||||||
Table 5. Influences of rough surface parameters on statistical characteristics of speckles

Set citation alerts for the article
Please enter your email address
© Copyright 2018-2021 | Chinese Laser Press. All Rights Reserved 沪ICP备15018463号-20