
Mengli Liu, Hongbo Wu, Ximei Liu, Yaorong Wang, Ming Lei, Wenjun Liu, Wei Guo, Zhiyi Wei. Optical properties and applications of SnS2 SAs with different thickness[J]. Opto-Electronic Advances, 2021, 4(10): 200029-1
- Opto-Electronic Advances
- Vol. 4, Issue 10, 200029-1 (2021)
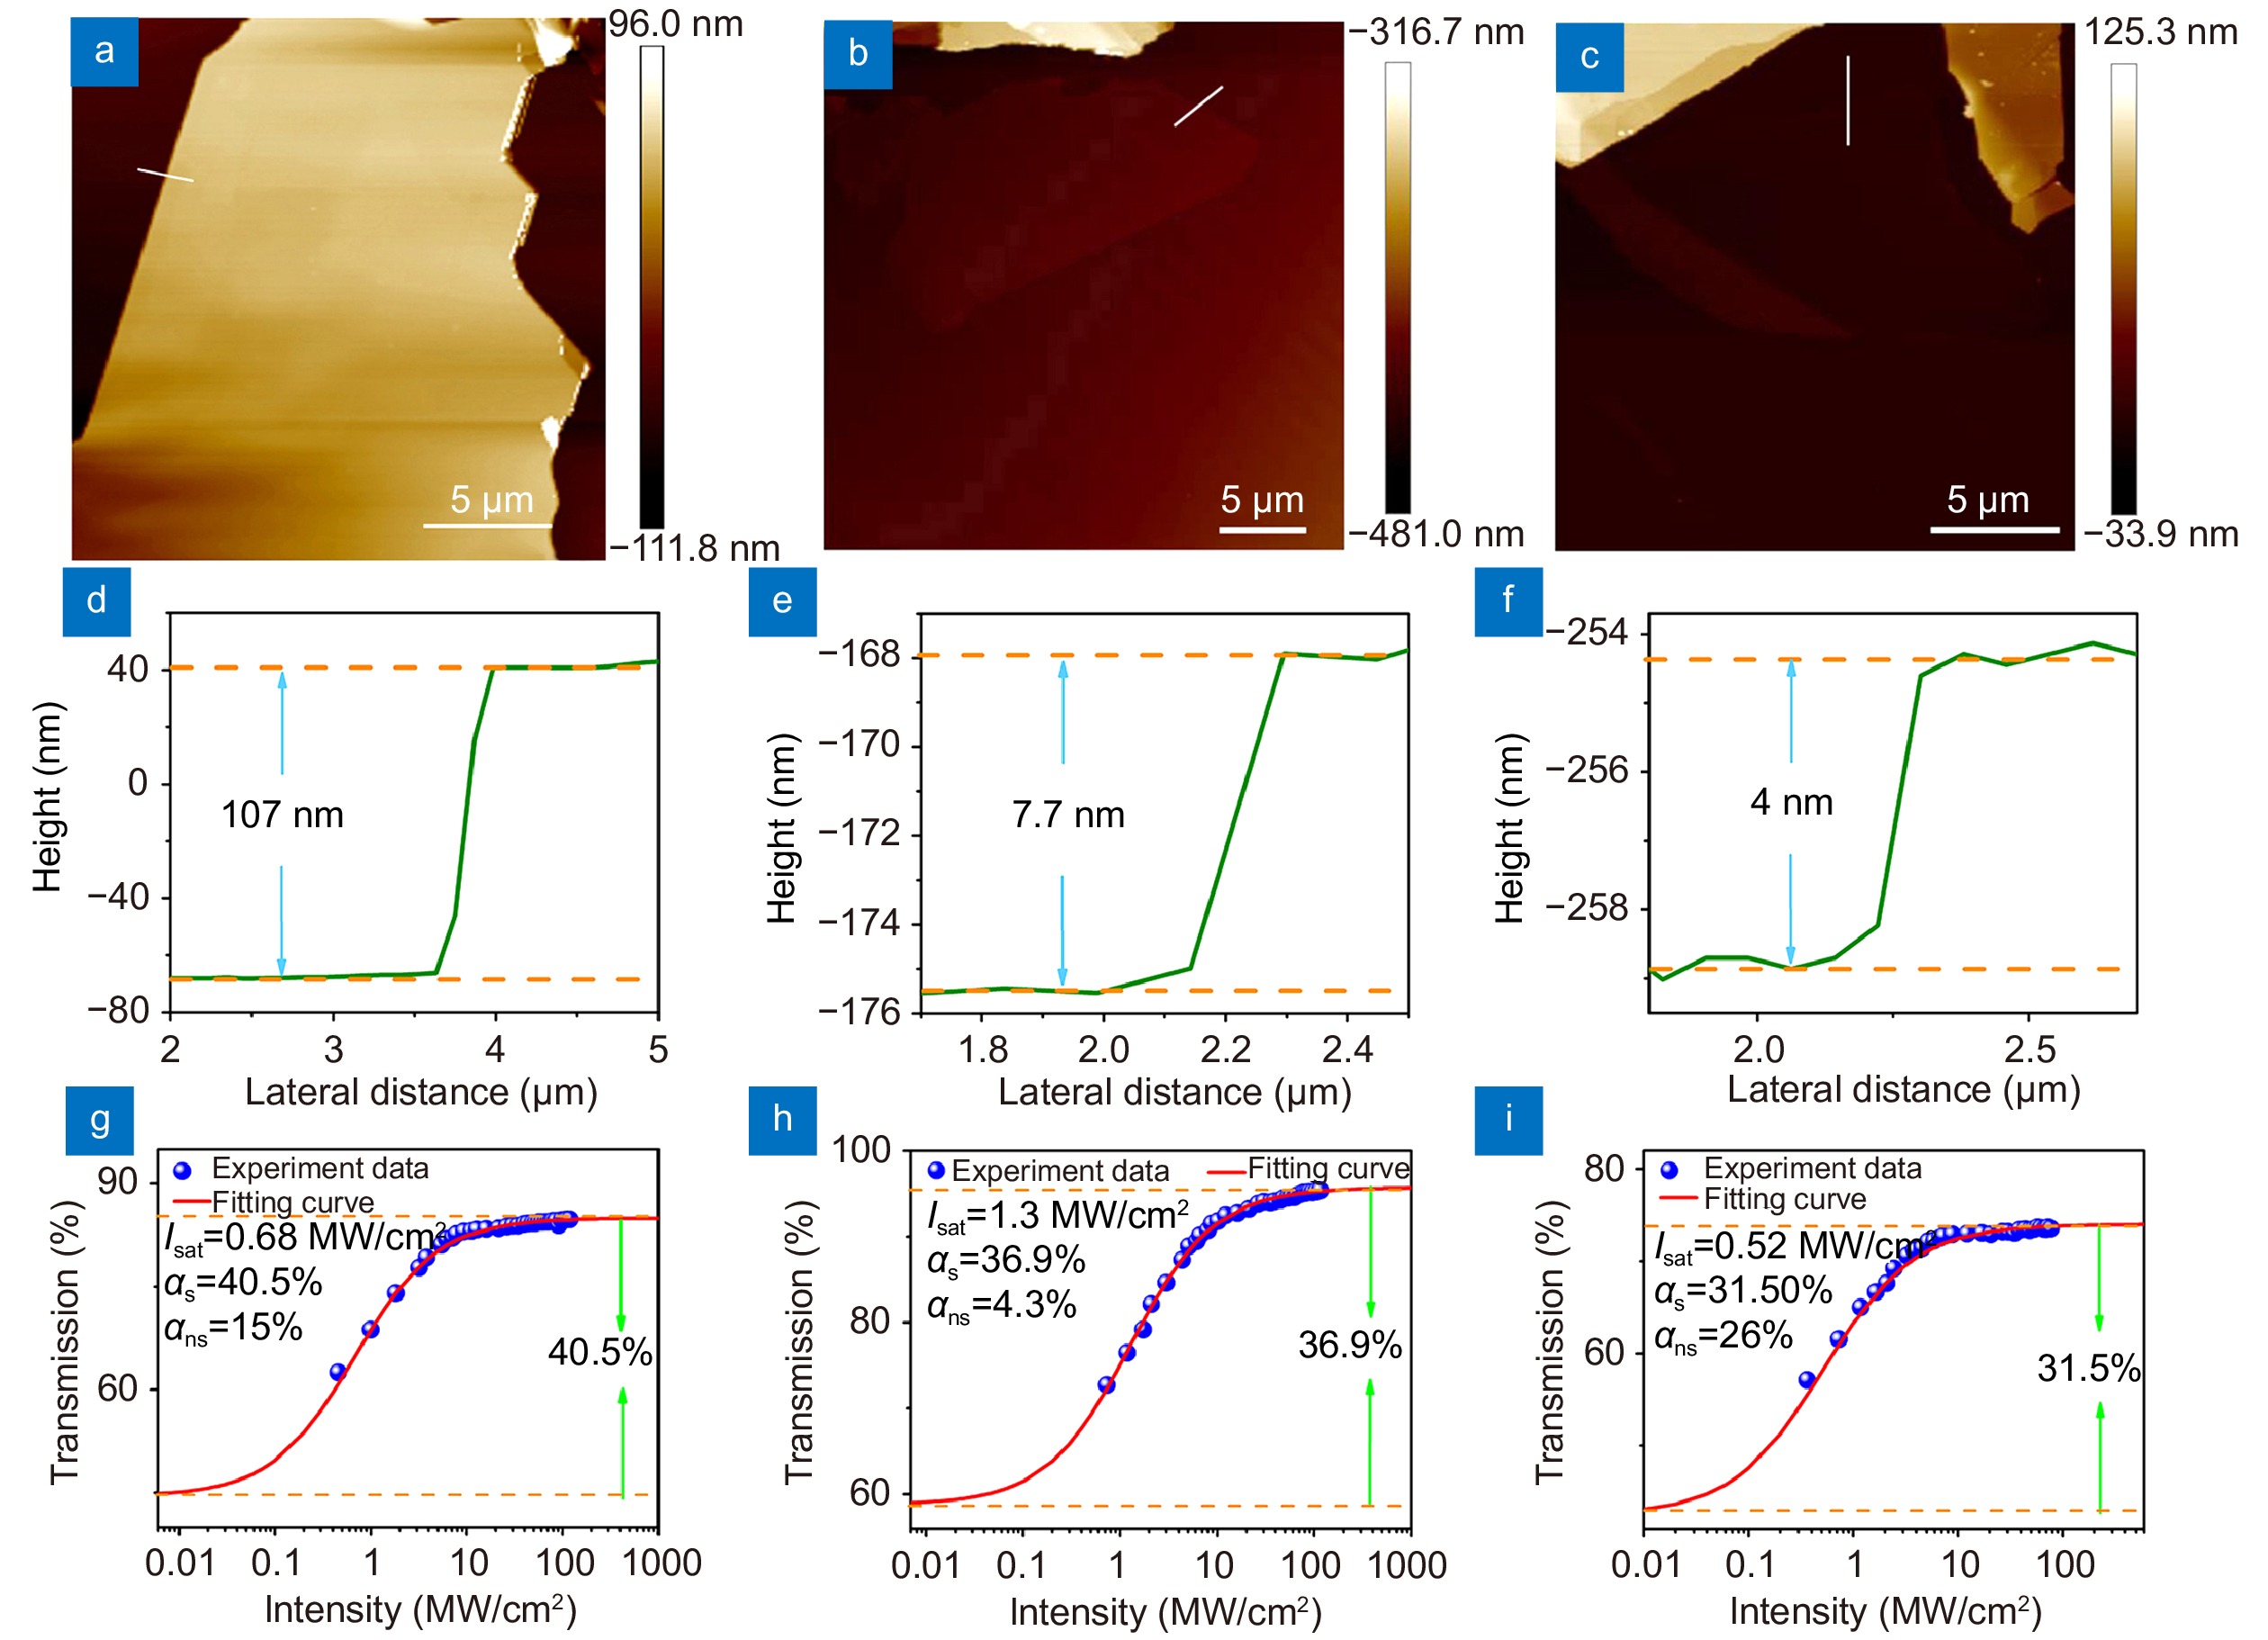
Fig. 1. Characterization of materials. The AFM image, thickness and nonlinear absorption of (a, d, g )107 nm-SnS2 SA, (b, e, h )7.7 nm-SnS2 SA, (c, f, i )4 nm-SnS2 SA.
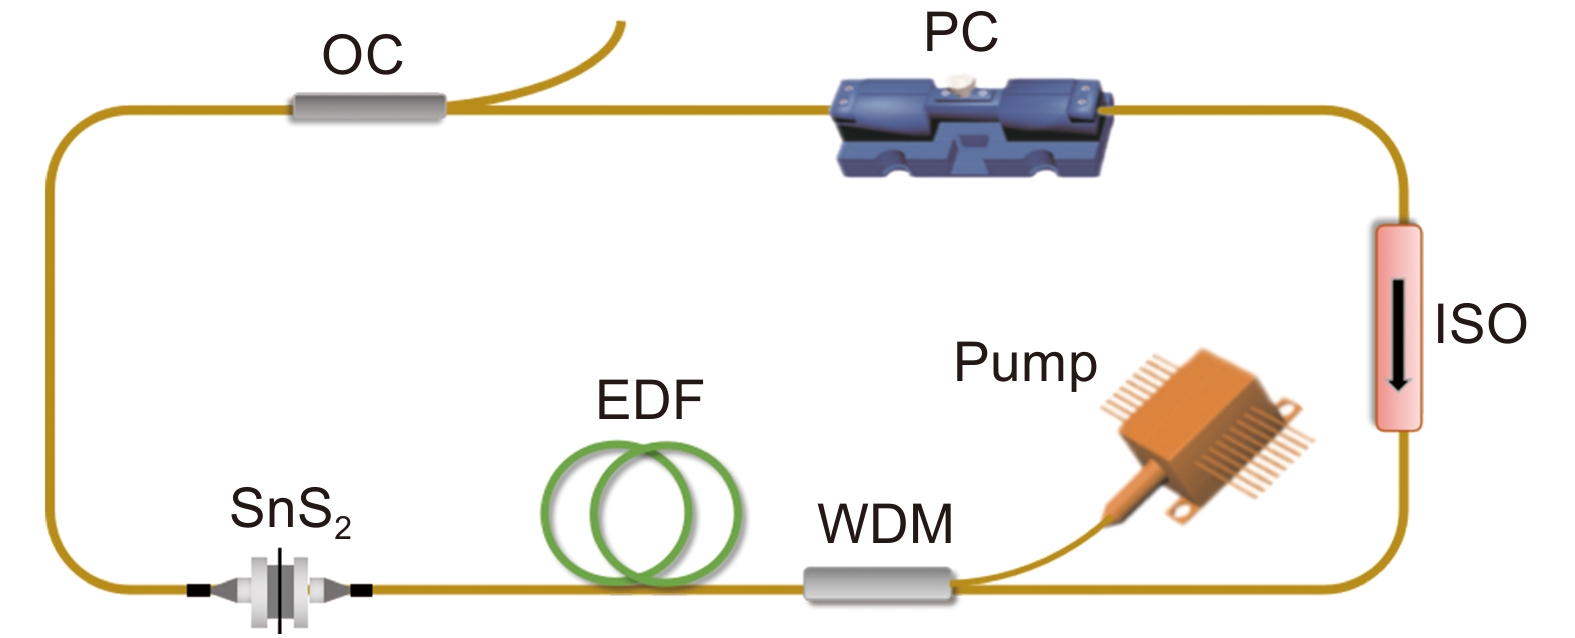
Fig. 2. The simplified representation of QSFL based on SnS2.
Fig. 3. The function of the QSFL based on 107 nm-SnS2 SA. (a ) The τ of a single pulse. (b ) RF spectrum (illustration: RF spectrum within a bandwidth of 2 MHz). (c ) Emission spectrum. (d ) The monitoring of P out within 8 hours. (e ) Variation of τ and F rep as functions of P pump. (f ) Variation of P out and E p as functions of P pump.
Fig. 4. The performance of the QSFL based on 7.7 nm-SnS2 SA. (a ) The τ of a single pulse. (b ) The monitoring of P out within 8 hours. (c ) Variation of τ and F rep as functions of P pump. (d ) Variation of P out and E p as functions of P pump.
Fig. 5. The performance of the QSFL based on 4 nm-SnS2 SA. (a ) The τ of a single pulse. (b ) The monitoring of P out within 8 hours. (c ) Variation of τ and F rep as functions of P pump. (d ) Variation of P out and E p as functions of P pump.
Fig. 6. The DFT calculated deformation potential limited electron mobility along kx direction of SnS2 vs. the number of SnS2 layers.
|
Table 1. The performance of three different QSFLs adopting distinct SA.
|
Table 2. Comparison of QSFL based on various SAs.
|
Table 3. The intrinsic carrier concentration (kx ) of SnS2 vs. the number of SnS2 layers.

Set citation alerts for the article
Please enter your email address
© Copyright 2018-2021 | Chinese Laser Press. All Rights Reserved 沪ICP备15018463号-20