1State Key Laboratory for Mesoscopic Physics and Frontiers Science Center for Nano-optoelectronics, School of Physics, Peking University, Beijing 100871, China
2Key Laboratory of Quantum Information, University of Science and Technology of China, Hefei 230026, China
3Collaborative Innovation Center of Extreme Optics, Shanxi University, Taiyuan 030006, China
4Department of Electronic and Information Engineering, Shenzhen Graduate School, Harbin Institute of Technology, Shenzhen 518055, China
5Peking University Yangtze Delta Institute of Optoelectronics, Nantong 226010, China
Yan-Jun Qian, Qi-Tao Cao, Shuai Wan, Yu-Zhong Gu, Li-Kun Chen, Chun-Hua Dong, Qinghai Song, Qihuang Gong, Yun-Feng Xiao, "Observation of a manifold in the chaotic phase space of an asymmetric optical microcavity," Photonics Res. 9, 364 (2021)
Copy Citation Text
Chaotic dynamics in optical microcavities, governed dominantly by manifolds, is of great importance for both fundamental studies and photonic applications. Here, we report the experimental observation of a stable manifold characterized by energy and momentum evolution in the nearly chaotic phase space of an asymmetric optical microcavity. By controlling the radius of a fiber coupler and the coupling azimuth of the cavity, corresponding to the momentum and position of the input light, the injected light can in principle excite the system from a desired position in phase space. It is found that once the input light approaches the stable manifold, the angular momentum of the light experiences a rapid increase, and the energy is confined in the cavity for a long time. Consequently, the distribution of the stable manifold is visualized by the output power and the coupling depth to high- modes extracted from the transmission spectra, which is consistent with theoretical predictions by the ray model. This work opens a new path to understand the chaotic dynamics and reconstruct the complex structure in phase space, providing a new paradigm of manipulating photons in wave chaos.
1. INTRODUCTION
Chaos, a dynamical behavior with hypersensitivity to initial conditions, is widely studied in both classical and quantum physics [1–3]. As a prominent chaotic system, asymmetric optical microcavities have drawn much attention in diverse fields such as dynamical tunneling [4–8], optical chirality [9–12], and non-Hermitian physics [13–15]. So far, many high-performance optical devices have been promoted, including random lasers [16,17], nanoparticle sensing [18,19], and broadband optical collection [20–23]. Among these fundamental studies and practical applications, chaotic dynamics plays a pivotal role in manipulations of photon evolution in asymmetric microcavities, which is governed dominantly by manifold structures in position–momentum phase space [3,24].
Over the past decades, much effort has been devoted to exploring the manifold effects in asymmetric optical microcavities [24–33]. The manifolds have been experimentally investigated by the output from regular modes to the leaky region in an asymmetric cavity, i.e., far-field laser emission [24,33–35], or inversely, by monitoring the efficiency of free-space pumping [6,30–32]. However, all these experiments are conducted in the leaky region, while the intermediate chaotic dynamics between regular modes and the leaky region is treated as a “black box,” in which the structures of manifolds are still elusive in experiments. Different from the leaky region, the intermediate region involves much richer physical processes such as scarred modes [36–38], resonance-assisted tunneling [39–41], and turnstile transport [30,33]. Hence, the illustration of manifold structures in this “black box” is important and promising for more physical research and photonic applications.
In this paper, for the first time, we open this “black box” by scanning the phase space for a high- optical asymmetric microcavity and observe the structure of the stable manifold. Experimentally, a nanofiber is used to continuously regulate the Birkhoff coordinates of the input light in the phase space. When the light is injected into the region with the stable manifold, the intracavity energy is confined for a long time, and its angular momentum increases rapidly. According to the evolution of the light energy and angular momentum extracted from the transmission spectra, the stable manifold is visualized in both numerical simulations and experiments.
Sign up for Photonics Research TOC. Get the latest issue of Photonics Research delivered right to you!Sign up now
2. RAY-MODEL SKETCH
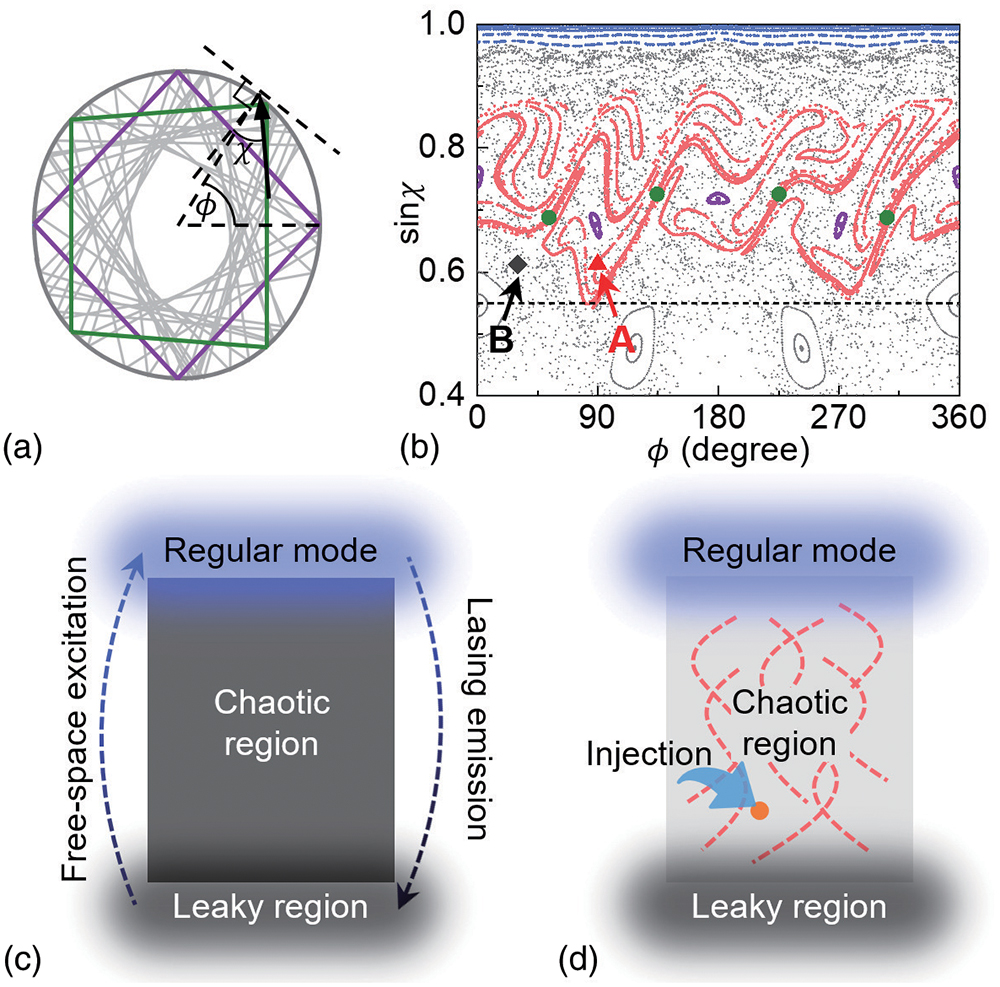
Figure 1.(a) Chaotic ray dynamics in an asymmetric microcavity in real space. Green lines and purple lines are unstable four-period orbit and stable four-period orbit, respectively. : azimuthal angle. : incident angle. (b) The phase space of the chaotic microcavity. Blue points: KAM curves. Green dots: four-period unstable orbit. Purple dots: four-period stable orbit. Red points: stable manifold. Black dashed line: critical line. Point A: (90°, 0.61), near the stable manifold in the chaotic region. Point B: (30°, 0.61), in the chaotic region away from the stable manifold. (c) Investigation of the chaotic dynamics by lasing emission or free-space coupling between regular mode and leaky region, where the chaotic region is treated as a “black box.” (d) Probing the stable manifold by precisely controlling the injection position in phase space.
Figure 2.(a) Angular momentum sin versus reflection times starting from point A and point B as shown in Fig. 1(b). (b) Maximal angular momentum sin distribution within 50 reflections by the ray model. Gray dots: stable manifold of the four-period unstable orbit. (c) Energy intensity versus reflection times starting from point A and point B. (d) Intracavity energy distribution within 50 reflections by the ray model.
Figure 3.(a) Schematic illustration of the fiber–cavity coupling setup. Inset: scanning electron microscope image of the fiber with a diameter of . (b) Typical experimental transmission spectra at different azimuthal angles (, 60°, 90°) with nanofiber diameter of 415 nm. The right panel is the zoom-in blue shadow in the spectra. The dashed line marks a same high- mode. The coupling depth is denoted by .
By scanning the wavelength of input light from 773 to 776 nm, the typical transmission spectra normalized by input power are obtained at three azimuthal angles (, 60°, 90°) with the nanofiber diameter of 415 nm, as shown in Fig. 3(b). It is found that the spectra present two distinct features compared with that of conventional WGM coupling [49,50]: (i) the output power is mostly weaker than the input power, and (ii) the transmission spectra strongly depend on the azimuthal angles. The weak output is attributed to the fact that when the nanofiber is contacted to the cavity, the input light is mostly refracted into the cavity and may subsequently experience extra refractive loss before coupling back to the nanofiber. Hence, the intracavity energy can be characterized by the output power from the end of the nanofiber. Moreover, by experimentally initializing the input light at different positions in phase space, the light experiences distinct intracavity evolution, and the spectra exhibit strong dependences on azimuthal angles. For instance, the transmission spectrum of [corresponding to point A in Fig. 1(b)] is higher than that of [corresponding to point B in Fig. 1(b)], indicating the existence of the stable manifold therein as predicted by the ray model.
4. RESULTS AND ANALYSES
Figure 4.(a), (b) Experimental output power (gray histograms) versus the excitation azimuthal angles in experiments with nanofiber diameters of 415 nm and 530 nm, respectively. The waterfall plots present corresponding intracavity energy by the ray model. (c) Intracavity energy distribution by the modified ray model. Gray points: stable manifold. The black dashed line I (II) marks the corresponding experimental position, i.e., fiber diameters of 415 nm (530 nm), in phase space. (d) Distribution of the output power obtained by 2D-FDTD simulations, covering the same region as (c).
Note here we employ a modified ray model to obtain Fig. 4(c) from Fig. 2(d) considering the wave diffusion. In the wave optics regime, the initial state of the input light is not a single point but approximately a 2D Gaussian distribution, and thus the intracavity energy and maximum sin need to be modified. The formula of Gaussian distribution versus a given initial point (, sin ) is presented as follows: where and obtained by the simulation of a cavity with experimental size (μ). The modified distribution of the intracavity energy is calculated as follows:
Compared with the modified intracavity energy [waterfall plots in Figs. 4(a) and 4(b)] by the ray model, the experimental output power behaves as a similar distribution and thus can be used for the probe of the stable manifold. When the diameter is 415 nm, the output power in measurements [gray histograms in Fig. 4(a)] manifests one main peak around , where the stable manifold lies. In contrast, the output power is much weaker in the region away from the stable manifold. When it comes to the fiber diameter of 530 nm, the output power [gray histograms in Fig. 4(b)] becomes stronger on the whole, due to the increasing overlap between line II and the stable manifold. Notice that the experimental output still presents a peak around 90° despite the absence of the stable manifold. This counterintuitive phenomenon arises from the fact that a four-period island structure exists around (90°, 0.61), resulting in energy localization and low refractive loss [7,34,48,51].
Numerically, we conduct the two-dimensional finite-difference time-domain (2D-FDTD) simulations, covering the region with and . The parameters in the simulation are set the same as those used in experiments (μ), but in a two-dimensional model due to the limitation of computing resources. By controlling the coupling azimuthal angle (coupler size), the coordinate () is scanned with a step of 6° (0.01). The averaged output power under different input conditions is plotted in Fig. 4(d), exhibiting the consistent pattern compared with the stable manifold as well as the intracavity energy distribution by the ray model [Fig. 4(c)].
Besides the energy evolution, the stable manifold is also visualized by angular momentum transformation, which can be characterized by the transmission spectra of high- regular modes. As shown in Fig. 1(d), the high- regular modes are established by the following three steps: (i) injection of the light into the cavity; (ii) the angular momentum transformation of the light in the chaotic region [Fig. 2(a)] [20]; and (iii) dynamical tunneling into the KAM curves and forming high- WGMs [6,8]. When the injection lies near the stable manifold, the angular momentum of the light can experience a rapid increase, resulting in the stronger coupling to high- modes, which is confirmed by comparing the coupling depth at and in Fig. 3(b).
Figure 5.(a), (b) Experimental coupling depth of high- modes (gray histograms) versus the excitation azimuthal angles in experiments with nanofiber diameters of 415 and 530 nm and corresponding (waterfall plots) obtained in the ray model. (c) Modified distribution magnified from Fig. 2(b). (d) Distribution of the coupling depth of high- modes extracted from 2D-FDTD simulations, covering the same region as (c).
For the diameter of the fiber being 415 nm, it is found that the stronger coupling occurs around , manifesting the existence of the stable manifold, which also agrees with the results of energy evolution. When the fiber diameter is chosen as 530 nm, four peaks arise around 33°, 63°, 108°, and 150°, depicting the distribution of the stable manifold along line II in Fig. 5(c). Note that here a valley appears around 90°, which is attributed to the localization effect of the island structure. Additionally, the is also plotted in Figs. 5(a) and 5(b), presenting the same behavior as the experimental coupling depths of high- modes. By performing the 2D-FDTD simulation, the coupling depth of high- modes from spectra is also investigated, shown in Fig. 5(d). The simulation setting is the same as that in Fig. 4(d), and eight cavity modes with are selected, which are confirmed as WGM-like regular modes by the simulated field distributions. It is found that the coupling depth distribution by simulations [Fig. 5(d)] exhibits good agreement with the sin distribution by the ray model [Fig. 5(c)]. Consequently, by applying this numerical dense sampling, the quasi-continuous distribution of the stable manifold within the region and is traced out by the high contrast of the coupling depth.
5. CONCLUSION
Up to now, we have demonstrated the observation of the stable manifold in simulations and experiments. On the one hand, the stable manifold can be clearly depicted in the ray model [see Figs. 2(b) and 2(d)], but wave effects are excluded. On the other hand, the fine structure in phase space is blurred in the wave region, leading to a limited observation resolution both in experiments and simulations [see Figs. 4 and 5]. Meanwhile, the modified ray model employed here combines the ray model and the wave diffusion effect, which presents good agreement with the experimental and simulated results. Considering that the diffused size of input light in phase space negatively relies on the ratio of cavity diameter to wavelength, the resolution for the observation of the stable manifold can be enhanced by decreasing the light wavelength or increasing the cavity size.
To summarize, we demonstrate the observation of the stable manifold in the phase space of an asymmetric microcavity characterized by energy evolution and momentum transformation of the intracavity light. Experimentally, the structure of the stable manifold is depicted by the output power and the coupling depth to high- modes, which is further confirmed by the numerical simulations and ray-model prediction. In addition, we point out that the strategy proposed in our work can be further optimized by taking more detailed effects into consideration, such as the dynamical tunneling process and the impact of the unstable manifold. This characterization of the manifold structures not only experimentally demonstrates the manifold theory but also provides a guidance for regulation of the chaotic dynamics as well as the associated optical properties. This developed experimental method provides a versatile method to study chaotic dynamics and holds great potential for the reconstruction of complex structures in the phase space of a chaotic system. Beyond the fundamental study, the exploration of the chaotic dynamics also provides an approach to control the photon by different initialization of the input light in asymmetric optical microcavities. Considering the abundant physical phenomena happening in the chaotic region, this work can also contribute to advanced photonic applications, such as broadband optical communications [23, 52] and on-chip chaotic neural networks [53].
Acknowledgment
Acknowledgment. The authors thank Y.-Q. Nie, X.-C. Yu, Y.-Y. Li, H.-J. Chen, J.-H. Chen, D. Xu, S.-J. Tang, P.-J. Zhang, and L. Yao for helpful discussions. This work was partially carried out at the USTC Center for Micro and Nanoscale Research and Fabrication, and the High-Performance Computing Platform of Peking University.
References
[1] R. C. Hilborn. Chaos and Nonlinear Dynamics: An Introduction for Scientists and Engineers(2000).
[2] M. C. Gutzwiller. Chaos in Classical and Quantum Mechanics(2013).
[15] C.-H. Yi, J. Kullig, M. Hentschel, J. Wiersig. Non-Hermitian degeneracies of internal–external mode pairs in dielectric microdisks. Photon. Res., 7, 464-472(2019).
[17] S. Bittner, K. Kim, Y. Zeng, Q. J. Wang, H. Cao. Spatial structure of lasing modes in wave-chaotic semiconductor microcavities. New J. Phys., 22, 083002(2020).