• Photonics Research
  • Vol. 7, Issue 11, B73 (2019)
C. Trager-Cowan1、*, A. Alasmari1, W. Avis1, J. Bruckbauer1, P. R. Edwards1, B. Hourahine1, S. Kraeusel1, G. Kusch1, R. Johnston1, G. Naresh-Kumar1, R. W. Martin1, M. Nouf-Allehiani1, E. Pascal1, L. Spasevski1, D. Thomson1, S. Vespucci1, P. J. Parbrook2, M. D. Smith2, J. Enslin3, F. Mehnke3, M. Kneissl3、4, C. Kuhn3, T. Wernicke3, S. Hagedorn4, A. Knauer4, V. Kueller4, S. Walde4, M. Weyers4, P.-M. Coulon5, P. A. Shields5, Y. Zhang6, L. Jiu6, Y. Gong6, R. M. Smith6, T. Wang6, and A. Winkelmann1、7
Author Affiliations
  • 1Department of Physics, SUPA, University of Strathclyde, Glasgow G4 0NG, UK
  • 2Tyndall National Institute, University College Cork, Cork T12 R5CP, Ireland
  • 3Institute of Solid State Physics, Technische Universität Berlin, 10623 Berlin, Germany
  • 4Ferdinand-Braun-Institut, Leibniz-Institut für Höchstfrequenztechnik, 12489 Berlin, Germany
  • 5Department of Electronic and Electrical Engineering, Centre of Nanoscience & Nanotechnology, University of Bath, Bath BA2 7AY, UK
  • 6Department of Electronic and Electrical Engineering, University of Sheffield, Sheffield S1 3JD, UK
  • 7Laser Components Department, Laser Zentrum Hannover e.V., 30419 Hannover, Germany
  • show less
    DOI: 10.1364/PRJ.7.000B73 Cite this Article Set citation alerts
    C. Trager-Cowan, A. Alasmari, W. Avis, J. Bruckbauer, P. R. Edwards, B. Hourahine, S. Kraeusel, G. Kusch, R. Johnston, G. Naresh-Kumar, R. W. Martin, M. Nouf-Allehiani, E. Pascal, L. Spasevski, D. Thomson, S. Vespucci, P. J. Parbrook, M. D. Smith, J. Enslin, F. Mehnke, M. Kneissl, C. Kuhn, T. Wernicke, S. Hagedorn, A. Knauer, V. Kueller, S. Walde, M. Weyers, P.-M. Coulon, P. A. Shields, Y. Zhang, L. Jiu, Y. Gong, R. M. Smith, T. Wang, A. Winkelmann. Scanning electron microscopy as a flexible technique for investigating the properties of UV-emitting nitride semiconductor thin films[J]. Photonics Research, 2019, 7(11): B73 Copy Citation Text show less
    ECCI micrograph from AlGaN thin film.
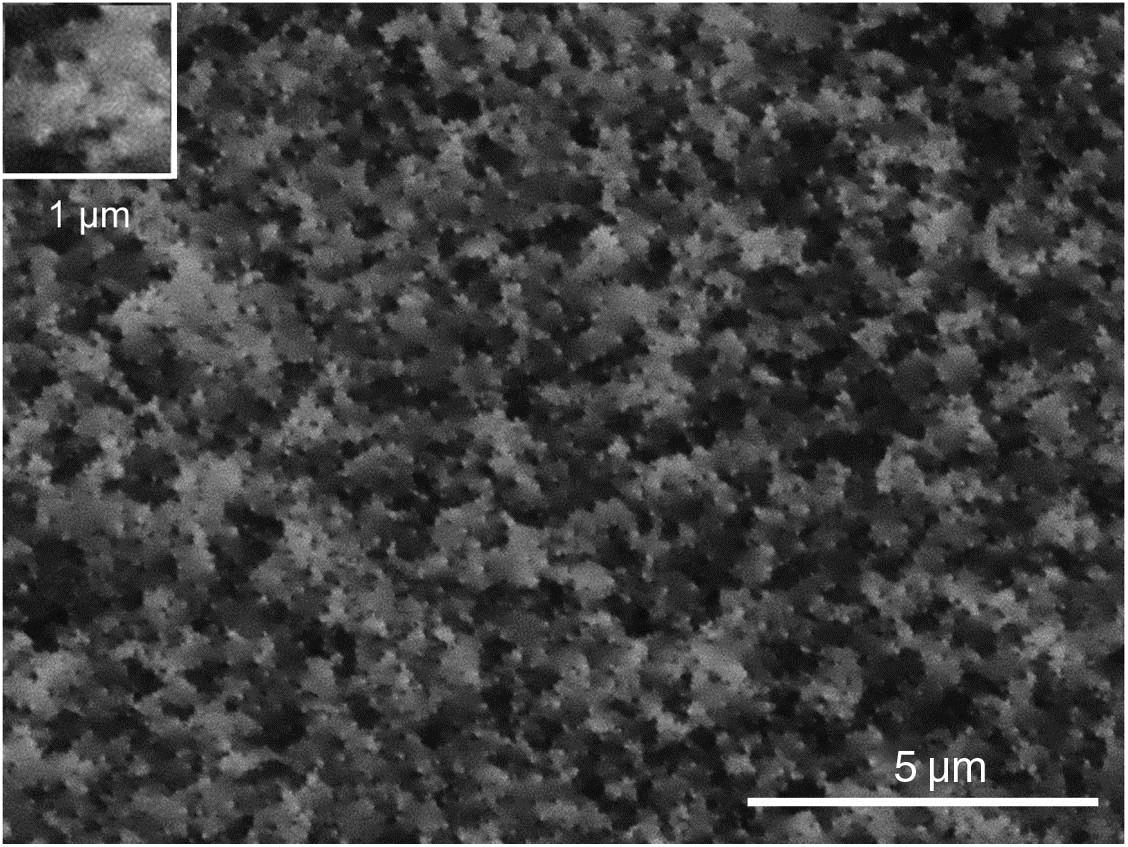
    Fig. 1. ECCI micrograph from AlGaN thin film.
    (a) SE image of nPSS, (b) schematic of overgrowth of AlN on nPSS, and (c) ECCI micrograph from an AlN thin film. Inset is on the same scale but with higher resolution.
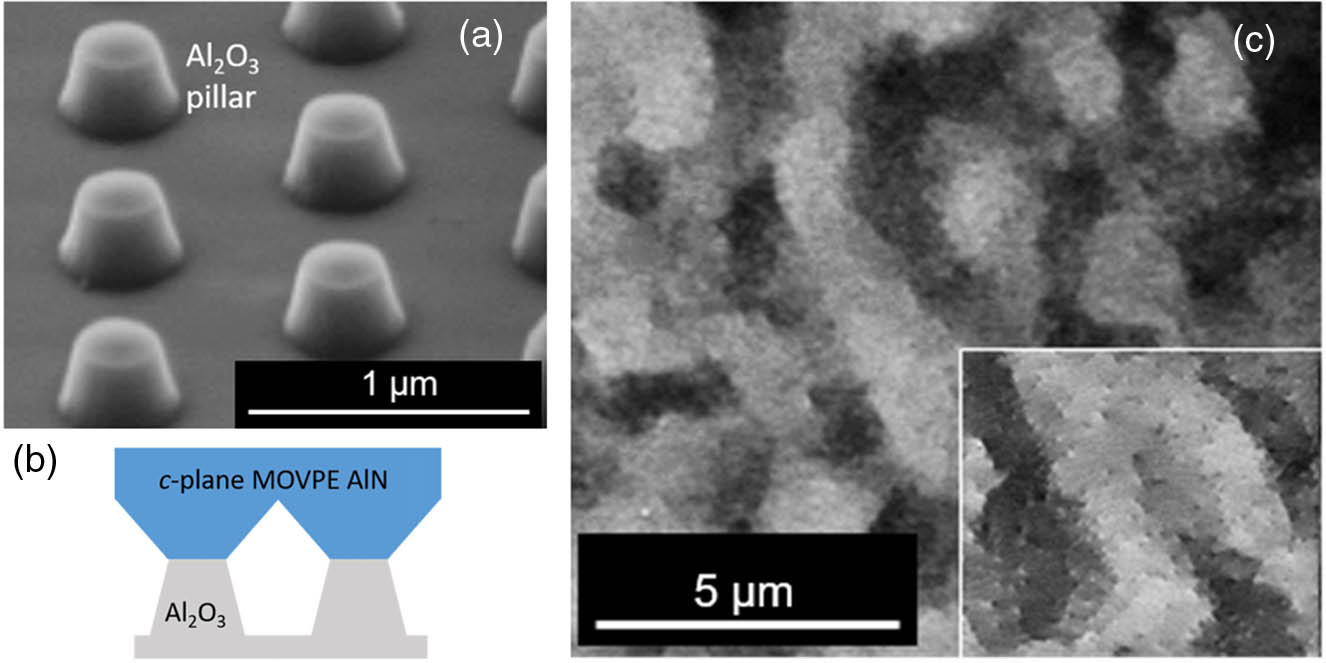
    Fig. 2. (a) SE image of nPSS, (b) schematic of overgrowth of AlN on nPSS, and (c) ECCI micrograph from an AlN thin film. Inset is on the same scale but with higher resolution.
    EBSD maps from the AlN/nPSS thin film: (a) grain reference orientation deviation (GROD) map and (b) GROD axis map relative to the sample normal (c-axis, [0001] direction]) where the colors denote direction of in-plane rotation (i.e., around the c-axis). The red regions are rotated in the opposite direction to the blue regions as indicated.
    Fig. 3. EBSD maps from the AlN/nPSS thin film: (a) grain reference orientation deviation (GROD) map and (b) GROD axis map relative to the sample normal (c-axis, [0001] direction]) where the colors denote direction of in-plane rotation (i.e., around the c-axis). The red regions are rotated in the opposite direction to the blue regions as indicated.
    (a) Schematic of semi-polar GaN microrod template and overgrowth, indicating the distribution of stacking faults on the surface of the sample and the crystallographic directions. (b) ECCI micrograph revealing stacking faults. (c) Example CL spectra from a dark stripe and a bright stripe, respectively. The boxes on (d) indicate where the spectra were extracted from the CL dataset. (d) Integrated CL intensity image of the GaN near band edge (NBE) emission (3.15–3.50 eV) on the same scale as (e) but not from the same area. (e) Higher resolution ECCI micrograph revealing dislocations. (f) Integrated CL intensity image of the GaN near band edge (NBE) emission (3.15–3.50 eV) on the same scale as (e) but not from the same area.
    Fig. 4. (a) Schematic of semi-polar GaN microrod template and overgrowth, indicating the distribution of stacking faults on the surface of the sample and the crystallographic directions. (b) ECCI micrograph revealing stacking faults. (c) Example CL spectra from a dark stripe and a bright stripe, respectively. The boxes on (d) indicate where the spectra were extracted from the CL dataset. (d) Integrated CL intensity image of the GaN near band edge (NBE) emission (3.15–3.50 eV) on the same scale as (e) but not from the same area. (e) Higher resolution ECCI micrograph revealing dislocations. (f) Integrated CL intensity image of the GaN near band edge (NBE) emission (3.15–3.50 eV) on the same scale as (e) but not from the same area.
    (a) Schematic of the sample structure. x=0.82 for the top 1.6 μm layer. (b) Atomic force microscopy image of the sample surface. (c) ECCI micrograph (the black brackets indicate “stripes” of higher dislocation density in the coalescence region). (d) Topographic image. (c) CL near band edge (NBE) peak intensity map. (d) NBE CL peak energy map. Images (c) to (f) were acquired from approximately the same region of the sample. The white arrows indicate the apexes of the hillocks. The CL peak intensity and peak energy were extracted from hyperspectral data.
    Fig. 5. (a) Schematic of the sample structure. x=0.82 for the top 1.6 μm layer. (b) Atomic force microscopy image of the sample surface. (c) ECCI micrograph (the black brackets indicate “stripes” of higher dislocation density in the coalescence region). (d) Topographic image. (c) CL near band edge (NBE) peak intensity map. (d) NBE CL peak energy map. Images (c) to (f) were acquired from approximately the same region of the sample. The white arrows indicate the apexes of the hillocks. The CL peak intensity and peak energy were extracted from hyperspectral data.
    WDX maps of the intensities of (a) Ga Lα (left) and (c) Al Kα (right) X-rays, and (b) a backscattered electron image (center) of a micrometer-scale region of a c-plane AlGaN sample, with an average AlN content of 81%. The scale bar for X-ray intensities applies to both WDX maps, although with different absolute values.
    Fig. 6. WDX maps of the intensities of (a) Ga Lα (left) and (c) Al Kα (right) X-rays, and (b) a backscattered electron image (center) of a micrometer-scale region of a c-plane AlGaN sample, with an average AlN content of 81%. The scale bar for X-ray intensities applies to both WDX maps, although with different absolute values.
    (a) Semi-log plot showing the measured Si content in the GaN layers, calibrated using the points where SIMS data is available (red data points). (b) Long qualitative scan for Si for the sample with lowest measured Si content 2.3×1017 cm−3, using a TAP crystal showing the WDX Si peak.
    Fig. 7. (a) Semi-log plot showing the measured Si content in the GaN layers, calibrated using the points where SIMS data is available (red data points). (b) Long qualitative scan for Si for the sample with lowest measured Si content 2.3×10¹⁷  cm3, using a TAP crystal showing the WDX Si peak.
    C. Trager-Cowan, A. Alasmari, W. Avis, J. Bruckbauer, P. R. Edwards, B. Hourahine, S. Kraeusel, G. Kusch, R. Johnston, G. Naresh-Kumar, R. W. Martin, M. Nouf-Allehiani, E. Pascal, L. Spasevski, D. Thomson, S. Vespucci, P. J. Parbrook, M. D. Smith, J. Enslin, F. Mehnke, M. Kneissl, C. Kuhn, T. Wernicke, S. Hagedorn, A. Knauer, V. Kueller, S. Walde, M. Weyers, P.-M. Coulon, P. A. Shields, Y. Zhang, L. Jiu, Y. Gong, R. M. Smith, T. Wang, A. Winkelmann. Scanning electron microscopy as a flexible technique for investigating the properties of UV-emitting nitride semiconductor thin films[J]. Photonics Research, 2019, 7(11): B73
    Download Citation