
Christian R. Petersen, Mikkel B. Lotz, Christos Markos, Getinet Woyessa, David Furniss, Angela B. Seddon, Rafael J. Taboryski, O. Bang. Thermo-mechanical dynamics of nanoimprinting anti-reflective structures onto small-core mid-IR chalcogenide fibers [Invited][J]. Chinese Optics Letters, 2021, 19(3): 030603
- Chinese Optics Letters
- Vol. 19, Issue 3, 030603 (2021)
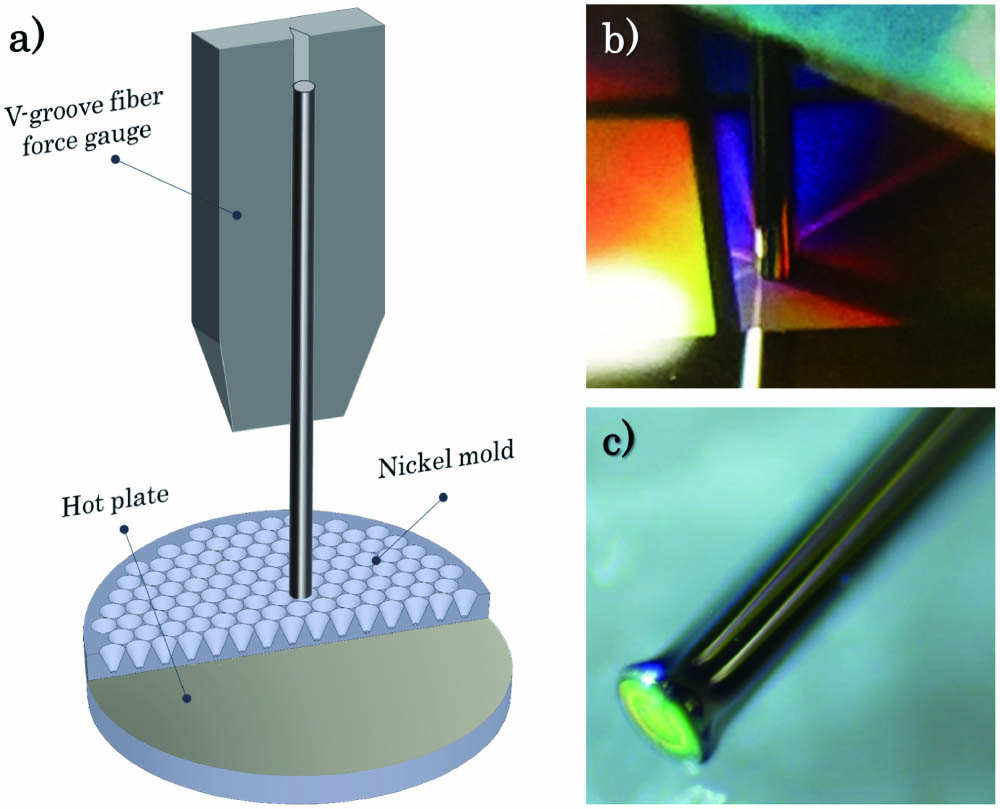
Fig. 1. (a) Illustration of the thermal nanoimprinting principle. (b), (c) Photograph of the fiber (b) during and (c) after imprinting. The different colors are due to the angle and wavelength dependent reflection of the nanostructures.
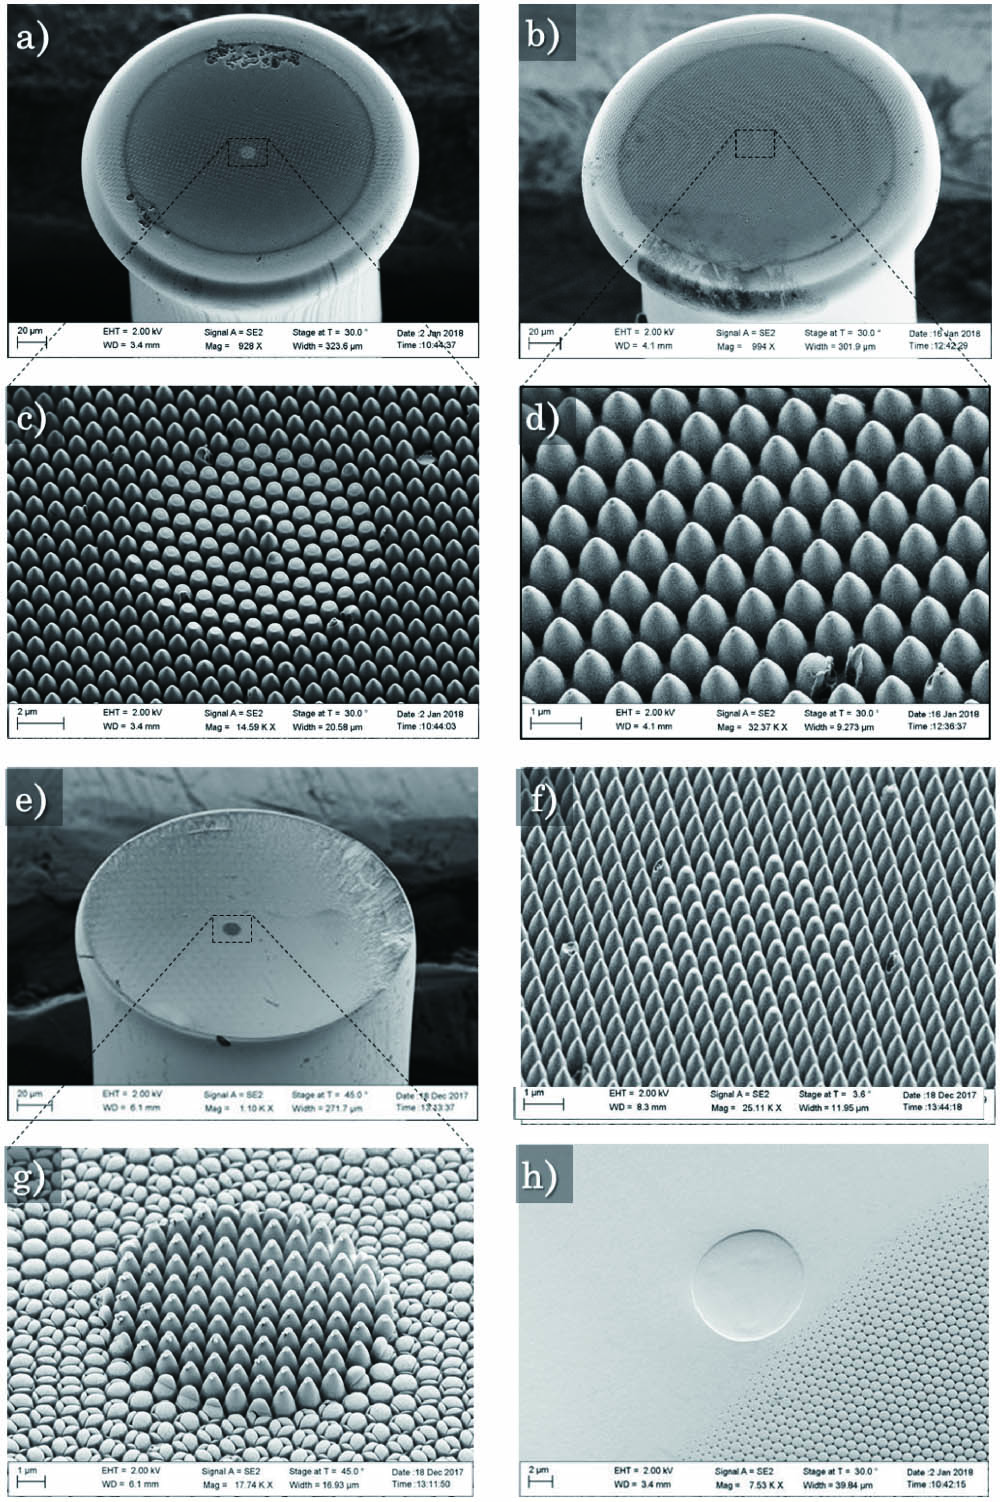
Fig. 2. SEM images of imprinted (a), (c), (h) IRF-Se-12, (b), (d) IRF-Se-100, (e), (g) NOTT-11, and (f) IRF-SeG-12 optical fibers.
Fig. 3. (a) Calculated single-interface transmission for varying degrees of imprint completeness. (b) Zoom-in on the core/clad interface of the imprinted IRF-Se-12 fiber used to estimate the imprint height (<75%).
Fig. 4. (a) Optical microscope image of the imprinted fiber end face, reflecting red light at this particular angle. (b) SEM image of the imprinted end face protruding slightly from the ferrule. (c), (d) Close up of the imprinted core area at different angles. The dashed white line indicates the core area. (e) The white arrows show the region where a slight difference in the gray level indicates the interface between core and cladding.
Fig. 5. (a) Test setup for measuring fiber transmission (M1/M2, silver mirror; LPF, long-pass filter; AL, aspheric lens; TPM, thermal power meter). (b) Pump and transmission spectra of the IRF-Se-100 fiber before and after imprinting the input face. (c) Bar plot illustrating the increasing transmission due to imprinting IRF-Se-100.
Fig. 6. (a) Typical MMF end face after cleaving. (b) Close up on the core area showing core delamination near the face. (c) Polished end face showing consolidation between core and clad, as well as the presence of PES debris. (d) Imprinted end face.
|
Table 1. Specifications for the Tested Chalcogenide Fibers
|
Table 2. Best AR results

Set citation alerts for the article
Please enter your email address
© Copyright 2018-2021 | Chinese Laser Press. All Rights Reserved 沪ICP备15018463号-20