
Xuezhi Zhang, Boyue Yang, Junfeng Jiang, Kun Liu, Xiaojun Fan, Zhaozhu Liu, Min Peng, Guanlong Chen, Tiegen Liu. Side-polished SMS based RI sensor employing macro-bending perfluorinated POF[J]. Opto-Electronic Advances, 2021, 4(10): 200041-1
- Opto-Electronic Advances
- Vol. 4, Issue 10, 200041-1 (2021)
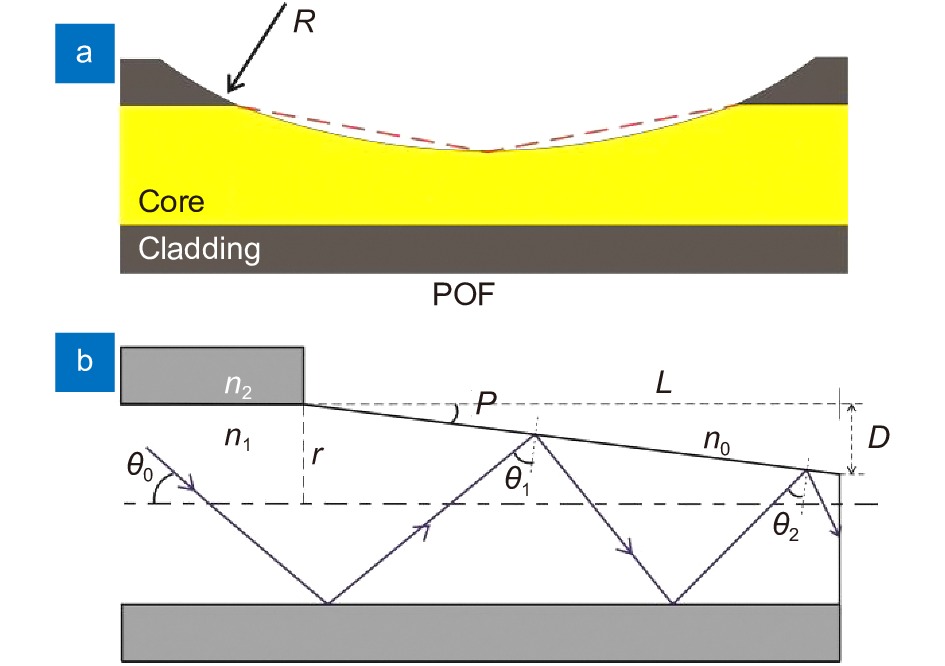
Fig. 1. Schematic diagram of SP-area. (a ) Structural equivalence. (b ) Optical transmission.
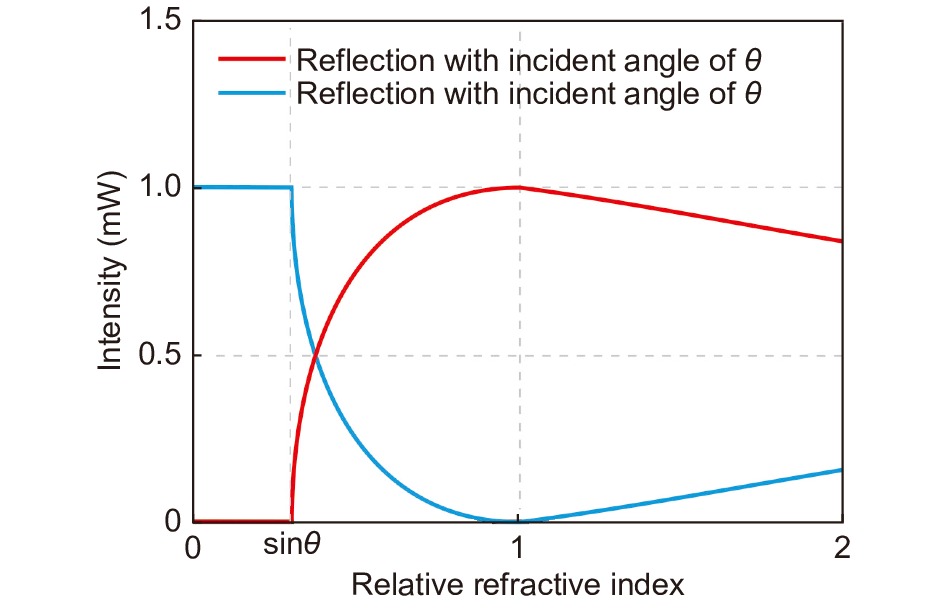
Fig. 2. The relationship between the energy of reflected and refracted light and the relative RI when the incident angle is θ .
Fig. 3. The variation of reflected light intensity with incident angle; the dotted line indicates n 01 = 0.9, and the solid line indicates n 01 = 1.1.
Fig. 4. Schematic diagram of the experimental setup.
Fig. 5. (a ) Cross section of the POF. (b ) Connection between POF and SMF using ceramic ferrule and ceramic mating sleeve.
Fig. 6. Schematic of experimental setup for polishing fibers.
Fig. 7. Transmission spectra of the RI sensor with different POF length.
Fig. 8. Transmission spectra of different SP-depths. (a ) D =0 μm. (b ) D =10 μm. (c ) D =20 μm. (d ) D =30 μm.
Fig. 9. Macro-bending diagram. (a ) SDB. (b ) ODB.
Fig. 10. Transmission spectra of different macro bending.
Fig. 11. Schematic diagram of stress change. (a ) SDB. (b ) ODB. The dotted line is evenly stressed and the solid line is not evenly stressed.
Fig. 12. Intensity response of RI sensor.
Fig. 13. Transmission response of the perfluorinated POF-based RI sensor at different temperature. (a ) Output power response. (b ) Wavelength response.

Set citation alerts for the article
Please enter your email address
© Copyright 2018-2021 | Chinese Laser Press. All Rights Reserved 沪ICP备15018463号-20