
Xuezhi Zhang, Boyue Yang, Junfeng Jiang, Kun Liu, Xiaojun Fan, Zhaozhu Liu, Min Peng, Guanlong Chen, Tiegen Liu. Side-polished SMS based RI sensor employing macro-bending perfluorinated POF[J]. Opto-Electronic Advances, 2021, 4(10): 200041-1
- Opto-Electronic Advances
- Vol. 4, Issue 10, 200041-1 (2021)
Abstract
Introduction
Fluoropolymer is a straight chain alkane polymer that some or all hydrogen atoms of molecular structure are replaced by fluorine. Fluoropolymer is believed to be a preferred material for the high chemical resistance, barrier property, non-moisture absorption and weather resistance to prepare optical fiber cable, chemical resistant lining, electronic components, coating material and weather resistant film
RI, an inherent optical property, can directly reflect concentration, purity, viscosity and other information of the solution. Therefore, it has been applied in various fields such as medical diagnosis and chemical analysis
The maximum core RI of Graded-index PF-POF (Giga-POF50SR) of 1.356 and the cladding RI of 1.342. PF-POF can be well connected with quartz fiber for low loss, high bandwidth and flexibility. In addition, fluorine molecule has low volatility, which makes the fiber remain stable at high temperature
In this paper, SMF and new material PF-POF are used to make SMS structure. On the basis of SMS structure, PF-POF is polished by grindstone. Different from the V-groove polishing technology
Principle
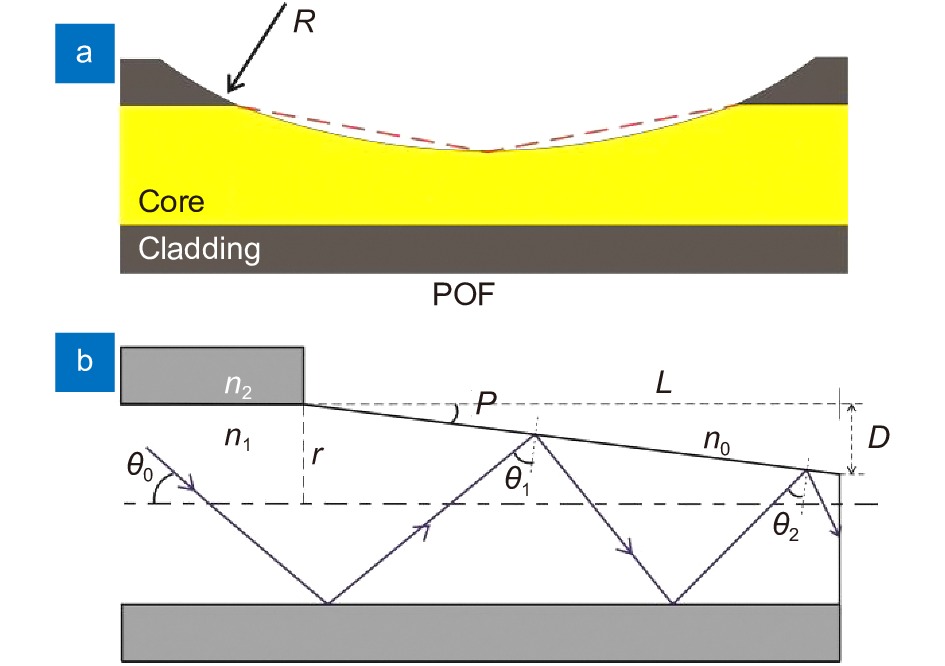
The light in the untreated PF-POF cannot penetrate the cladding and interact with the external environment. Therefore, it is necessary to improve the sensitivity of optical fiber by SP. In order to improve the performance of the sensor, the model is established as shown in Fig. 1(a) to study the influence of fiber structure modification on the sensitivity. From left to right, SP-area can be divided into two parts: the area where the core diameter gradually decreases and increases. Because the SP-area is symmetric, only the light guiding properties of the area with decreased diameter are analyzed. The radius of the clamping wheel is about 15 cm, which is much larger than that of PF-POF. Therefore, the SP-radian drop and rise can be equivalent to drop or rise linearly, as shown in the red dotted line in the Fig. 1(a). The measurement principle of the sensor and the key parameters affecting sensitivity are analyzed from following two aspects.
![]()
Figure 1.
Evanescent-wave
When total internal reflection occurs in the fiber, the light wave is not absolutely reflected back to the core, but penetrates into the surface of the cladding layer (about one wavelength), propagates along the interface for a short distance, and finally returns to the core. The wave passing through the cladding interface is called evanescent wave
where λ is the wavelength, n1 is the core RI, and n2 is the cladding RI. The incident angle at the core-cladding interface is called θ and the SP-depth is D. In this SP-model, the cladding is removed and the external solution acts as a new cladding. Figure 1(b) describes the light propagation path in the SP-area. α is the slope angle of the SP-surface, θ0 is the angle between the light and the core center line, and L is the SP-length of the falling area. The incident angle of light at the SP-interface for the first time (hereinafter referred to as the incident angle) is θ1, and the incident angle for the ith time is recorded as θi. Then, θi can be expressed as:
![]()
Figure 2.
It can be seen from Eq. (1) that when n1 > n2, the evanescent depth is increasing with the increased external environment RI, and the spectral intensity decreases continuously with the increase of the penetration depth. This means that the change of external solution RI can be detected from the change of transmission spectrum intensity.
With the decrease of the incident angle and the increase of the SP-length, the evanescent wave effect is enhanced. According to Eq. (2), the incident angle is determined by SP-depth and SP-radian. Therefore, the sensitivity of the sensor can be improved by properly increasing the SP-depth, SP-radian and SP-length. It should be noted that the enhancement of evanescent wave effect caused by the increase of SP-length, SP-depth and SP-radian will lead to the decrease of the overall intensity of the output spectrum.
Refraction effect
In the SP-model, the external environment becomes a new cladding, and the transmitted light will refract under certain conditions. According to Fresnel equation and electromagnetic theory
where n01 is the relative RI of the external environment and the core, and θ is the incident angle. The incident light is decomposed into light with S-polarization and P-polarization whose electric vector is perpendicular to and parallel to the incident plane. The light intensity of them is expressed by IS and IP, respectively. If the intensity of incident light is 1 mW, IS=IP=0.5 mW. The relationship between the intensity of reflected light and refracted light and the relative RI is shown in Fig. 2.
It can be seen from Fig. 2 that when sin θ ≥ n01, total internal reflection occurs, and the reflected light intensity is 1 mW. When sinθ < n01≤ 1, with the increase of n01, the intensity of reflected light begins to decrease; when n01=1, the intensity becomes zero. In this process, the change rate gradually decreases; when n01 > 1, the reflected light intensity increases from zero, and the slope of increasing is small. Therefore, the change of external environment RI can be detected from the intensity change of transmission spectrum. Different incident angle will induce different reflected light intensity, but no matter what the incident angle is ( θ < 90°), when the relative RI decreases from 1, the reflected light intensity always increases with the decrease of relative RI.
The relationship between reflected light intensity and incident angle is shown in Fig. 3. Either n1 < n0 or n1 > n0, with the increase of incident angle, the reflected light intensity will increase, and the refracted light intensity will decrease. In addition, the refraction effect area increases with the increase of the SP-length L. Therefore, the sensor sensitivity can be improved by increasing the SP-depth, SP-radian and SP-length.
![]()
Figure 3.
Experimental and preparation
As shown in Fig. 4, the experimental setup contains ASE broadband light source, spectrometer, RI sensor and glycerin aqueous solution with different RI. The cross section of PF-POF is shown in Fig. 5(a). Regarding connecting PF-POF to SMF or instruments effectively and reliably, the traditional method, UV curing bonding, is reliable. But this method is time-consuming, and highly dependent on the operator experience. Here, the butt joint method of ceramic sleeve
![]()
Figure 4.
![]()
Figure 5.(
At present, the main methods to make optical fiber sensitive to external RI are as follows: taper
The precision polishing device is shown in Fig. 6, PF-POF is fixed on the semicircular clamping wheel. The ends of POF is connected by optical power meter and light source. Whether the fiber core is polished is determined by optical power measured by a power meter when the move of clampling wheel is controlled by the guide. At this time, the descending distance at the other end of the guide is recorded, which is the SP-depth by microscope after polishing.
![]()
Figure 6.
Experimental analysis
The transmission spectrum of multimode interference in SMS is related to the length of multimode fiber
![]()
Figure 7.
Since the radius of the side wheel is determined in this experiment, the SP-length is positively correlated with the SP-depth, so only the SP-depth is explored. The sensor is explored under the conditions of different SP-depth. Figure 8 shows the transmission spectra in air and glycerin aqueous solution (RI=1.356) when the PF-POF length is 8 cm and the SP-depth D is 0 μm, 10 μm, 20 μm and 30 μm respectively. The difference of RI between air and glycerin aqueous solution is 0.356. In this situation, the characteristic wavelength intensity drift is 3.873 dBm when D=0 μm, 5.267 dBm when D=10 μm, and 6.985 dBm when D=20 μm. Therefore, it can be concluded that the sensor sensitivity can be improved by properly increasing the SP-depth. Figure 8(d) shows that the SP-depth is not good to be too large. When D=30 μm, due to the large SP-depth, the fiber core is so thin that the optical energy loss is too high and the signal-to-noise ratio is reduced. As a result, it is not suitable for measurement and observation.
![]()
Figure 8.
The effect of macro-bending on the sensor is explored. Macro-bending can change the incident angle and the SP-radian. The bending of the sensor with the same direction and SP-radian is defined as the same direction bending (SDB), as shown in Fig. 9(a); the bending of the sensor and with the opposite direction and SP-radian direction is defined as the opposite direction bending (ODB), as shown in Fig. 9(b).
![]()
Figure 9.
Figure 10 shows the transmission spectra in air and glycerin aqueous solution (RI = 1.356) under different bending directions and radius conditions when the PF-POF length is 8 cm and the SP-depth is 20 μm. In the environment with same RI difference, the intensity sensitivity increases with the decrease of bending radius. The intensity change of Fig. 10(a) is 7.688 dBm, which is higher than 7.012 dBm in Fig. 10(b); the intensity drift of Fig. 10(c) is 12.750 dBm, which is higher than 9.068 dBm in Fig. 10(d). The sensitivity of the sensor can be improved by bending with proper radius. Besides, it can also be seen that the performance of SDB is better than that of ODB. With the decrease of bending radius, the mode of light gradually changes from higher order to lower order, and the higher-order modes gradually leak out from the core. As a result, the loss increases, the overall intensity of the output spectrum decreases and the wavelength sensitivity increases
![]()
Figure 10.
The transmission spectrum intensity of Fig. 10(e) and Fig. 10(f) is weak and the signal-to-noise ratio is reduced, which indicates that the ultra-small bending radius is not good for the sensing. As nearly half of fiber is polished, the bending stress on the SP-area and the normal area is not uniform. This phenomenon becomes obvious gradually with the decrease of bending radius. If the bending radius is too small, the PF-POF will change from the original arc shape to the triangular shape, as shown in Fig. 11. This phenomenon leads to the decrease of transmission intensity and signal-to-noise ratio, which is not suitable for measurement and observation. The results show that the SDB structure with R=3 cm is a better choice.
A RI sensor with 8 cm of PF-POF length, 20 μm of SP-depth and 3 cm of SDB radius were fabricated. The RI sensing performance of sensor is studied in the range of 1.330–1.356 with 0.005RIU as the interval. As shown in Fig. 12, the black dotted line depicts the nonlinear change trend of the intensity value of the characteristic wavelength in different RI solutions. It can be seen that when the external RI becomes smaller from 1.356 (the relative RI of the measured solution and the fiber core is 1), the intensity of the characteristic wavelength increases with the decrease of the RI, and the increase rate is becoming larger. This phenomenon verifies the conclusion of the section: Principle. When the relative RI is 1, all the energy passing through the SP-interface will be refracted out. However, a small amount of light waves in the fiber will not pass through the SP-interface, but is directly coupled to the SMF and detected by the spectrometer, so the intensity of the characteristic wavelength is not zero. The red solid line is the linear fitting of strength response. In the range of RI=1.330–1.356, the intensity sensitivity of the sensor is –219.504 dBm/RIU, R2=0.977.
It can be concluded from theoretical analysis and experimental results that the sensitivity of the sensor has high sensitivity and linearity when the RI of the external solution is less than that of the fiber core. The sensitivity can be improved by properly modifying the structure of the sensor, such as SP and macro-bending.
The temperature characteristics of the RI sensor are researched from 10 °C to 40 °C. The PF-POF length is 8 cm, the SP-depth is 20 μm. The sensor is of SDB structure with R=3 cm. The intensity variation shown in Fig. 13(a) presents a linear sensitivity of 0.127 dBm/°C. The measured wavelength shift presents a linear sensitivity of 0.803 nm/°C with the temperature rising, as shown in Fig. 13(b). PF-POF has large thermo-optic coefficient and thermal expansion coefficient
![]()
Figure 11.
![]()
Figure 12.
![]()
Figure 13.
Conclusion
In this work, RI sensor based on PF-POF with different characteristic parameters was successfully fabricated. The sensor with the intensity sensitivity of −219.504 dBm/RIU in the range of RI=1.330−1.356 was prepared (PF-POF length=8 cm, SDB R=3 cm and SP-depth=20 μm). The results indicate that the accomplishment of accurate measurement of RI sensor requires appropriate correction and temperature compensation impeded by the large thermo-optic coefficient and the thermal expansion coefficient of PF-POF. Since the perfluorinated plastic optical fiber refractive index sensor has good flexibility, high mechanical strength, simple manufacture and low price, it has wide application prospect in water conservancy, food detection and other fields.
References
[1] Overview of the development of the fluoropolymer industry. Appl Sci, 2, 496-512(2012).
[2] Polymer-based optical waveguides: materials, processing, and devices. Adv Mater, 14, 1339-1365(2002).
[3] Evanescent wave absorbance based fiber optic biosensor for label-free detection of
[4] Carbon dioxide gas sensor derived from a 547-hole microstructured polymer optical fiber preform. Opt Lett, 35, 3270-3272(2010).
[5] Surface plasmon resonance sensor based on coreless fiber for high sensitivity. Opt Fiber Technol, 50, 172-176(2019).
[6] On‐chip readout plasmonic mid‐IR gas sensor. Opto-Electronic Adv, 3, 190040(2020).
[7] Expermental studies of multimode interference based fiber optic refractive index sensors. Chin J Lasers, 37, 1516-1519(2010).
[8] High performance temperature sensing of single mode-multimode-single mode fiber with thermo-optic polymer as cladding of multimode fiber segment. IEEE Sens J, 14, 1143-1147(2014).
[9] Resolution-enhanced fiber grating refractive index sensor based on an optoelectronic oscillator. IEEE Sens J, 18, 9562-9567(2018).
[10] Refractive index and temperature sensor based on D-shaped fiber combined with a fiber Bragg grating. IEEE Sens J, 19, 1362-1367(2019).
[11] Reflective optical fiber sensors based on tilted fiber Bragg gratings fabricated with femtosecond laser. J Lightwave Technol, 31, 455-460(2013).
[12] Investigating the strain, temperature and humidity sensitivity of a multimode graded-index perfluorinated polymer optical fiber with Bragg grating. Sensors, 18, 1436(2018).
[13] Fiber-optic refractive index sensor based on multi-tapered SMS fiber structure. IEEE Sens J, 15, 6348-6353(2015).
[14] Refractive index sensor based on ultrafine tapered single-mode nocladding single-mode fiber structure. Opt Fiber Technol, 48, 297-302(2019).
[15] 15International Conference on Condensed Matter and Applied Physics (AIP Publishing LLC, 2016).
[16] Intensity modulated refractive index sensor based on optical fiber Michelson interferometer. Sens Actuators B:Chem, 208, 315-319(2015).
[17] Intensity-modulated refractive index sensor with anti-light source fluctuation based on no-core fiber filter. Opt Laser Technol, 97, 358-363(2017).
[18] Low-Cost Transducer based on surface scattering using side-polished D-shaped optical fibers. IEEE Photon J, 7, 7102510(2015).
[19] 19Physical Optics 4th ed (Electronic Industry Press, Beijing, 2012).
[20] 20Optics Course (Sichuan University Press, China, 1989).
[21] Multimode interferometer-based torsion sensor employing perfluorinated polymer optical fiber. Opt Express, 27, 28123-28132(2019).
[22] Single-mode—multimode—single-mode and lossy mode resonance-based devices: a comparative study for sensing applications. Microsyst Technol, 22, 1633-1638(2016).
[23] D-shaped plastic optical fiber sensor for testing refractive index. IEEE Sens J, 14, 1673-1676(2014).
[24] Microbend fiber optic detection of continuously varying refractive index of chlorinated water. Optik, 125, 301-303(2014).
[25] Mode scalability in bent optical fibers. Opt Express, 15, 15674-15701(2007).


Set citation alerts for the article
Please enter your email address

© Copyright 2018-2021 | Chinese Laser Press. All Rights Reserved 沪ICP备15018463号-20