• Journal of Semiconductors
  • Vol. 44, Issue 2, 023105 (2023)
Jingjing Wang1, Baozheng Xu1, Yinfang Zhu2、*, and Junyuan Zhao2、**
Author Affiliations
  • 1School of Electronic and Information Engineering, Tiangong University, Tianjin 300380, China
  • 2Institute of Semiconductors, Chinese Academy of Sciences, Beijing 100083, China
  • show less
    DOI: 10.1088/1674-4926/44/2/023105 Cite this Article
    Jingjing Wang, Baozheng Xu, Yinfang Zhu, Junyuan Zhao. Microcantilever sensors for biochemical detection[J]. Journal of Semiconductors, 2023, 44(2): 023105 Copy Citation Text show less
    (Color online) (a) Schematic diagram of EPM sensor and (b) EPM sensor response to CO.
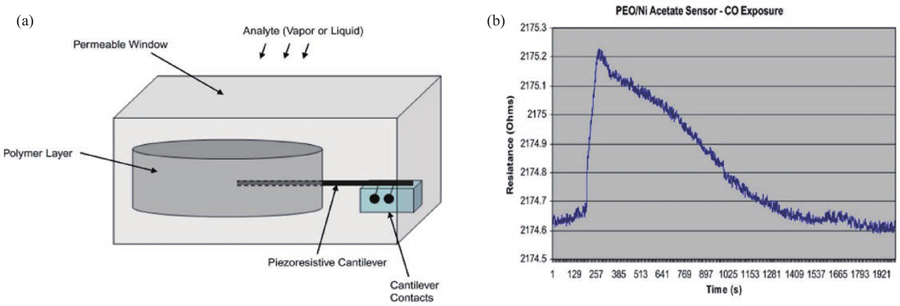
    Fig. 1. (Color online) (a) Schematic diagram of EPM sensor and (b) EPM sensor response to CO.
    (Color online) Schematic diagram of the sensor structure and operating principle. (a) Explosive vapor adsorbed on a carbon nanotube sensor. (b) Heating the explosive vapor to make it micro-detonate.
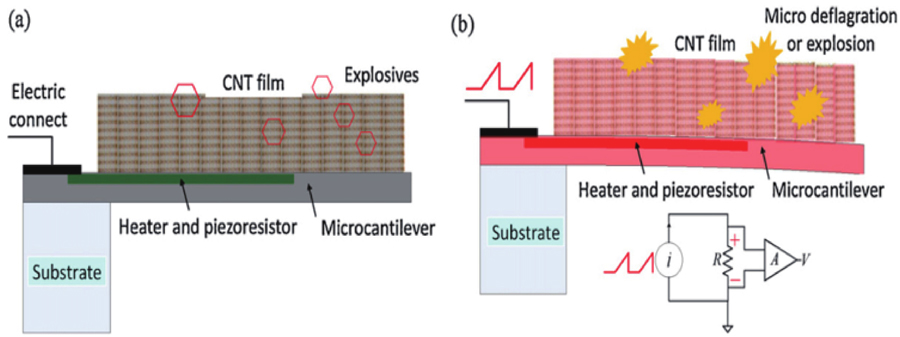
    Fig. 2. (Color online) Schematic diagram of the sensor structure and operating principle. (a) Explosive vapor adsorbed on a carbon nanotube sensor. (b) Heating the explosive vapor to make it micro-detonate.
    (Color online) Schematic diagram of the PCDS experimental gas sensing device. (a) Controlled vapor generation device. (b) Sensing section.
    Fig. 3. (Color online) Schematic diagram of the PCDS experimental gas sensing device. (a) Controlled vapor generation device. (b) Sensing section.
    (Color online) Schematic diagram of the setup and floating cantilever. (a) Top: attached live bacteria. bottom: optical image of the cantilever. (b) Top indicates the acquisition chamber. Bottom: AFM illumination detection system. (c) Description of fluctuations generated by B adsorption on its surface.
    Fig. 4. (Color online) Schematic diagram of the setup and floating cantilever. (a) Top: attached live bacteria. bottom: optical image of the cantilever. (b) Top indicates the acquisition chamber. Bottom: AFM illumination detection system. (c) Description of fluctuations generated by B adsorption on its surface.
    (Color online)Schematic diagram of the BMC and its multiple modes of operation. (a) BMC filled with bacteria on a silicon substrate. (b) Scanning electron microscope (SEM) image located at the bottom of the chip. (c) Cross-section of a cantilevered 32 mm wide microchannel. (d) Fluorescence image of the top of the BMC. (e) SEM image of the BMC tip. (f) Nanomechanical deflection of the BMC when the bacteria inside the BMC absorb infrared light. (g) The resonance frequency is sensitive to the mass increase caused by bacterial adsorption inside the BMC. (h) Nanomechanical deflection map of BMC when irradiated by a range of infrared light shows the wavelengths at which the bacteria absorb infrared light. This can provide excellent selectivity in complex mixtures.
    Fig. 5. (Color online)Schematic diagram of the BMC and its multiple modes of operation. (a) BMC filled with bacteria on a silicon substrate. (b) Scanning electron microscope (SEM) image located at the bottom of the chip. (c) Cross-section of a cantilevered 32 mm wide microchannel. (d) Fluorescence image of the top of the BMC. (e) SEM image of the BMC tip. (f) Nanomechanical deflection of the BMC when the bacteria inside the BMC absorb infrared light. (g) The resonance frequency is sensitive to the mass increase caused by bacterial adsorption inside the BMC. (h) Nanomechanical deflection map of BMC when irradiated by a range of infrared light shows the wavelengths at which the bacteria absorb infrared light. This can provide excellent selectivity in complex mixtures.
    (Color online) (a) Schematic diagram of the interaction between the probe and target molecules in the embedded MOSFET cantilever system. (b) Schematic diagram of MOSFET drain current variation during probe-target bonding. (c) Variation of drain current with time.
    Fig. 6. (Color online) (a) Schematic diagram of the interaction between the probe and target molecules in the embedded MOSFET cantilever system. (b) Schematic diagram of MOSFET drain current variation during probe-target bonding. (c) Variation of drain current with time.
    (Color online) (a) Schematic diagram of the flow cell. (b) Schematic diagram of the closed-loop control system.
    Fig. 7. (Color online) (a) Schematic diagram of the flow cell. (b) Schematic diagram of the closed-loop control system.
    (Color online) (a) Schematic diagram of the micro-cantilever sensor and (b) scanning electron microscope (SEM) image of the cantilever.
    Fig. 8. (Color online) (a) Schematic diagram of the micro-cantilever sensor and (b) scanning electron microscope (SEM) image of the cantilever.
    (Color online) Illustration of the cantilever arrays (top) and enlarged view of the cantilever (bottom).
    Fig. 9. (Color online) Illustration of the cantilever arrays (top) and enlarged view of the cantilever (bottom).
    (Color online) Setup showing sensor and reference cantilevers and the biofunctionalized cantilever array.
    Fig. 10. (Color online) Setup showing sensor and reference cantilevers and the biofunctionalized cantilever array.
    (Color online) (a) Shift of resonant frequency and sensitivity versusw, (b) position dependence of the rectangular cantilever sensitivity and (c) novel stepped microcantilever.
    Fig. 11. (Color online) (a) Shift of resonant frequency and sensitivity versusw, (b) position dependence of the rectangular cantilever sensitivity and (c) novel stepped microcantilever.
    (Color online) (a) The SEM top view of the MCL. (b) The SEM side view of MCL. (c) The schematic of immobilizing the modification process. (d) The entity experiment diagram.
    Fig. 12. (Color online) (a) The SEM top view of the MCL. (b) The SEM side view of MCL. (c) The schematic of immobilizing the modification process. (d) The entity experiment diagram.
    (Color online) (a) Schematic diagram of reaction module. (b) Schematic diagram of electrode and cantilever chip position. (c) Partial enlarged view of ACET electrode. (d) PDMS microfluidic channel chip.
    Fig. 13. (Color online) (a) Schematic diagram of reaction module. (b) Schematic diagram of electrode and cantilever chip position. (c) Partial enlarged view of ACET electrode. (d) PDMS microfluidic channel chip.
    Jingjing Wang, Baozheng Xu, Yinfang Zhu, Junyuan Zhao. Microcantilever sensors for biochemical detection[J]. Journal of Semiconductors, 2023, 44(2): 023105
    Download Citation