• Journal of Semiconductors
  • Vol. 41, Issue 6, 061101 (2020)
Chuen-Keung Sin, Jingzhao Zhang, Kinfai Tse, and Junyi Zhu
Author Affiliations
  • The Chinese University of Hong Kong, Hong Kong, China
  • show less
    DOI: 10.1088/1674-4926/41/6/061101 Cite this Article
    Chuen-Keung Sin, Jingzhao Zhang, Kinfai Tse, Junyi Zhu. A brief review of formation energies calculation of surfaces and edges in semiconductors[J]. Journal of Semiconductors, 2020, 41(6): 061101 Copy Citation Text show less

    Abstract

    To have a high quality experimental growth of crystals, understanding the equilibrium crystal shape (ECS) in different thermodynamic growth conditions is important. The factor governing the ECS is usually the absolute surface formation energies for surfaces (or edges in 2D) in different orientations. Therefore, it is necessary to obtain an accurate value of these energies in order to give a good explanation for the observation in growth experiment. Historically, there have been different approaches proposed to solve this problem. This paper is going to review these representative literatures and discuss the pitfalls and advantages of different methods.

    1. Introduction

    The fundamental thermodynamic theory of surfaces, initialized by the American scientist Josiah Willard Gibbs, is one of the most practical tools for the study of surface-related phenomena[14]. For this approach, the key quantity is the surface free energy (or surface energy), , which is equal to the excess free energy per unit area on account of the creation of surfaces, compared with the bulk structure, plus the energy change due to deformation in liquid or reconstruction in solid[5]. For a liquid surface, the phrase "surface tension" was widely used for the surface free energy. This phrase had also been extended to the surfaces of solids previously, which, however, produces a confusion between the surface free energy and the intrinsic surface stress of solids, revealed by Gibbs[6]. Therefore, currently, the term "surface tension" is rarely used for solids. Instead, we use the term surface energy, which depends on the temperature in the experiment or computational simulation by where F, U, T and S are the surface (free) energy, internal energy, temperature and entropy respectively.

    For surfaces of solids, especially metals and semiconductors, the surface energy is important in many related fields, determining the equilibrium shape of monocrystals, brittle fracture, or the rate of sintering. Wulff construction[7] is a prevalent technique being used in the prediction of the morphologies because it is able to formulate the relation between the surface energy of surfaces (and edges of 2D lattices) and the relative feasibility of their formations in different directions. Hence, the principle of Wulff construction will be introduced as an appetizer before any estimation on the surface energy.

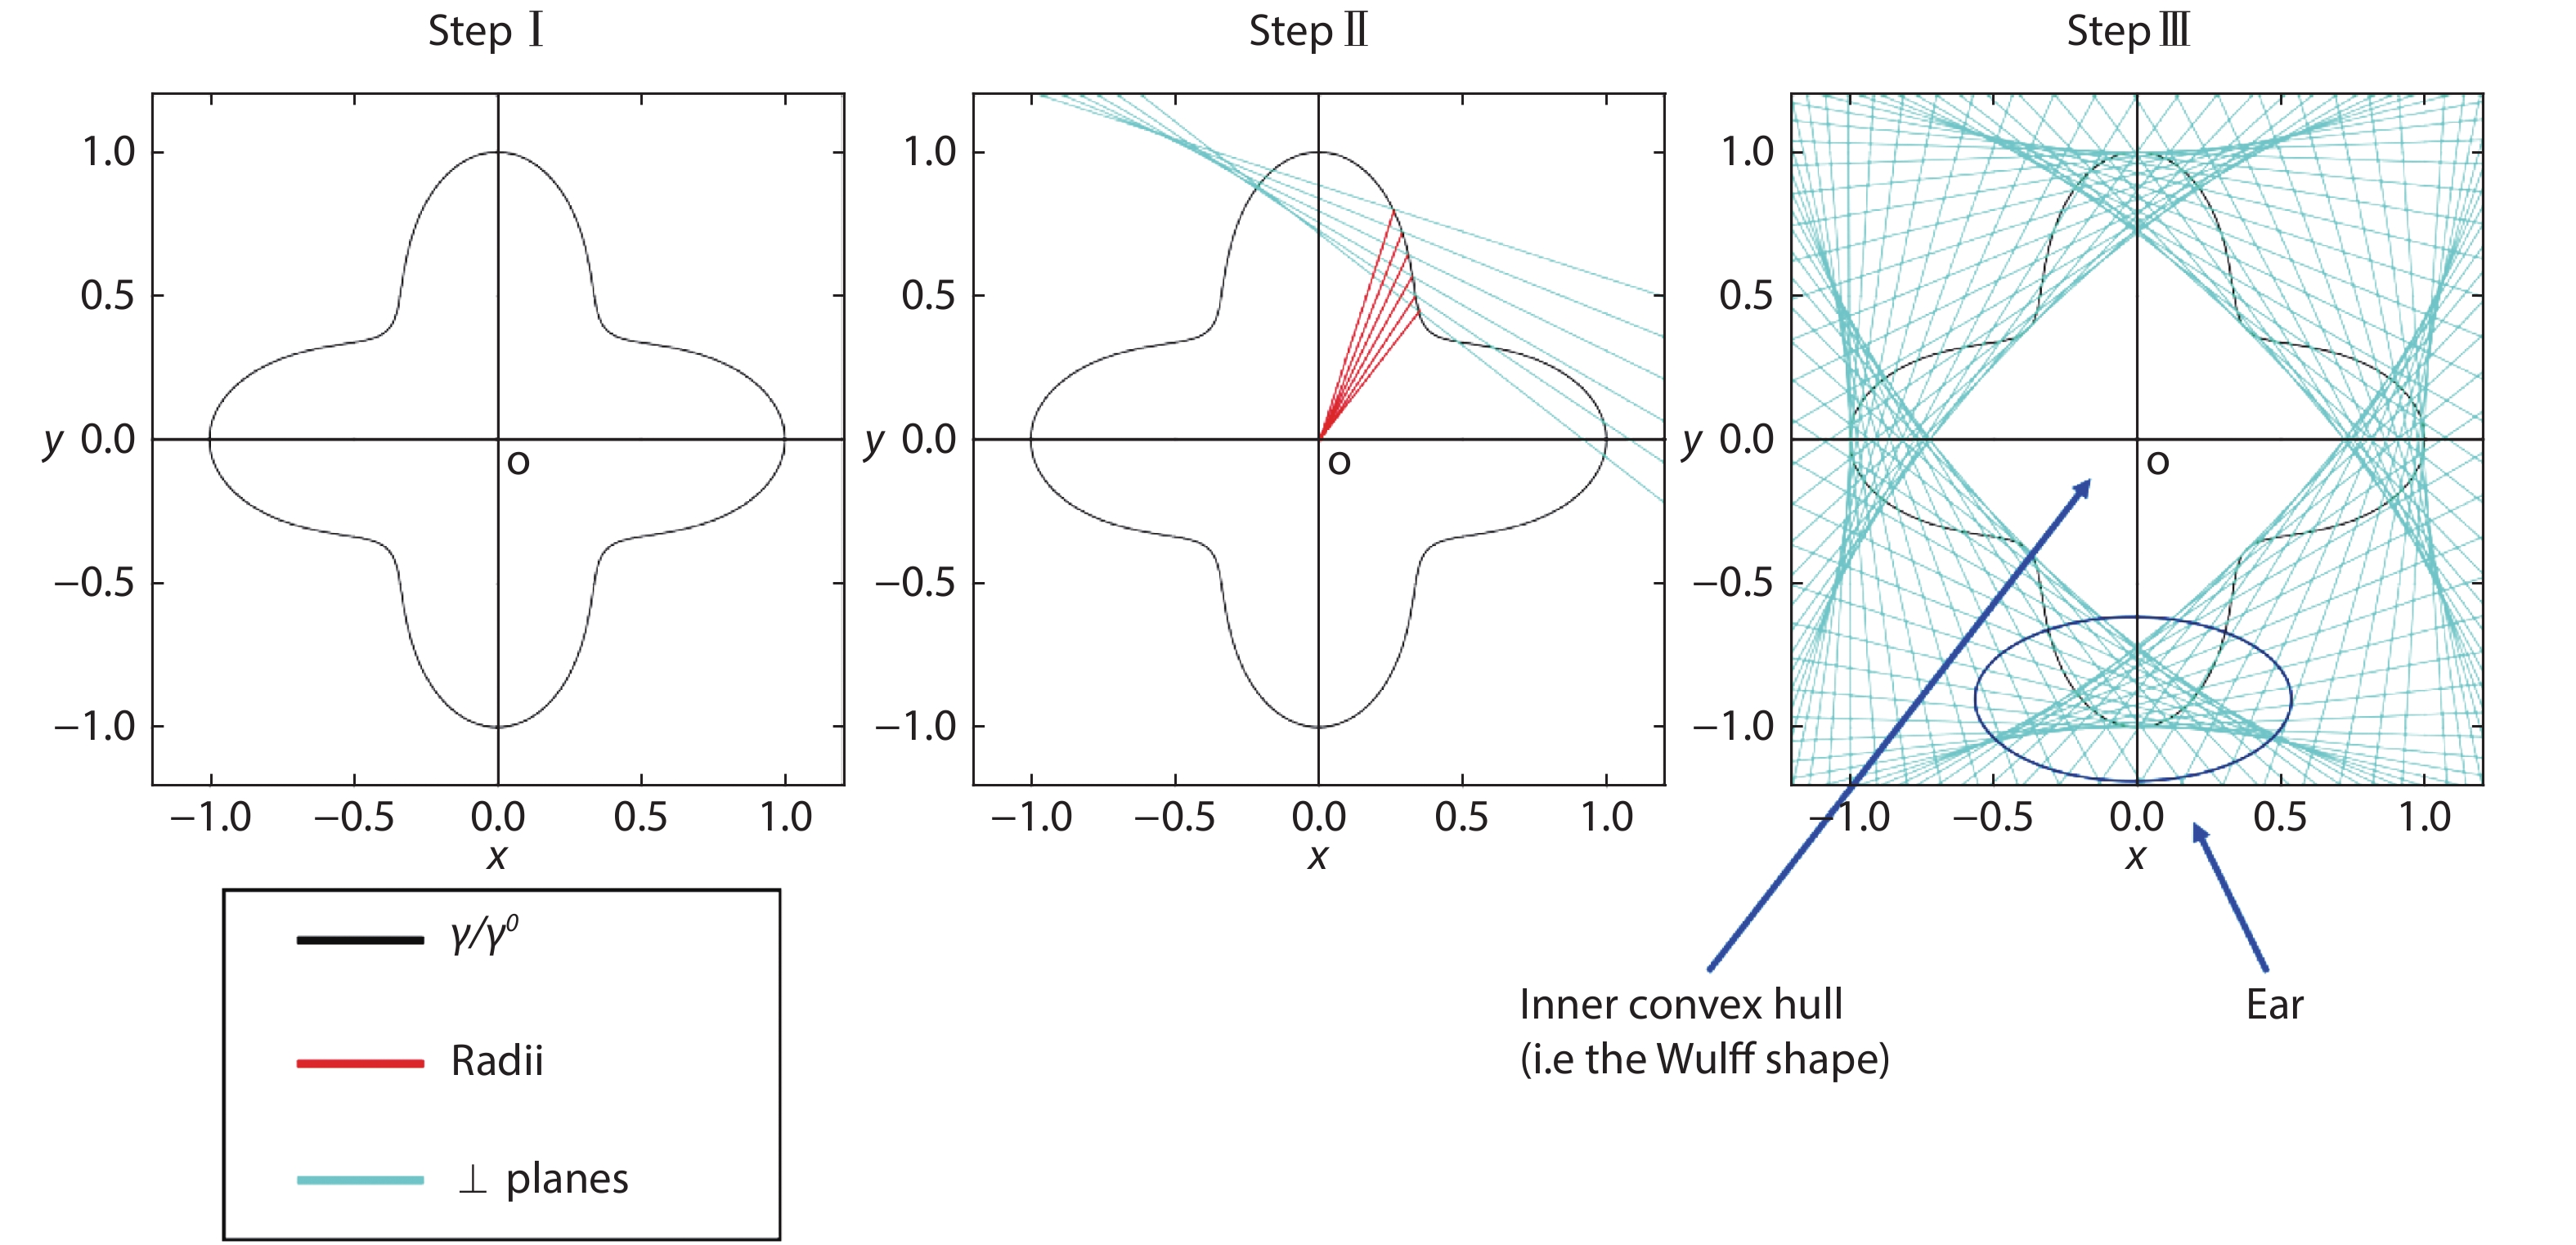
    The anisotropy of surface free energy brings about the idea of equilibrium shape, which is known as the Wulff shape, attributed to the pioneering works by Curie and Wulff[6, 8], which is the shape that minimizes its total surface energy. It is conventional to visualize the anisotropy of surface energies through -plots, which are polar plots of versus the polar angles and the azimuthal angle ϕ of the unit vector perpendicular to the corresponding surfaces. In the 2D case, is only related to the polar angle measured from a certain appropriate crystallographic direction. The process of Wulff construction transforms the -plot into equilibrium shape. According to Wulff construction, the equilibrium shape is the inner convex hull bounded by planes (perpendicular lines for 2D case) drawn perpendicular to each direction at a distance ( is a normalization constant) from the origin, shown in Fig. 1. As a result, orientations with planes that lie outside of the inner hull are unimportant in the construction of the final equilibrium shape because their energies are too high. This is indicated by planes that draw the "ears" at the corner of the Wulff shape in Fig. 1. Such an exclusion of unimportant planes results in an equilibrium shape with edges and/or sharp corners. Practically, we do not have an explicit function γ(θ, ϕ) in an arbitrary direction, we may however obtain the surface energy of surfaces in 3D or edges in 2D in certain directions. Therefore, direct calculation of equilibrium shape from the experimental or simulation data of surface energies is more favorable. According to Ref. [9], the distance r from the origin of the crystal shape in arbitrary direction is given by

    (Color online) Workflow of Wulff construction: (I) draw a -plot (black line) in which is used as a normalization constant; (II) draw planes (green line) at every point on the -plot that are perpendicular to the line drawn from the origin to that point; (III) Wulff shape is obtained as the inner convex hull and "ears" appear as indications of missing angles of the Wulff shape.

    Figure 1.(Color online) Workflow of Wulff construction: (I) draw a -plot (black line) in which is used as a normalization constant; (II) draw planes (green line) at every point on the -plot that are perpendicular to the line drawn from the origin to that point; (III) Wulff shape is obtained as the inner convex hull and "ears" appear as indications of missing angles of the Wulff shape.

    $ r({{h}}) = \min \limits_{ {{m}}}\frac{\gamma({{m}})}{{{m}}\cdot{{h}}}, $ (1)

    where h is the unit vector of the arbitrary direction, and is the surface energy of a plane or an edge with unit normal vector m. The minimum value of is chosen among different surfaces or edges in direction m. Even though the energy of surfaces or edges are obtained only in limited directions, we can calculate the radius of crystal shape at every angle and hence the equilibrium crystal shape (ECS). It is therefore crucial to obtain an accurate value of surface free energy so ECS can be directly estimated.

    Historically, among solids the surface energy of elemental crystals, mostly metals, was the earliest to be studied by researchers[10]. The surface energies of semiconductors, such as silicon and germanium were later measured[11]. Yet, to date, accurate experimental values for specific facets are still rarely available. Mostly, it was conducted by estimating the solid–liquid interfacial energy and liquid surface tension of the material to calculate the isotropic solid surface energy at finite temperatures, like the melting temperatures, which is then extrapolated to 0 K under isotropic approximations[12, 13]. Besides, there were some techniques, such as zero-creep and cleavage techniques, being used to estimate quantitative values of surface energy, which were applied to a limited number of solids, usually metals[14]. Moreover, the 3D equilibrium crystal shapes were also used to estimate the absolute surface energy of a solid[14, 15]. These experimental values have been summarized and reviewed elsewhere[12, 1618]. All of these known values are regarded as averages over a range of crystallographic orientations and these values yield large discrepancies by different experimental approaches. In order to precisely control the surface structure and composition, theoretical calculations by first-principles or semi-empirical methods have been conducted to determine such quantities, especially the anisotropy of that for specific facets[1927]. Due to the recent success of density function theory (DFT) in the investigation of electronic structure of many-body systems in the field of condensed matter physics and quantum chemistry, a high throughput database of surface energies of elemental crystals based on DFT has been published[28].

    In the framework of DFT[29, 30], slab geometry (nanoribbon geometry for the case of 2D lattices) is widely used to model the surface of metal or semiconductor thin films[28, 31, 32]. Surfaces in semiconducting compounds are different and more complicated. These surfaces can be divided into three types: nonpolar, polar symmetric, and polar or semi-polar and non-symmetric surfaces. For the first two types, they are composed of symmetric surfaces on the top and bottom of the thin film, hence their surface energies can be obtained easily by assuming that the formation energies are identical on both surfaces. The third type of surfaces are asymmetric with a significant dipole moment perpendicular to the surface planes. Among these types of surface, the formation energies are difficult to obtain. Strictly speaking, the formation energies of polar surfaces may diverge for highly ionic crystal, such as alkali halide crystals with a strong dipole field, and charge transfer among surfaces are significant[3241]. However, for semiconducting compounds, the covalent nature may still make the formation energy of surfaces converge when the thickness of the thin film is large enough. For simplicity, it is therefore preferable to base our discussion on surfaces created from relatively covalent binary compound crystals. In this review article, we focus on the computational aspect of surface energies of semiconducting binary compounds, briefly on non-polar surfaces and edges and mainly on their polar surfaces, semi-polar surfaces, and polar edges for 2D materials.

    Before any algorithm is discussed, let us briefly have an overview on the history of the algorithm developments so as to have a general understanding of key advancements in the algorithm design of semiconductor surfaces and edges.

    For non-polar surfaces, Feibelman, in 1983, used metallic Al and Mg crystal as examples to demonstrate the calculation of non-polar surface energies[42], which has been also widely applied in semiconductors until now.

    For polar surfaces, Chetty and Martin, in 1991, made the first attempt to calculate the absolute surface energy as an integral of local energy density[43]. Even though this preliminary method is not as accurate as the prevalent strategies nowadays, it provided the basic idea of creating an adapted surface unit cell bounded by high symmetry planes for the calculation. Then in 2004, Zhang and Wei proposed a method using different sizes of wedges and a slab for the calculation of polar surface energies, using GaAs as an example[44]. Making use of the subtraction between different wedge sizes, edge (or called ridge) contribution can be cancelled out. The polar surface energy can be estimated by algebraic operation on the energies obtained from both wedges and slab. Later, Rempel et al., in 2005, using CdSe as an example, proposed a similar method to Zhang and Wei but Rempel’s method made use of wedges terminated by both cat- and an-ion at each size in the cancellation procedure[45]. After that, Jenichen, in 2013, proposed a method of using a heterojunction supercell, constructed by both ZB- and WZ-GaAs, to approximate unknown surface energies from known ones[46]. Nevertheless, this approach is still not free of the coupling between conjugated surfaces, which is the major obstacle. In 2016, a tetrahedral cluster was invented by Zhang et al. to calculate the chemical potential of pseudo-H atoms at different surface locations[47], which satisfy the ECM to minimize the stress induced by the passivation. These pseudo atoms were then used to passivate the bottom surface of the slab model so as to mimic the semi-infinite structure. The energies of polar surfaces can easily be obtained. This method can be directly applied to both wurtzite and zinc-blende semiconductors.

    For semi-polar surfaces, Li et al., in 2015, proposed a wedge scheme to find the energy difference between surfaces and a reference polar surface in the system of GaN[9]. Wedges of different sizes and slabs of both polar and semi-polar surfaces were involved. However, individual surface energies were still not found. Besides, the discrepancy between the Wulff construction and the experimental observation indicated that errors existed in the calculation. Later, Zhang et al., in 2018, suggested a slab model of GaN with a bottom surface being cut into a zigzag shape composed of non-polar and polar surfaces which can be easily passivated[48]. The semi-polar surface at the top side can then be calculated individually. The steric effect caused by passivation can also be included by simulating its contribution in a slab calculation with a “well” that has similar steric corners. This approach is able to remove the effect of unphysical charge transfer and steric effect in the steps, yielding a high accuracy. Currently, Seta et al., in 2019, proposed a scheme including both passivated wedges and slab of AlN to estimate the surface energies[49], which is a similar method to that proposed by Li et al. but has an improvement on the removal of unphysical charge transfer by passivation. In addition, the temperature effect had been taken into account by calculating the partition function of translational, vibrational, and rotational motions of the atoms. However, direct passivation of semi-polar surface was involved, which may induce the steric effect between pseudo-H atoms and finally affect the accuracy of surface energy estimation.

    For polar edges of 2D materials, Mukherjee et al., in 2011, presented a strategy with pure bare triangular clusters of h-BN in single size, each of which has only one type of exposed edge, to calculate the edge energies individually[50]. It is now known that the unphysical charge transfer substantially affects the accuracy of the algorithm. In 2015, Cao et al. offered a scheme as an extension to Mukherjee et al.’s method[51]. Bare triangular MoS2 clusters of different sizes were used so that the error from corner contribution is reduced by energy subtraction between nanoclusters of different sizes. This algorithm can only predict the morphology of MoS2 at the S-rich limit while discrepancy with the experimental observation in the Mo-rich limit indicates there are pitfalls in the calculation. There could be unphysical charge transfer at the corner of triangular clusters, which was later shown to be removed by passivation, and the omission of temperature effect. Later, in the study of morphology of h-BN nanoclusters, half-passivated nanoribbons were created to estimate the energies of polar edges individually by Zhang et al. in 2018[3]. Ordinary H atoms were employed in the passivation, whose chemical potential was obtained from the quadratic fitting of the equation formulating the total energy of fully-passivated triangular nanoclusters. In addition, the temperature effect was included by extrapolating the extra Gibbs free energy of H atoms from the experimental data. The morphologies obtained from the theoretical calculation are consistent with the experimental works.

    After the historical review, the algorithm designs for the calculation of different surface and edge energies are going to be discussed separately as follows.

    Before diving into polar and semi-polar surfaces and polar edges, it is good to have a brief review on the non-polar surface or edges, and compare them with polar and semi-polar ones. For slab (ribbon) exposing non-polar surfaces (edges), the constituent elements are in the stoichiometric ratio within the whole structure. Therefore, there is no need to consider the chemical potential contribution from individual elements. Also, since the top and bottom surfaces are identical, it is possible to obtain the formation by assuming both surfaces have the same contribution to the total formation energy. This idea was first proposed by Feibelman in metallic materials[42]. We can directly apply the following equation to obtain the surface energy

    $ \gamma = \frac{1}{2a}(E_{\rm{slab}}-nE_{\rm{bulk}}), $ (2)

    where is the area (length) and is the total energy of 2D sheet (or 1D nanoribbon); n is the number of unit cells; is the total energy per formula of infinite bulk structure. The calculation of the energy of a non-polar surface (or edge) is straight forward because the energy will be a constant under different supply ratio of the constituent elements. This method can be modified and applied to the surfaces (or edges) of the second type, namely, polar and symmetric surfaces or edges. Even though they are symmetric, the surface (or edge) energies are dependent on the supply concentration of constituent elements. To deal with this problem in binary compounds, there is a prevalent method to parametrize the surface energy by the variation of chemical potential of one of the constituent atoms[52]. Under the condition of thermodynamic equilibrium between the bulk region and surfaces, there is a relation between the nano-crystal total energy and the chemical potentials of its constituents.

    $ \mu_{\rm{A}}+\mu_{\rm{B}} = E_{\rm{AB}} = E_{\rm{A}}+E_{\rm{B}}+\Delta H_{\rm{f}}, $ (3)

    where is the total energy of the binary compound; , and , are the chemical potentials and total energies of species A and B, respectively, in their most stable elementary forms; is the formation energy of compound AB. The ground state energy of the element and the formation energy of the binary compound thus set the boundaries for the chemical potential of the individual elements in the compound.

    $ E_\alpha+\Delta H_{\rm{f}} \leqslant\mu_\alpha\leqslant E_\alpha, $ (4)

    where can be element A or B. It is also customary to define a relative chemical potential ( ) by subtracting the per-atom ground state energy of the element,

    $ \Delta H_{\rm{f}} \leqslant \Delta\mu_{\alpha}\leqslant 0. $ (5)

    For symmetric surface (edge for 2D lattice) pairs, the surface (edge) energy is given by

    $ \gamma = \frac{1}{2a}(E_{\rm{slab}}-n_{\rm{A}}\mu_{\rm{A}}-n_{\rm{B}}\mu_{\rm{B}}), $ (6)

    where and are the total number of species A and B in the slab respectively. Although this approach is still simple, it fails to generalize to an arbitrary surface because constructing a symmetric slab may not be possible. On some polar surfaces or edges, a cleavage inevitably creates inequivalent anion and cation termination, application of Eq. (6) gives only the average surface energy of two inequivalent surfaces, an illustration of a zinc-blende (111)/( ) slab is shown in Fig. 2. We can always vary the chemical potential of individual species in the stable chemical potential range to yield different surface energies and hence different ECS. The history of different algorithms employed to find the surface energies and also the corresponding ECS of polar surface, semi-polar surface and 2D polar edge will be discussed.

    (Color online) A slab created by cleaving a zinc-blende structure in (111) plane, grey and yellow atoms represent atom species A and B. Note the resultant upper and lower surface is of different termination.

    Figure 2.(Color online) A slab created by cleaving a zinc-blende structure in (111) plane, grey and yellow atoms represent atom species A and B. Note the resultant upper and lower surface is of different termination.

    2. Polar surfaces

    At the earliest stage of polar surface study of semiconductors, fractionally charged pseudo hydrogen (pseudo-H) has been suggested to passivate one of the surfaces of the slab model so as to remove the charge transfer between surfaces[53]. This approach allows us to study the polar surfaces individually. However, at the time of publication, the removal of the electrostatic effect between surfaces by this kind of passivation has been shown, but has not been implemented in the surface energy calculation. The first attempt to calculate absolute surface energy defined a local energy density and integrated over the surface region[54]. Chetty and Martin[43] generalized the symmetry argument of Appelbaum, Baraff and Hamann[55] to low symmetry surface by creating a symmetry-adapted surface unit cell bound by high symmetry planes, and computed the surface energy as an integral of local energy density. This method is first applied to the calculation of ideal GaAs (111) and ( ) absolute surface energy, bridging previous studies of relative surface energy on these surfaces to show that Ga-trimer and As-trimer reconstructed ( ) surfaces are always more stable than reconstructions on (111) or (110) surfaces[56]. However, calculations by Moll et al. using the same procedure failed to agree on the splitting of slab energy between the (111) and ( ) surface, leading to a discrepancy that Ga-trimer is significantly less stable[57], possibly due to a nontrivial approximation in the local energy density[44].

    Zhang and Wei[44] first attributed the origin of surface energy to the local bonding environment of individual surface atoms, and proposed a more sophisticated geometry to be constructed to compute the absolute surface energy of polar surfaces from surfaces of known energies, applicable to surfaces that are inaccessible by the standard slab method from surfaces of known energies. In their work[44], an infinite wedge geometry with 2 equivalent surfaces and one distinct surface (Fig. 3) is used. Under this geometry, the total surface energy of the wedge can be attributed to energies from three surfaces and three edges. The unknown surface energy can be solved by taking the energy difference between two reasonably large wedges of different sizes so that the converged edge contribution cancels out. Rempel et al.[45] also considered the convergence with respect to wedge size, and proposed to base the cancellation on the difference of edge energies by considering both cat- and an-ion termination at each size. Using this wedge method, Zhang and Wei[44] shows a result similar to Moll[57] in GaAs, and the method was applied to the CdSe polar surfaces[45, 58] and GaN with surface passivation to reduce charge transfer between surfaces[59].

    (Color online) Wedge structure of size n = 4 composed of two equivalent (111) and one (001) surface used in the calculation scheme of Zhang et al.[44].

    Figure 3.(Color online) Wedge structure of size n = 4 composed of two equivalent (111) and one (001) surface used in the calculation scheme of Zhang et al.[44].

    A heterojunction supercell (Fig. 4) was also used to approximate unknown surface energies from known ones[4, 46]. The total energy of the slab is assumed to consist of additive components from two surfaces, interface and bulk[46],

    An illustration of a slab containing an interface and two passivated surfaces.

    Figure 4.An illustration of a slab containing an interface and two passivated surfaces.

    $ E_{\rm{slab}} = E_{{\rm{surface}}\ {\rm{A}}}+E_{{\rm{surface}}\ {\rm{B}}}+E_{\rm{interface}}+\sum\limits_{ i}n_i \mu_{ i,{\rm{strained}}}. $ (7)

    In Eq. (7), chemical potential has to be obtained from strained bulk simulation using the slab lattice constant to account for stress due to lattice mismatch. The heterojunction scheme is employed to study the (001) and (00 ) surface of wurtzite GaAs[46], and subsequently ZnO[4]. The heterojunction geometry is similar to the slab approach, thus is not free of the averaged energy problem by construction, it can be seen in ZB(111)/WZ(001) interfaces as shown in Fig. 5 that the heterostructure would consist of two inequivalent interfaces. An averaged interface energy of two interfaces may substitute for exact interface energy, smaller interface energy compared to surface, interface being coherent, similarity in lattice parameters and local environment may justify such approximation in this work[4], however, a small lattice mismatch and coherent interface is not always possible.

    (Color online) A ZB(111)/WZ(001) heterojunction supercell consists of 6 WZ and ZB layers used in the calculation scheme of Tang et al.[4]. Note the two interfaces indicated by dashed lines are inequivalent in that ion termination at the interface exchanged.

    Figure 5.(Color online) A ZB(111)/WZ(001) heterojunction supercell consists of 6 WZ and ZB layers used in the calculation scheme of Tang et al.[4]. Note the two interfaces indicated by dashed lines are inequivalent in that ion termination at the interface exchanged.

    With the key assumption of localized energy contributions, the energy of an isolated crystal can be computed[44, 58] as

    $\begin{array}{l} E_{{\rm{tot}},{\rm{AB}}} = n_{\rm{A}}\mu_{\rm{A}} + n_{\rm{B}}\mu_{\rm{B}} + \displaystyle\sum\limits_{\rm{surfaces}}\sigma_{\rm{surfaces}} \\ \quad\quad\quad\quad+\displaystyle\sum\limits_{\rm{edges}}\sigma_{\rm{edges}} + \displaystyle\sum\limits_{\rm{corners}}\sigma_{\rm{corners}}. \end{array} $ (8)

    The passivated surface energy can then be systematically obtained by cancellation of bulk, edge and corner contributions. The transferability of such an estimation scheme mainly depends on 1) the ability of the proposed structure to capture the local bonding environment of the surface to be estimated, and 2) good size convergence of the proposed structure so that systematic cancellation of other contributions is possible. Zhang et al. proposed a tetrahedral cluster reproducing the same symmetry as the zinc-blende[47]. The definition of is taken to be the energy associated with the surface (edge, or corner) divided by the number of passivation hydrogen attached to A (or B) involved at the surface (edge, or corner). Pseudo-chemical potential (PCP) and representing the atomic chemical potential plus the passivation contribution can then be normalized by simple surface atom counting. A crude estimation of pseudo-chemical potential can be obtained from the smallest cluster of 4 pseudo-hydrogen passivating a host atom A as

    $ E(\rm{AH}_4) = 4\mu_{{\rm{H}}_{\rm{A}}} + \mu_{\rm{A}}. $ (9)

    This estimation was shown to yield an acceptably accurate surface energy estimation[47]. More physical estimations of pseudo-chemical potential can be constructed by observing that the nature of passivating hydrogen is mostly influenced by its local bonding environment, which can be classified according to the hydrogen attachment to a host atom A at surface, edge or corner. For a zinc-blende structured cluster as shown in Fig. 6, the total energy of a cluster of size can be expressed

    (Color online) Tetrahedral cluster of zinc-blende structure of size n = 4 composed of identically passivated (111) surfaces, passivated edges and corners. The figure is adapted from Ref. [60].

    Figure 6.(Color online) Tetrahedral cluster of zinc-blende structure of size n = 4 composed of identically passivated (111) surfaces, passivated edges and corners. The figure is adapted from Ref. [60].

    $ \begin{array}{l} E_{\rm{tot}}(n) = \dfrac{1}{6}n(n+1)(n+2)\mu_{\rm{A}} + \dfrac{1}{6}\ n(n-1)(n+1)(E_{\rm{AB}}-\mu_{\rm{A}}) \\ \;\;\;\;\;\;\;\;\;\;\;\;\; +\, 2(n\!-\!2)(n\!-\!3)\mu_{{\rm{H}}_{\rm{A}}}^{\rm{surface}} \!+\! 12(n\!-\!2)\mu_{{\rm{H}}_{\rm{A}}}^{\rm{edge}} \!+\! 12\mu_{{\rm{H}}_{\rm{A}}}^{\rm{corner}}\!. \end{array} $ (10)

    Calculation of 4 clusters of different sizes allows solutions for all unknowns ( , , and ). It should be noted that although is physically interpreted as the bulk energy which should be equal to that from bulk calculation, solving for the term avoids error due to bulk energy differences across bulk and cluster calculations.

    With a fractional hydrogen[53] passivation scheme, in the case of multiple surface dangling bonds, more than one hydrogen is usually required per surface atom to satisfy the electron counting model (ECM) requirement and to preserve surface symmetry. Passivating hydrogen atoms can become too densely placed and induce a strong steric effect. The steric effect is particularly severe in systems with small lattice constants, and in the directions where periodicity is absent so uniform distribution of stress is not guaranteed. The significant non-uniform stress produces visible distortion and long-ranged variation in bond lengths and bond angles and results in a slow size convergence, which deteriorates cancellation of edge contribution in the wedge method between small sized wedges[60]. Zhang et al.[60] introduced a passivation by other atoms to compute the absolute surface energy of ZB/WZ ZnO and GaN, a pseudo-chemical potential is defined per surface passivating atom similar to the procedure in the tetrahedral cluster method. The choice of surface passivating atom should a) satisfy ECM same as the case of hydrogen; and b) have a correct size that minimizes the stress induced by the passivation, to achieve better accuracy and convergence with respect to wedge size.

    Absolute interface energy is of equivalent physical interest including the determination of the wetting condition[61] and band offset[62]. It is also interesting to note that the connection between surface and interface energy established in a slab construction (Fig. 4) allows the determination of the absolute interface energy. To determine the absolute stability of interfaces, a common energy reference among all interfaces at different terminations and orientations must be known. In traditional superlattice approaches[4, 63, 64], an interface cannot be created independently of the other complementary interface, which prohibits the determination of the absolute interface energy. The superlattice approach is thus only capable of comparing relative stability of reconstructions at a single interface[63], or the calculation of the averaged interface energy of the two complementary interfaces[4]. Coupling between two interfaces would also induce unphysical charge transfer and dipole-dipole interaction. Akiyama et al.[62] and Zhang[61] independently demonstrated the viability of the slab construction to determine the absolute interface energy, with the former utilizing the wedge method with passivation and the latter utilizing the pseudo-hydrogen method for surface. Similar methodology is used to compare the stability between different terminations and reconstructions of 3 {112} grain-boundary in Cu ZnSnS [65], suggesting the engineering importance of this method.

    3. Semi-polar surfaces

    Over the past few decades, even though the technologies in industrial application, like the quantum dot light-emitting diodes (LEDs)[66, 67], of WZ based semi-conductors have been becoming mature[3338], it is still a challenge to have high quality crystal growths as well as control of their morphologies[3941, 60]. On account of the substantial achievements in InGaN based LEDs, Group-III nitrides have drawn a lot of attention[36]. To date, there is a major limitation to GaN-based optoelectronic devices that only blue emitters have been produced by polar GaN grown on a c-plane (0001) sapphire[3336, 68]. It it also unfavorable to manufacture green- and yellow-light LEDs with high efficiency, given that high quality InGaN with a high indium concentration is a prerequisite[41, 6871], because of the miscibility gap led by significant atom mismatch among indium and gallium and the piezoelectric effect upon polar surfaces. The growth along non-polar or semi-polar plane in GaN thin film could be a suitable strategy to overcome this critical barrier, especially in a semi-polar direction[7279], it is because the recruitment of relatively larger indium atoms can be assisted by any site that is under tensile stress[41, 75]. Besides, owing to the fact that there is a weaker piezoelectric effect among semi-polar surfaces[80], leading to both intensified indium recruitment[68, 75, 76] and weakened quantum confined Stark effects[8082]. Nevertheless, different from polar surfaces, there was a lack of elementary knowledge about semi-polar surfaces because no workable algorithm was present for the calculation of absolute surface energies of individual semi-polar surfaces.

    The definition of a semi-polar surface, with an example shown in Fig. 7, was initially made by Baker et al.[83] as surfaces being cut in the planes with one of the h, k, and i index and l index being nonzero in the (hkil) Miller–Bravais indexing convention, crossing the hexagonal unit cell diagonally and forming a non-orthogonal angle with the c-plane.

    (Color online) GaN crystal with 3 different types of surface cut. The semi-polar one is highlighted pink.

    Figure 7.(Color online) GaN crystal with 3 different types of surface cut. The semi-polar one is highlighted pink.

    A comprehensive understanding of the absolute surface energies of all possible GaN surfaces is crucial to the estimation of equilibrium shape in the thermodynamic stability study, leading to important factors that can be used to modulate the crystallographic growth of GaN, which are regarded as the key issue in the realization of broadband and multi-color emission[8491].

    There is an early method proposed by Jindal and Shahedipour-Sandvik in 2009[92], that tries to find the energies of different GaN surfaces so as to create the ECS. However, only the average value of two conjugated surface energies can be acquired. In order to calculate the ECS in a more precise manner, the WZ wedge scheme was employed to find the energy differences between surfaces and a reference polar surface in 2014[9]. They proposed that since individual surface energies cannot be directly obtained, Eq. (6) is not applicable. Therefore, they first found the difference in surface energies between semi-polar and polar surfaces, then the surface energies of semi-polar surfaces can be obtained by further addition and subtraction of polar surface energies. The detailed procedures are illustrated below.

    A 2D scheme of Wulff construction is applied to one of the cross-sections of GaN as indicated in Fig. 8. The length of is fixed but the origin can be varied in position between A and B. The position of origin, which is unknown now, depends on the individual energies between surfaces (0001) and (000 ). is the difference in crystal plane radii of plane and the plane (0001) in [0001] direction. We can do the same trick for plane to obtain . Hence, we obtain and . For different and values, the blue lines can be shifted vertically. After obtaining and , the origin can be located by the normal vectors of planes and , a quarter of the Wulff construction is done.

    (Color online) Wulff construction of one of the 2D cross-sections of GaN. The yellow shaded area is a quarter of ECS in the cross-section. This strategy is from Ref. [9].

    Figure 8.(Color online) Wulff construction of one of the 2D cross-sections of GaN. The yellow shaded area is a quarter of ECS in the cross-section. This strategy is from Ref. [9].

    For this example, is defined as the surface energy for finite area but not the unit area. Following the flow in Fig. 9, a subtraction was made between the total energies of two wedges of different sizes to find the unrelaxed in step I. The total energy of a slab with semi-polar surfaces on both sides was also calculated so as to obtain . Then in step II, can be obtained by subtraction of the results from step I. The factor is absorbed in , thus it was already possible to implement the Wulff construction of equilibrium shape corresponding to the unrelaxed structure. Since the author aimed at obtaining the relaxed value of , one more slab, with one side relaxed and the other side being passivated by hydrogen and fixed, of polar surfaces was calculated in step II to obtain . Finally, in step III, the value of was claimed to be obtained by the subtraction of results from step II, hence and . Following the same procedures for other cross-sections of different azimuthal angles, a volumetric Wulff construction was performed and shown in Fig. 3(c) of the literature[9].

    (Color online) Workflow of finding the difference in crystal plane radii. Blue and black notations correspond to unrelaxed and relaxed surface structures respectively. This strategy is from Ref. [9].

    Figure 9.(Color online) Workflow of finding the difference in crystal plane radii. Blue and black notations correspond to unrelaxed and relaxed surface structures respectively. This strategy is from Ref. [9].

    However, based on the experimental observation from[93], the nanocrystals did not show the appearance of a (11 0) surface while the simulated results contain this surface for a large range of . This discrepancy indicates that their results are rather approximated and also it is difficult to judge by individual surface energies since only relative energies were found. Besides, passivation was not performed on the wedge structures so that unphysical charge transfer should be present, being especially severe at the corner. The relative stability of different surfaces could be affected so as to alter the ECS. Therefore, this algorithm may not be able to give accurate predictions on the equilibrium shape in the growth study.

    The acquisition of accurate energies of semi-polar surfaces is particularly difficult for three reasons: firstly, the conventional slab method cannot be used to deal with individual semi-polar surfaces resulting from the structural asymmetry; secondly, large computational input in the form of wedges, usually with high index planes, are involved which leads to high computational cost; thirdly, as semi-polar surfaces are sometimes of a step nature, it is not always feasible to passivate the bottom surfaces of slabs with pseudo-H atoms in the absence of significant unphysical charge transfer and steric effect, which deteriorates the result accuracy[47, 60].

    To overcome these mentioned difficulties, Zhang et al. introduced a fundamentally different algorithm in 2018, using GaN as an example[48]. The practice of passivation on polar surfaces is generally not applicable to semi-polar surfaces because a substantial steric effect may appear among the passivating agents and ECM may not be easily satisfied[94]. A feasible approach is to cut the semi-polar surface of the slab with a step-like structure so that the surfaces exposed are instead non-polar and polar which can be passivated by suitable pseudo-H much more easily, as shown in Fig. 10(a). Nevertheless, solely applying the above modification may not fully solve the problem because the steric effect may still be present at the location of included angles (or corners) between non-polar and polar surfaces, indicated in Fig. 10(b). Thus, a unique treatment can be implemented to take the steric effect into account. This new strategy is essentially different from the early treatments in the calculation of surface energies and is generally applicable to the study of other high indexed surfaces which are difficult to handle.

    (Color online) (a) and (b) are slabs with upper semi-polar surfaces of m- and a-family, respectively, and with bottom side cut into step-structure in which the non-polar and polar surfaces are passivated by either H or pseudo-H. These figures are adapted from Ref. [48].

    Figure 10.(Color online) (a) and (b) are slabs with upper semi-polar surfaces of m- and a-family, respectively, and with bottom side cut into step-structure in which the non-polar and polar surfaces are passivated by either H or pseudo-H. These figures are adapted from Ref. [48].

    According to Eq. (3),

    $ \mu_{\rm{Ga}}+\mu_{\rm{N}} = E_{\rm{GaN}} = E_{\rm{Ga}} + E_{{\rm{N}}_2} + \Delta H_{\rm{f}}({\rm{GaN}}), $ (11)

    where , and are the energies per formula of solid Ga, gaseous N and bulk GaN respectively; and are the chemical potentials of Ga and N atoms. (GaN) is the formation enthalpy of WZ GaN. Then the energy of the semi-polar surface can be obtained by

    $ \begin{array}{l} \gamma = \dfrac{1}{A}\{E_{\rm{slab}}-n_{\rm{Ga}}[E_{\rm{Ga}}+\Delta H_{\rm{f}}({\rm{GaN}})]-n_{\rm{N}} E_{{\rm{N}}_2} \\ \quad\quad-\;(n_{\rm{N}} - n_{\rm{Ga}})\Delta\mu_{\rm{N}} - \displaystyle\sum\mu_{{\rm{H}}_{\rm{Ga}}} - \displaystyle\sum\mu_{{\rm{H}}_{\rm{N}}}\}, \end{array}$ (12)

    where and A are the total energy of the slab with passivated bottom and the surface area of the top surface. and are the number of Ga and N atoms, respectively. is the relative chemical potential. The PCPs of hydrogen passivating Ga and N atoms, and , are estimated by using the tetrahedral cluster of ZB GaN, which is mentioned in the section on polar surfaces.

    However, taking the semi-polar surface (11 X) as an example, the passivating H atom may experience the steric effect at the concave corner of bottom surface as indicated in Fig. 10(b). There was another treatment proposed to include this steric effect[48]. As indicated in Fig. 11, a slab with a well is created in which all surfaces are passivated with pseudo hydrogen. The steric effect on the pseudo-H passivating the Ga atoms can be calculated by

    (Color online) Slab with a well being cut with width and depth as w and d, respectively, that mimic the steric effects between pseudo hydrogen at the concave corner between the polar and non-polar plane. This figure is adapted from Ref. [48].

    Figure 11.(Color online) Slab with a well being cut with width and depth as w and d, respectively, that mimic the steric effects between pseudo hydrogen at the concave corner between the polar and non-polar plane. This figure is adapted from Ref. [48].

    $ \begin{array}{l} \mu_{{\rm{H}}_{\rm{Ga}}}^{\rm{steric}} = \dfrac{1}{n_{{\rm{H}}_{\rm{Ga}}}^{\rm{steric}}}\Big[E_{\rm{slab}}-n_{\rm{Ga}}(E_{\rm{Ga}}+\Delta H_{\rm{f}}({\rm{GaN}}))\\ \quad\quad\quad\quad-\;n_{\rm{N}} E_{{\rm{N}}_2} - (n_{\rm{N}} - n_{\rm{Ga}})\Delta\mu_{\rm{N}} - \displaystyle\sum\mu_{{\rm{H}}_{\rm{Ga}}} - \displaystyle\sum\mu_{{\rm{H}}_{\rm{N}}}\Big], \end{array} $ (13)

    where is the number of pseudo hydrogen experiencing the steric effect. The steric effect on the pseudo-H passivating the N atoms can then be found by interchanging the Ga and N atoms of the slab. After obtaining the contribution due to the steric effect, the absolute energy of the semi-polar surface can be calculated by

    $ \begin{array}{l} \gamma = \dfrac{1}{A}\Big[E_{\rm{slab}}- n_{\rm{Ga}}(E_{\rm{Ga}}+\Delta H_{\rm{f}}({\rm{GaN}}))\\ \quad\quad-\;n_{\rm{N}} E_{{\rm{N}}_2} - (n_{\rm{N}} - n_{\rm{Ga}})\Delta\mu_{\rm{N}} - \displaystyle\sum\mu_{{\rm{H}}_{\rm{Ga}}} \\ \quad\quad-\displaystyle\sum\mu_{{\rm{H}}_{\rm{N}}}-n_{{\rm{H}}_{\rm{Ga}}}^{\rm{steric}}\mu_{{\rm{H}}_{\rm{Ga}}}^{\rm{steric}}-n_{{\rm{H}}_{\rm{N}}}^{\rm{steric}}\mu_{{\rm{H}}_{\rm{N}}}^{\rm{steric}}\Big]. \end{array}$ (14)

    Zhang has used a slab with both sides cut with a zigzag structure to implement the convergence test to give a residual error less than 1.5 meV/Å2, indicating the high accuracy of the method. This new algorithm to estimate the absolute energy of semi-polar surface is completely different from the traditional methods which are based on wedges and slabs. It is because this new method is applicable to an arbitrary surface as long as we can passivate the polar and non-polar planes at the bottom surface with zigzag structure.

    Later on another Japanese group, Seta et al., published some literature in 2019 using both slabs and wedges to estimate the absolute energy of semi-polar surfaces[49]. His scheme is similar to that proposed by Li in 2014[9] except that Seta modified the surface of the wedges by passivation of hydrogen so as to remove unphysical charge transfer, indicated in Fig. 12.

    (Color online) Cross section view of AlN triangular wedge with surface () and (0001) which are passivated by hydrogen. Orange, silver and red spheres represent Al, N and H atoms respectively. The area bounded by a black line demonstrates that the removal of the area creates a smaller wedge. The strategy is from Ref. [49].

    Figure 12.(Color online) Cross section view of AlN triangular wedge with surface ( ) and (0001) which are passivated by hydrogen. Orange, silver and red spheres represent Al, N and H atoms respectively. The area bounded by a black line demonstrates that the removal of the area creates a smaller wedge. The strategy is from Ref. [49].

    After calculating the energies of wedges in Fig. 12 for different sizes, the same procedures were repeated by interchanging the position of Al and N atoms. Therefore, the energy difference (here we use the notation for surface energy instead of ) between passivated surface (11 2) and ( ) is given by

    $ \begin{array}{l} \sigma_{\rm{pass}}^{11\overline{2}2}-\sigma_{\rm{pass}}^{\overline{11}2\overline{2}} = \dfrac{1}{4A^{11\overline{2}2}}\{ [E_{\rm{wedge}}^{11\overline{2}2}({\rm{large}})-E_{\rm{wedge}}^{\overline{11}2\overline{2}}({\rm{large}})]\\ \;\;\;\;\;\;\;\;\;\;\;\;\;\;\;\;\;\;\;\;\;\;\;-[E_{\rm{wedge}}^{11\overline{2}2}({\rm{small}})-E_{\rm{wedge}}^{\overline{11}2\overline{2}}({\rm{small}})]\\ \;\;\;\;\;\;\;\;\;\;\;\;\;\;\;\;\;\;\;\;\;\;\;- 4[A^{ 000\overline{1}}\sigma_{\rm{pass}}^{ 000\overline{1}}-A^{\rm{0001}}\sigma_{\rm{pass}}^{\rm{0001}}]\\ \;\;\;\;\;\;\;\;\;\;\;\;\;\;\;\;\;\;\;\;\;\;\;+2[\mu_{\rm{N}}-\mu_{{\rm{A}}l}]\}, \end{array} $ (15)

    where , and are the area of , (000 ) and (0001) surfaces respectively; (large) and (small) are the total energies of large and small wedges of surface X respectively [X = or ( )]. and are surface energies of the 000 and 0001 planes, respectively. The individual and of polar surfaces were calculated by the method in literature[95]. Also, + was calculated by the conventional slab method with both sides passivated with pseudo hydrogen so that we can write as

    $ \sigma_{\rm{pass}}^{11\overline{2}2} = \frac{1}{A^{11\overline{2}2}}[E_{\rm{total}}^{11\overline{2}2}-\mu_{{\rm{A}}l}(n_{{\rm{A}}l}-n_{\rm{N}})-E_{\rm{AlN}}^{\rm{bulk}}n_{\rm{N}} - \mu_{\rm{H}} n_{\rm{H}} - A^{11\overline{2}2}\sigma_{\rm{pass}}^{\overline{11}2\overline{2}}], $ (16)

    where is the total energy of infinite bulk structure of AlN. Then absolute energy can be finally found by solving both Eqs. (15) and (16). Hence, the absolute energy of other semi-polar surfaces can be obtained by the same procedures.

    Seta has given one more improvement on the temperature dependence on the estimation of surface energies by including the translational, rotational and vibrational motion of atoms in gaseous phase into the chemical potential .

    $ \mu_{\rm{gas}} = -k_{\rm{B}} T \ln{\frac{gk_{\rm{B}} T}{p}\times \xi_{\rm{trans}} \xi_{\rm{rot}} \xi_{\rm{vib}}}, $ (17)

    where is the Boltzmann constant; T is the growth temperature; g is the degree of degeneracy of electron energy level; p is pressure; and , and are the partition functions of translational, rotational and vibrational motions, respectively. However, it could be controversial that Seta has made use of direct passivation of pseudo-H on the semi-polar surfaces of slabs where that steric effect could be severe and passivation on polar or non-polar surfaces should be implemented instead[48].

    Nearly at the same time, Akiyama, from the same Japanese group, proposed another algorithm to calculate the energy of polar and semi-polar surfaces simultaneously[96]. In the literature, it was claimed that Zhang’s method may not be general because he has used the ZB tetrahedral cluster to obtain the PCPs of passivating hydrogen, which were then applied to the WZ structure of GaN. The error coming from the deviation between ZB and WZ could be large if the materials have large ionicity. Also, he claimed that bond length between cation and pseudo-H could be too long to form the tetrahedrally coordinated atomic configuration so that the method is not applicable to compounds with small atomic size like BN and AlN. Therefore, he continued to use the scheme of creation of ideal slabs and wedges without any passivation of pseudo-H to formulate multiple equations describing the relation between different polar and semi-polar surfaces. Under the assumption of orientational independence of twofold or threefold coordinated Ga and N surface atoms, the energies of the twofold or threefold surface atoms can be obtained and used to estimate the energy of semi-polar surfaces by counting the number of twofold or threefold surface atoms on the corresponding plane. However, the avoidance of using pseudo hydrogen may induce a very severe error. Without the passivation on the surface atoms of the semi-polar plane, the degree of distortion will be different in different orientation so that the twofold or threefold surface atoms will experience a different local electronic and strain environment. To avoid such distortions and keep the orientation independence, the author, instead, calculated the unrelaxed structures to obtain the absolute energies. This eventually may lead to a large error due to the unphysical stress within the unrelaxed structure. It can be easily observed by the average of the absolute energy of polar surfaces (0001) and (000 ), which is significantly larger than the average values obtained from the conventional slab. In addition, the fundamental assumption of orientation independence may not be correct because when the structures are allowed to relax, the number and angle of bondings depend on the local environment. Therefore, the idealization made in the literature may not be applicable in the description of the real situation. In general, the key success in the high accuracy algorithm in the cluster or modified slab method[48] is largely due to the localization of charge density by pseudo-H passivation. The passivation energy is largely transferable across different microstructures. Therefore, the stability of the algorithm will be sacrificed if the passivation is removed.

    4. Polar edges of 2D materials

    In the world of 2D materials, graphene is the system that was first discovered and the most intensively studied[97101]. Its growth is relatively simple compared compounds, because it consists of one element. Thermodynamically, the ECS is relatively easy to be investigated because no matter how it is cut, the edges are always non-polar and hence the calculation of the edge energy is straightforward[101].

    In recent years, the family of 2D materials has grown larger, including compounds such as hexagonal boron nitride (h-BN) that is an insulator, and molybdenum dichalcogenides ( ), where X can be S, Se or Te, which are semiconductors[102]. The latter are often considered quasi-2D materials because they consist of several layers of atoms, unlike graphene or h-BN. Different morphologies of h-BN, MoS2 and MoS2 were observed in experiments. Triangle, truncated triangle and hexagon shapes were observed in both h-BN and MoS2 while fractal, three-point stars and multi-apex triangles were observed in MoS2[103105]. Usually convex edges suggest that the growth is near the equilibrium limit, while concave edges suggest a relatively non-equilibrium limit. Therefore, for triangle, truncated triangle, and hexagon shapes, the equilibrium shape can be investigated by the energy calculations under various growth conditions. However, other shapes with concave edges are usually due to the growth highly limited by kinetics and may often be off equilibrium[106], leading to a high complexity in the simulation of the reaction. In the following, only the shapes in thermodynamic equilibrium will be reviewed.

    To understand various equilibrium shapes in experiments, obtaining the energies of different edges are crucial. Due to the structural asymmetry of the nanoribbon of these compounds, as shown in Fig. 13, edges with polarities emerge. The direct calculation of polar edge energy is no longer achievable because the early method used in graphene can only estimate the average energies of two opposite zigzag edges in the ribbons[101].

    (Color online) (a)/(c) and (b)/(d) are the (top view/side view) of h-BN and nanoribbon with edges of opposite polarities, respectively.

    Figure 13.(Color online) (a)/(c) and (b)/(d) are the (top view/side view) of h-BN and nanoribbon with edges of opposite polarities, respectively.

    In the past few years, several groups have developed their own methods to estimate the absolute energy of polar edges. Most of them are based on the creation of triangular nanoclusters terminated at the edges with the same polarity[3, 51, 107]. Therefore, the excess Gibbs free energy[108] can be obtained by deducting the bulk chemical potential contributions, and the energy of the polar edge can be obtained after the excess energy is divided by three. Even for similar approaches, there are still some technical details that may significantly affect the accuracy. In the following, three examples based on first principle calculations using DFT will be examined and compared so that we can see the pitfalls of some early methods.

    In all methods, polar edge energies can be obtained under different chemical potentials. The range of the chemical potentials can be obtained from a standard calculation of phase diagram of various secondary phases of the compound, which has been widely applied in the energy calculations of point defects, surfaces, and interfaces[48, 65, 109].

    Besides chemical potential, passivation of edges is the key to the calculation of edge energy. For early methods, passivation was not taken into the consideration[51, 107]. The omission of edge passivation may lead to severe errors in the estimation of edge stability and equilibrium shape. Experiments and theory[110, 111] both suggest that a graphene sheet grown next to the transition metal step edge has lower energy for both zigzag and armchair edges, as a result of charge transfer from the step edge of the transition metal substrate to the edge of nano-structures. In addition, boron nitride grown in the direction with highest substrate atom packing has higher stability[112]. It was suggested that it is easy for the electron transfer from the highest packing plane of transition metal substrate to the edges of nano-structures[112]. Also, to model the asymmetric polar edges properly, it is essential to remove their interaction by passivating one side. During the growth, decomposition of precursors or carrier gases may lead to different passivation configurations that may strongly affect the final equilibrium shapes. Therefore, it is important to include the edge passivation effect in the estimation of edge and shape stability in 2D or quasi-2D materials.

    The first theoretical attempt was made by estimating the average energies of h-BN edges terminated by B and N[50]. However, such an estimation is too rough to derive accurate equilibrium shapes. Later, triangular clusters were created so that only one type of zigzag (ZZ) edge, which is polar, was investigated at a time[107]. In that paper, the energy of the polar edges was formulated by the following equations

    $ \gamma_{\rm{ZB}}(\mu) = \frac{E_{{\rm{B-}}{\rm{edged}}\ {\rm{cluster}}}-n_{\rm{BN}}\mu_{\rm{BN}}-n_{\rm{edge}}\mu_{\rm{B}}}{3n_{\rm{edge}}}, $ (18)

    $ \gamma_{\rm{ZN}}(\mu) = \frac{E_{{\rm{N-}}{\rm{edged}}\ {\rm{cluster}}}-n_{\rm{BN}}\mu_{\rm{BN}}-n_{\rm{edge}}\mu_{\rm{N}}}{3n_{\rm{edge}}}, $ (19)

    where is the edge energy per unit length of zigzag B-edge or N-edge, respectively; is the total energy of B- or N-edged triangular cluster, respectively; is the number of BN-pairs; is the energy of BN-pairs in a 2D-infinite BN sheet; are the chemical potential of excess B or N atoms in B-terminated or N-terminated triangular clusters, respectively; is the number of atoms at the edge. Also, . is a changing variable which plays the role of varying chemical potential in the experiment. The computational setup and results are summarized in Fig. 14(a). The equilibrium shape at various chemical potentials can be observed in Fig. 14(b), which showed the most stable edge changed from zigzag B-edge (ZB) to armchair (AC) then to zigzag N-edge (ZN) when the condition was changed from B-rich to N-rich (i.e. from left to right).

    (Color online) Wedge structure of size n = 4 composed of two equivalent (111) and one (001) surface used in the calculation scheme of Zhang et al.[44].

    Figure 3.(Color online) Wedge structure of size n = 4 composed of two equivalent (111) and one (001) surface used in the calculation scheme of Zhang et al.[44].

    The results suggest that it is possible for armchair-edged hexagon to exist at the mid-range of chemical potential. In addition, other literature gives the same computational prediction on the stability of the armchair edge[50, 113]. However, there has been no experimental observation of the existence of armchair hexagons or truncated triangles with armchair corners, while the alternating B- and N-terminated hexagons was observed experimentally[103]. Therefore, this calculation scheme may contain pitfalls in simulating the physical system under real conditions.

    The bare triangular cluster was reported to contain corner distortions and inter-edge couplings[114], which may produce extra systematic errors and lower the calculation accuracy. Usually, the edges of the clusters have a different electronic structure from the ribbons, with significant charge transfers and atomic reconstructions, which are especially severe near the corners. The most ideal situation is that all the edges in the triangles have the same electronic environment as those in the ribbon. To mimic the electronic environment of edges in the ribbons, it is important (1) to passivate one side of it and remove the inter-edge interaction; (2) to estimate the passivation energy of hydrogen by constructing triangles with passivated edges. However, this literature does not include detailed procedures in the passivation. Only in a later example[3], a more detailed scheme was provided. During the CVD growth of BN, a large amount of hydrogen may exist due to the decomposition of the precursors and passivate the edges, the passivation energy and related reconstructions were not systematically explored. In addition, the temperature effect of the passivation may play an important role in the stability[3] and was not considered.

    Another method proposed by Cao et al. to find the equilibrium shape of MoS2[51] is better than the previous one in handling the corner problem in the polar-edged triangular cluster. The structural inputs and different types of polar edges being studied are shown in Fig. 15. The energies of the triangular cluster with side length are

    (Color online) A ZB(111)/WZ(001) heterojunction supercell consists of 6 WZ and ZB layers used in the calculation scheme of Tang et al.[4]. Note the two interfaces indicated by dashed lines are inequivalent in that ion termination at the interface exchanged.

    Figure 5.(Color online) A ZB(111)/WZ(001) heterojunction supercell consists of 6 WZ and ZB layers used in the calculation scheme of Tang et al.[4]. Note the two interfaces indicated by dashed lines are inequivalent in that ion termination at the interface exchanged.

    $ \gamma = E_{\rm{Z}} + E_{\rm{ZPE}} - n_{\rm{Mo}}\mu_{\rm{Mo}} - n_{\rm{S}}\mu_{\rm{S}} = 3l\gamma_{\rm{Z}} + 3\gamma_{\rm{V}}, $ (20)

    where is the total energy of the triangular cluster of ; is the zero-point energy of the triangular cluster; and are the energies of the ZZ edge and the vertex. After calculations of two triangular clusters with different length edges, the corner contribution can be removed by subtraction. The S-terminated triangular example is used in the following equations

    $ \begin{array}{l} \;\;\;\; \gamma_{\rm{Z}} = (\Delta E_{\rm{Z}}+\Delta E_{\rm{ZPE}}-\Delta n_{\rm{Mo}}\mu_{{\rm{MoS}}_2}-\Delta n\mu_{\rm{S}})/3(l_1-l_2),\\ \;\;\;\; \Delta n_{\rm{Mo}} = n_{\rm{Mo}}(l_1)-n_{\rm{Mo}}(l_2),\\ \;\;\;\;\Delta n = n_{\rm{S}}(l_1) - n_{\rm{S}}(l_2)-2[n_{\rm{Mo}}(l_1)-n_{\rm{Mo}}(l_2)], \end{array} $ (21)

    where and are the difference of total energy and zero-point energy between two triangular clusters with edge length and respectively. The chemical potential of excess S atoms is so that it can be varied by varying . The Wulff construction of the calculation results are shown in Fig. 16.

    (Color online) GaN crystal with 3 different types of surface cut. The semi-polar one is highlighted pink.

    Figure 7.(Color online) GaN crystal with 3 different types of surface cut. The semi-polar one is highlighted pink.

    From the Wulff construction, the S-terminated triangular shape can be observed in an S-rich condition in which the shape matches the experimental results[104, 115, 116]. Besides, this S-rich edge is the ZZ-S2 edge which is a Y-shape rather than a pure zigzag structure, confirming the experimental result in Ref. [116]. However, when the chemical potential of S was reduced, a truncated triangular or hexagonal structure with ZZ-Z and ZZ-Z2 were predicted. This does not match the result of[116] in which the hexagonal structure is terminated by an alternating S-monomer attached Mo-edge and hydrogen-passivated S-edge. This discrepancy could probably be attributed to the exclusion of calculation that the S-monomer attached Mo-edge and also to the omission of consideration of the temperature effect. Therefore, the calculations failed to yield the proper experimental equilibrium shapes in the whole chemical potential range.

    Before entering the last example, it is good to mention that the method of Cao's example is suitable for obtaining a fast calculation. Yet, there is another method proposed by Zhang et al.[3] dealing with h-BN that can reduce the error from % by bare triangular to % by passivated triangular cluster. In his calculation, the importance of restoring the original bulk electronic configuration was emphasized. Theoretically, if we want to calculate the energy of an arbitrary edge, we have to create a semi-infinite crystal with only one edge exposed. This condition is imitated by passivation on one of the edges on a nanoribbon as shown in Fig. 17(c). The absolute energy of, for example, a zigzag boron (ZZB) edge is given by

    (Color online) Workflow of finding the difference in crystal plane radii. Blue and black notations correspond to unrelaxed and relaxed surface structures respectively. This strategy is from Ref. [9].

    Figure 9.(Color online) Workflow of finding the difference in crystal plane radii. Blue and black notations correspond to unrelaxed and relaxed surface structures respectively. This strategy is from Ref. [9].

    $ \gamma_{\rm{edge}} = \frac{1}{l}\left(E_{\rm{tot}}-n_{\rm{B}}\mu_{\rm{B}} - n_{\rm{N}}\mu_{\rm{N}} - n_{{\rm{H}}_{\rm{N}}}\mu_{{\rm{H}}_{\rm{N}}}-\sum\limits_{{i}}n_i\mu_i\right), $ (22)

    where is the total energy of the nanoribbon with arbitrary configurations on the upper edge in Fig. 17(c); , and are the number of B, N and passivating H atoms, respectively; , and are chemical potentials of B, N and passivating H atoms, respectively. and are the number and chemical potential of the adsorbed atoms, respectively.

    Therefore, instead of a direct calculation of edge energy from the bare triangular cluster, the chemical potentials of passivating hydrogens have to be first estimated from the passivated cluster. The reason for the more reliable calculation of the chemical potential of passivating hydrogen than the edge energy of the bare triangle is that the passivation helps to reduce corner distortion and the unphysical charge transfer[3] which can be compared in Figs. 17(d) and 17(e). In the calculation of chemical potential of passivating hydrogen in a triangular cluster, different size (m) of passivated triangular clusters are calculated so as to obtain their total energy .

    $ E_{\rm{tot}}^{\rm{cluster}} = \frac{m^2+m}{2}\mu_{\rm{N}} + \frac{m^2-m}{2}\mu_{\rm{B}} + (3m-6)\mu_{{\rm{H}}_{\rm{N}}} + 6\mu_{{\rm{H}}_{\rm{N}}}^{\rm{corner}}, $ (23)

    where m is the cluster size and is the chemical potential of hydrogen atoms at corners, as shown in Fig. 17(d). Practically, we can obtain under different values of and by non-linear fitting. In the thermodynamic equilibrium between the edges and the bulk h-BN, from Eq. (3),

    $ \mu_{\rm{B}}+\mu_{\rm{N}} = E_{{{\rm{h}}\rm{-}{\rm{BN}}}} = E_{\rm{B}} + E_{\rm{N}} + \Delta H_{{{\rm{h}}\rm{-}{\rm{BN}}}}, $ (24)

    where , and are energy per formula in bulk h-BN, solid B and gaseous N , respectively. is the formation enthalpy of h-BN. We can simplify Eqs. (23) and (24) taking chemical potential of N atoms ( ) as the parameter, can take a value between .

    $ E_{\rm{tot}}^{\rm{cluster}} \!=\! m^2\! \left(\!\frac{{E_{{{\rm{h}}-{\rm{BN}}}}}}{2}\!\right)+m\left(\!\mu_{\rm{N}}-\frac{{E_{{{\rm{h}}\!-\!{\rm{BN}}}}}}{2}+3{\mu_{{\rm{H}}_{\rm{N}}}} \!\right)+6({\mu_{{\rm{H}}_{\rm{N}}}^{\rm{corner}}}-{\mu_{{\rm{H}}_{\rm{N}}}}). $ (25)

    There are three red-colored parameters to be fitted , and . Therefore, a quadratic fitting is needed after of different m are obtained. The fitting graph is shown in Fig. 18. A direct check for the accuracy of the fitting is to compare the fitted with a separate calculation of the 2D monolayer.

    (Color online) (a) and (b) are slabs with upper semi-polar surfaces of m- and a-family, respectively, and with bottom side cut into step-structure in which the non-polar and polar surfaces are passivated by either H or pseudo-H. These figures are adapted from Ref. [48].

    Figure 10.(Color online) (a) and (b) are slabs with upper semi-polar surfaces of m- and a-family, respectively, and with bottom side cut into step-structure in which the non-polar and polar surfaces are passivated by either H or pseudo-H. These figures are adapted from Ref. [48].

    After the estimation of hydrogen chemical potential, the half-passivated ribbon with arbitrary configuration on the upper edge (Fig. 17(c)) can be calculated to obtain the absolute energy of the particular polar edge by Eq. (22). Also, Zhang has proposed a self-consistency check to ensure the accuracy of the algorithm by calculating the residual error Er. Er can be calculated by Eq. (26) after the calculation of total energy of both sides passivated ribbon Ep. Zhang has shown the error is reduced from 3.43% to 0.12% when compared with the bare triangular method.

    $ E_r = \frac{1}{2l}(E_{\rm{p}}-n_{\rm{N}}\mu_{\rm{N}}-n_{\rm{B}}\mu_{\rm{B}}-n_{{\rm{H}}_{\rm{N}}}\mu_{{\rm{H}}_{\rm{N}}}-n_{{\rm{H}}_{\rm{B}}}\mu_{{\rm{H}}_{\rm{B}}}). $ (26)

    After that, Zhang had shown in Fig. 3 of their literature[3] that bare armchair (ARM) is the most stable, which matches the computational results given by[50, 113] but does not match the experimental results[103]. Therefore, Zhang included the calculation of a passivated edge (upper edge) in which the chemical potential of the hydrogen is half of the total energy of H2 molecules . Also, he had included the consideration of the temperature effect by

    $ \mu_{\rm{H}} = \frac{1}{2}[E_{{\rm{H}}_2}+2\Delta\mu_{\rm{H}}(T,p)], $ (27)

    where captures the contributions from translational, rotational and vibrational motions at temperature and pressure . High temperature growth condition at 1300 K and 1 atm was simulated by the author in which the vibrational state of H2 was dominant in the contribution. Thus, he used

    $ \Delta\mu_{\rm{H}}(T,p) = \frac{G}{2N} $ (28)

    to obtain . N is the number of H2 molecules. is the Gibbs free energies of gaseous H2 in reference to absolute zero, which is obtained from the experimental data[117]. After the inclusion of temperature effect and passivation, the ZZNH edge becomes the most stable one and gives a triangular equilibrium shape in N-rich condition which is shown in Fig. 19. This matches the experimental result[103] and also gives a higher accuracy than the bare triangular cluster method. However, the chemical potential below each plot in Fig. 19 should be the phase boundary between the successive Wulff shapes, which is not clearly illustrated by the author. A better way for the author to illustrate this idea is to color the phase regions of different morphologies in the diagram of edge energies against . Besides, there is another unclear point in Fig. 19 that only the left five figures are in the stable chemical potential range of N atoms. The remaining two on the right morphologies are likely to be out of the stable range and were just listed out to indicate what morphologies could be if the chemical potential range can be further tuned by other physical quantities.

    (Color online) Slab with a well being cut with width and depth as w and d, respectively, that mimic the steric effects between pseudo hydrogen at the concave corner between the polar and non-polar plane. This figure is adapted from Ref. [48].

    Figure 11.(Color online) Slab with a well being cut with width and depth as w and d, respectively, that mimic the steric effects between pseudo hydrogen at the concave corner between the polar and non-polar plane. This figure is adapted from Ref. [48].

    After the discussion of several methods of calculating the polar edge energy, the last one proposed by Zhang, is able to capture more physical pictures and also gives the highest accuracy because it includes the temperature effect and passivation which leads to stabilization effect to all type of edges. It is also capable of revealing the important role played by hydrogen atoms in the growth of 2D h-BN monolayer.

    5. Conclusion

    We have reviewed some important historical algorithms on the assessment of surface and edge stability of various semiconducting compounds. The key concept for a successful algorithm is to eliminate the long range charge transfer and interaction of different surfaces or edges by passivating dangling bonds and mimicking the electronic environment of the desired surfaces or edges. In addition, not all passivation can yield a reliable result because an electron counting model has to be satisfied and steric effects should be avoided. To estimate the localized steric effects, it is possible to perform further simulation that can mimic the stressed local configuration. Still, further investigations of quasi-2D structures are highly important, yet largely missing because they lack effective passivation schemes on the edges. With all the technological advancements, we can safely conclude that a highly accurate algorithm combining a reasonable analysis of passivation and temperature effects can have strong predictive power in the equilibrium shape under various growth conditions and the dawn of a highly effective collaboration between theoreticians and experimentalists may largely improve the field of crystal growth and device fabrication of semiconductors.

    Acknowledgements

    The research is supported by HKRGC, GRF with the Project Codes of 14307219, 14307018, 14301318, and 14319416; and by direct grant from CUHK. .

    References

    [1] N C Bristowe, P B Littlewood, E Artacho. Surface defects and conduction in polar oxide heterostructures. J Phys B, 83, 205405(2011).

    [2] S Kahwaji, R A Gordon, E D Crozier et al. Surfactant-mediated growth of ferromagnetic Mn-doped Si. Phys Rev B, 88, 174419(2013).

    [3] J Zhang, W Zhao, J Zhu. Missing links towards understanding the equilibrium shapes of hexagonal boron nitride: algorithm, hydrogen passivation, and temperature effects. Nanoscale, 10, 17683(2018).

    [4] C Tang, M J S Spencer, A S Barnard. Activity of ZnO polar surfaces: an insight from surface energies. Phys Chem Chem Phys, 16, 22139(2014).

    [5] R Dingreville, J Qu, M Cherkaoui. Surface free energy and its effect on the elastic behavior of nano-sized particles, wires and films. J Mech Phys Solids, 53, 1827(2005).

    [6]

    [7] G Wulff. Xxv. zur frage der geschwindigkeit des wachsthums und der auflösung der krystallflächen. Zeitschrift für Kristallographie - Crystalline Materials, 34, 449(1901).

    [8] M P Curie. Sur la formation des cristaux et sur les constantes capillaires de leurs différentes faces. Bull Soc Fr Mineral, 8, 145(1885).

    [9] H Li, L Geelhaar, H Riechert et al. Computing equilibrium shapes of wurtzite crystals: The example of GaN. Phys Rev Lett, 115, 085503(2015).

    [10] N D Lang, W Kohn. Theory of metal surfaces: Charge density and surface energy. Phys Rev B, 1, 4555(1970).

    [11] R J Jaccodine. Surface energy of germanium and silicon. J Electrochem Soc, 110, 524(1963).

    [12] W R Tyson, W A Miller. Surface free energies of solid metals: Estimation from liquid surface tension measurements. Surf Sci, 62, 267(1977).

    [13] Boer F R de, R Boom, W C M Mattens et al. Cohesion in metals: Transition metal alloys. Elsevier Scientific Pub. Co.(1988).

    [14] H P Bonzel, A Emundts. Absolute values of surface and step free energies from equilibrium crystal shapes. Phys Rev Lett, 84, 5804(2000).

    [15] H P Bonzel, M Nowicki. Absolute surface free energies of perfect low-index orientations of metals and semiconductors. Phys Rev B, 70, 245430(2004).

    [16] A K Niessen, A R Miedema, Boer F R de et al. Enthalpies of formation of liquid and solid binary alloys based on 3d metals: IV. alloys of cobalt. Physica B+C, 151, 401(1988).

    [17] K C Mills, Y C Su. Review of surface tension data for metallic elements and alloys: Part 1-pure metals. Int Mater Rev, 51, 329(2006).

    [18] B J Keene. Review of data for the surface tension of pure metals. Int Mater Rev, 38, 157(1993).

    [19] J Y Lee, M Punkkinen, S Schönecker et al. The surface energy and stress of metals. Surf Sci, 674, 51(2018).

    [20] J P Perdew, H Q Tran, E D Smith. Stabilized jellium: Structureless pseudopotential model for the cohesive and surface properties of metals. Phys Rev B, 42, 11627(1990).

    [21] H L Skriver, N M Rosengaard. Surface energy and work function of elemental metals. Phys Rev B, 46, 7157(1992).

    [22] H Erschbaumer, A J Freeman, C L Fu et al. Surface states, electronic structure and surface energy of the Ag (001) surface. Surf Sci, 243, 317(1991).

    [23] R J Needs, M Mansfield. Calculations of the surface stress tensor and surface energy of the (111) surfaces of iridium, platinum and gold. J Phys Condens Matter, 1, 41(1989).

    [24] L Vitos, A Ruban, H Skriver et al. The surface energy of metals. Surf Sci, 411, 186(1998).

    [25] I Galanakis, N Papanikolaou, P H Dederichs. Applicability of the broken-bond rule to the surface energy of the fcc metals. Surf Sci, 511, 1(2002).

    [26] M Methfessel, D Hennig, M Scheffler. Trends of the surface relaxations, surface energies, and work functions of the 4d transition metals. Phys Rev B, 46, 4816(1992).

    [27] A M Rodríguez, G Bozzolo, J Ferrante. Multilayer relaxation and surface energies of fcc and bcc metals using equivalent crystal theory. Surf Sci, 289, 100(1993).

    [28] R Tran, Z Xu, B Radhakrishnan et al. Surface energies of elemental crystals. Sci Data, 3, 160080(2016).

    [29] P Hohenberg, W Kohn. Inhomogeneous electron gas. Phys Rev, 136, B864(1964).

    [30] W Kohn, L J Sham. Self-consistent equations including exchange and correlation effects. Phys Rev, 140, A1133(1965).

    [31] W A Harrison. Theory of polar semiconductor surfaces. J Vac Sci Technol, 16, 1492(1979).

    [32] P W Tasker. The stability of ionic crystal surfaces. J Phys C, 12, 4977(1979).

    [33] S Nakamura, T Mukai, M Senoh. Candel-class high-brightness InGaN/AlGaN double-heterostructure blue-light-emitting diodes. Appl Phys Lett, 64, 1687(1994).

    [34] S Nakamura, M Senoh, S I Nagahama et al. InGaN-based multi-quantum-well-structure laser diodes. Jpn J Appl Phys, 35, L74(1996).

    [35] S Nakamura. The roles of structural imperfections in InGaN-based blue light-emitting diodes and laser diodes. Science, 281, 956(1998).

    [36] S Nakamura, S Pearton, G Fasol. The blue laser diode: The complete story. Springer(2000).

    [37] D M Bagnall, Y F Chen, Z Zhu et al. Optically pumped lasing of zno at room temperature. Appl Phys Lett, 70, 2230(1997).

    [38] Ü Özgür, Y I Alivov, C Liu et al. A comprehensive review of ZnO materials and devices. J Appl Phys, 99, 041301(2005).

    [39] L Guo, Y L Ji, H B Xu et al. Regularly shaped, single-crystalline ZnO nanorods with wurtzite structure. J Am Chem Soc, 124, 14864(2002).

    [40] B Liu, Y Bando, C Tang et al. Wurtzite-type faceted single-crystalline gan nanotubes. Appl Phys Lett, 88, 093120(2006).

    [41] Y Zhang, J Zhu. Surfactant antimony enhanced indium incorporation on ingan (000-1) surface: A dft study. J Cryst Growth, 438, 43(2016).

    [42] P J Feibelman. Static quantum-size effects in thin crystalline, simple-metal films. Phys Rev B, 27, 1991(1983).

    [43] N Chetty, R M Martin. Determination of integrals at surfaces using the bulk crystal symmetry. Phys Rev B, 44, 5568(1991).

    [44] S B Zhang, S H Wei. Surface energy and the common dangling bond rule for semiconductors. Phys Rev Lett, 92, 086102(2004).

    [45] J Y Rempel, B L Trout, M G Bawendi et al. Properties of the CdSe (0001), (000-1), and (11-20) single crystal surfaces: Relaxation, reconstruction, and adatom and admolecule adsorption. J Phys Chem B, 109, 19320(2005).

    [46] A Jenichen, C Engler, B Rauschenbach. Comparison of wurtzite and zinc-blende GaAs surfaces as possible nanowire side walls: Dft stability calculations. Surf Sci, 613, 74(2013).

    [47] Y Zhang, J Zhang, K Tse et al. Pseudo-hydrogen passivation: A novel way to calculate absolute surface energy of zinc blende (111)/(-1-1-1) surface. Sci Rep, 6, 20055(2016).

    [48] Y Zhang, J Zhang, J Zhu. Stability of wurtzite semipolar surfaces: Algorithms and practices. Phys Rev Mater, 2, 073401(2018).

    [49] Y Seta, T Akiyama, A M Pradipto et al. Absolute surface energies of semipolar planes of aln during metalorganicvapor phase epitaxy growth. J Cryst Growth, 510, 7(2019).

    [50] R Mukherjee, S Bhowmick. Edge stabilities of hexagonal boron nitride nanoribbons: A first-principles study. J Chem Theory Comput, 7, 720(2011).

    [51] D Cao, T Shen, P Liang et al. Role of chemical potential in flake shape and edge properties of monolayer MoS2. J Phys Chem C, 119, 4294(2015).

    [52] K Rapcewicz, B Chen, B Yakobson et al. Consistent methodology for calculating surface and interface energies. Phys Rev B, 57, 7281(1998).

    [53] K Shiraishi. A new slab model approach for electronic structure calculation of polar semiconductor surface. J Phys Soc Jpn, 59, 3455(1990).

    [54] N Chetty, R M Martin. First-principles energy density and its applications to selected polar surfaces. Phys Rev B, 45, 6074(1992).

    [55] J A Appelbaum, G A Baraff, D R Hamann. GaAs(100): Its spectrum, effective charge, and reconstruction patterns. Phys Rev B, 14, 1623(1976).

    [56] N Chetty, R M Martin. GaAs (111) and (1’-.2m”.3m’ ’.2m”-.3m’ 1’-.2m”.3m’ ’.2m”-.3m’ 1’-.2m”.3m’ ’.2m”-.3m’) surfaces and the GaAs/AlAs (111) heterojunction studied using a local energy density. Phys Rev B, 45, 6089(1992).

    [57] N Moll, A Kley, E Pehlke et al. GaAs equilibrium crystal shape from first principles. Phys Rev B, 54, 8844(1996).

    [58] L Manna, R Wang et al. First-principles modeling of unpassivated and surfactant-passivated bulk facets of wurtzite CdSe: A model system for studying the anisotropic growth of CdSe nanocrystals. J Phys Chem B, 109, 6183(2005).

    [59] C E Dreyer, A Janotti, C G Van de Walle. Absolute surface energies of polar and nonpolar planes of GaN. Phys Rev B, 89, 081305(2014).

    [60] J Zhang, Y Zhang, K Tse et al. New approaches for calculating absolute surface energies of wurtzite (0001)/(000-1): A study of ZnO and GaN. J Appl Phys, 119, 205302(2016).

    [61] J Zhang, Y Zhang, K Tse et al. Hydrogen-surfactant-assisted coherent growth of GaN on ZnO substrate. Phys Rev Mater, 2, 013403(2018).

    [62] T Akiyama, H Nakane, K Nakamura et al. Effective approach for accurately calculating individual energy of polar heterojunction interfaces. Phys Rev B, 94, 115302(2016).

    [63] J V Pezold, P D Bristowe. Atomic structure and electronic properties of the GaN/ZnO (0001) interface. J Mater Sci, 40, 3051(2005).

    [64] A B Yankovich, B Puchala, F Wang et al. Stable p-type conduction from Sb-decorated head-to-head basal plane inversion domain boundaries in ZnO nanowires. Nano Lett, 12, 1311(2012).

    [65] M Wong, K Tse, J Zhu. New types of CZTS3112 grain boundaries: Algorithms to passivation. J Phys Chem C, 122, 7759(2018).

    [66] X Dai, Y Deng, X Peng et al. Quantum-dot light-emitting diodes for large-area displays: Towards the dawn of commercialization. Adv Mater, 29, 1607022(2017).

    [67] E Jang, S Jun, H Jang et al. White-light-emitting diodes with quantum dot color converters for display backlights. Adv Mater, 22, 3076(2010).

    [68] H Masui, S Nakamura, S P DenBaars et al. Nonpolar and semipolar III-nitride light-emitting diodes: Achievements and challenges. IEEE Trans Electron Devices, 57, 88(2010).

    [69] I Ho, G B Stringfellow. Solid phase immiscibility in GaInN. Appl Phys Lett, 69, 2701(1996).

    [70] T Matsuoka. Unstable mixing region in wurtzite In1–x–yGaxAlyN. J Cryst Growth, 189–190, 19(1998).

    [71] A Koukitu, Y Kumagai. Thermodynamic analysis of group III nitrides grown by metal-organic vapour-phase epitaxy (MOVPE), hydride (or halide) vapour-phase epitaxy (HVPE) and molecular beam epitaxy (MBE). J Phys Condens Matter, 13, 32(2001).

    [72] M Funato, M Ueda, Y Kawakami et al. Blue, green, and amber InGaN/GaN light-emitting diodes on semipolar {11-22} GaN bulk substrates. Jpn J Appl Phys, 45, 24(2006).

    [73] T Wunderer, P Brückner, B Neubert et al. Bright semipolar GaInN/GaN blue light emitting diode on side facets of selectively grown GaN stripes. Appl Phys Lett, 89, 041121(2006).

    [74] H Sato, R B Chung, H Hirasawa et al. Optical properties of yellow light-emitting diodes grown on semipolar (11-22) bulk GaN substrates. Appl Phys Lett, 92, 221110(2008).

    [75] J E Northrup. GaN and InGaN (11-22) surfaces: Group-III adlayers and indium incorporation. Appl Phys Lett, 95, 133107(2009).

    [76] Y Zhao, Q Yan, C Y Huang et al. Indium incorporation and emission properties of nonpolar and semipolar InGaN quantum wells. Appl Phys Lett, 100, 201108(2012).

    [77] M Monavarian, S Metzner, N Izyumskaya et al. Indium-incorporation efficiency in semipolar (11-22) oriented InGaN-based light emitting diodes. SPIE OPTO, 9363, 2P(2015).

    [78] R Bhat, G M Guryanov. Experimental study of the orientation dependence of indium incorporation in GaInN. J Cryst Growth, 433, 7(2016).

    [79] T Wang. Topical review: Development of overgrown semi-polar GaN for high efficiency green/yellow emission. Semicond Sci Technol, 31, 093003(2016).

    [80] T Takeuchi, H Amano, I Akasaki. Theoretical study of orientation dependence of piezoelectric effects in wurtzite strained GaInN/GaN heterostructures and quantum wells. Jpn J Appl Phys, 39, 413(2000).

    [81] D A B Miller, D S Chemla, T C Damen et al. Band-edge electroabsorption in quantum well structures: The quantum-confined stark effect. Phys Rev Lett, 53, 2173(1984).

    [82] T Takeuchi, S Sota, M Katsuragawa et al. Quantum-confined stark effect due to piezoelectric fields in GaInN strained quantum wells. Jpn J Appl Phys, 36, L382(1997).

    [83] T J Baker, B A Haskell, F Wu et al. Characterization of planar semipolar gallium nitride films on spinel substrates. Jpn J Appl Phys, 44, L920(2005).

    [84] C Herring. Some theorems on the free energies of crystal surfaces. Phys Rev, 82, 87(1951).

    [85] D Du, D J Srolovitz, M E Coltrin et al. Systematic prediction of kinetically limited crystal growth morphologies. Phys Rev Lett, 95, 155503(2005).

    [86] Y Enya, Y Yoshizumi, T Kyono et al. 531 nm green lasing of ingan based laser diodes on semi-polar 20-21 free-standing GaN substrates. Appl Phys Express, 2, 082101(2009).

    [87] C Liu, A Šatka, L J Krishnan et al. Light emission from InGaN quantum wells grown on the facets of closely spaced GaN nano-pyramids formed by nano-imprinting. Appl Phys Express, 2, 121002(2009).

    [88] W Bergbauer, M Strassburg, C Kölper et al. Continuous-flux movpe growth of position-controlled N-face GaN nanorods and embedded ingan quantum wells. Nanotechnology, 21, 305201(2010).

    [89] B Leung, Q Sun, C D Yerino et al. Using the kinetic wulff plot to design and control nonpolar and semipolar GaN heteroepitaxy. Semicond Sci Technol, 27, 024005(2012).

    [90] Y H Ko, J Song, B Leung et al. Multi-color broadband visible light source via GaN hexagonal annular structure. Sci Rep, 4, 5514(2014).

    [91] B Foltynski, N Garro, M Vallo et al. The controlled growth of GaN microrods on Si (111) substrates by MOCVD. J Cryst Growth, 414, 200(2015).

    [92] V Jindal, F Shahedipour-Sandvik. Theoretical prediction of GaN nanostructure equilibrium and nonequilibrium shapes. J Appl Phys, 106, 083115(2009).

    [93] M Mandl, X Wang, T Schimpke et al. Group III nitride core-shell nano- and microrods for optoelectronic applications. Phys Status Solidi RRL, 7, 800(2013).

    [94] M D Pashley. Electron counting model and its application to island structures on molecular-beam epitaxy grown GaAs (001) and ZnSe (001). Phys Rev B, 40, 10481(1989).

    [95] A Kusaba, Y Kangawa, P Kempisty et al. Thermodynamic analysis of (0001) and (000-1) GaN metalorganic vapor phase epitaxy. Jpn J Appl Phys, 56, 070304(2017).

    [96] T Akiyama, Y Seta, K Nakamura et al. Modified approach for calculating individual energies of polar and semipolar surfaces of group-III nitrides. Phys Rev Mater, 3, 023401(2019).

    [97] X Zhang, J Xin, F Ding. The edges of graphene. Nanoscale, 5, 2556(2019).

    [98] V I Artyukhov, Y Liu, B I Yakobson. Equilibrium at the edge and atomistic mechanisms of graphene growth. Proc Natl Acad Sci USA, 109, 15136(2012).

    [99] C K Gan, D J Srolovitz. First-principles study of graphene edge properties and flake shapes. Phys Rev B, 81, 125445(2010).

    [100] V I Artyukhov, Y Hao, R S Ruoff et al. Breaking of symmetry in graphene growth on metal substrates. Phys Rev Lett, 114, 115502(2015).

    [101] S Okada. Energetics of nanoscale graphene ribbons: Edge geometries and electronic structures. Phys Rev B, 77, 041408(2008).

    [102] K S Novoselov, A Mishchenko, A Carvalho et al. 2D materials and van der waals heterostructures. Science, 353, aac9439(2016).

    [103] Y Stehle, H M Meyer, R R Unocic et al. Synthesis of hexagonal boron nitride monolayer: Control of nucleation and crystal morphology. Chem Mater, 27, 8041(2015).

    [104] S Y Yang, G W Shim, S B Seo et al. Effective shape-controlled growth of monolayer MoS2 flakes by powderbased chemical vapor deposition. Nano Res, 10, 255(2017).

    [105] Y Chen, P Cui, X Ren et al. Fabrication of MoSe2 nanoribbons via an unusual morphological phase transition. Nat Commun, 8, 15135(2017).

    [106] J Li, Z Hu, Y Yi et al. Hexagonal boron nitride growth on Cu–Si alloy: Morphologies and large domains. Small, 15, 1805188(2019).

    [107] Y Liu, S Bhowmick, B I Yakobson. Bn white graphene with ”colorful” edges: The energies and morphology. Nano Lett, 11, 3113(2011).

    [108] E Machlin. Aspects of thermodynamics and kinetics relevant to materials science. Elsevier Science(2007).

    [109] K Tse, M Wong, Y Zhang et al. Defect properties of Na and K in Cu2ZnSnS4 from hybrid functional calculation. J Appl Phys, 124, 165701(2018).

    [110] J Gao, J Yip, J Zhao et al. Graphene nucleation on transition metal surface: Structure transformation and role of the metal step edge. J Am Chem Soc, 133, 5009(2011).

    [111] J Coraux, A T N’Diaye, M Engler et al. Growth of graphene on Ir (111). New J Phys, 11, 039801(2009).

    [112] X Song. Chemical vapor deposition growth of large-scale hexagonal boron nitride with controllable orientation. Nano Res, 8, 3164(2015).

    [113] B Huang, H Lee, B L Gu et al. Edge stability of boron nitride nanoribbons and its application in designing hybrid bnc structures. Nano Res, 5, 62(2012).

    [114] A Du, Y Chen, Z Zhu et al. Dots versus antidots: Computational exploration of structure, magnetism, and half metallicity in boron-nitride nanostructures. J Am Chem Soc, 131, 17354(2009).

    [115] der Zande A M Van, P Y Huang, D A Chenet et al. Grains and grain boundaries in highly crystalline monolayer molybdenum disulphide. Nat Mater, 12, 554(2013).

    [116] J V Lauritsena, M V Bollinger, E Lægsgaarda et al. Atomic-scale insight into structure and morphology changes of MoS2 nanoclusters in hydrotreating catalysts. J Catal, 221, 510(2004).

    [117] I Barin. Thermochemical data of pure substances. Wiley-VCH Verlag GmbH(2008).

    Chuen-Keung Sin, Jingzhao Zhang, Kinfai Tse, Junyi Zhu. A brief review of formation energies calculation of surfaces and edges in semiconductors[J]. Journal of Semiconductors, 2020, 41(6): 061101
    Download Citation