• Laser & Optoelectronics Progress
  • Vol. 59, Issue 6, 0617013 (2022)
Shunwu Xu1、2, Jiajia He2, Gangqin Xi2, Lianhuang Li2, Xiahui Han2, Liqin Zheng2、*, and Jianxin Chen2、**
Author Affiliations
  • 1School of Electronic and Mechanical Engineering, Fujian Polytechnic Normal University, Fuqing, Fujian 350300, China
  • 2Key Laboratory of Optoelectronic Science and Technology for Medicine of Ministry of Education, Fujian Provincial Key Laboratory for Photonics Technology, College of Photonic and Electronic Engineering, Fujian Normal University, Fuzhou , Fujian 350007, China
  • show less
    DOI: 10.3788/LOP202259.0617013 Cite this Article Set citation alerts
    Shunwu Xu, Jiajia He, Gangqin Xi, Lianhuang Li, Xiahui Han, Liqin Zheng, Jianxin Chen. Application Progress of Multiphoton Microscopy in Prognostic Prediction of Breast Tumor Microenvironments[J]. Laser & Optoelectronics Progress, 2022, 59(6): 0617013 Copy Citation Text show less
    Energy level diagrams of nonlinear optical effect. (a) Two-photon excitation; (b) second harmonic generation
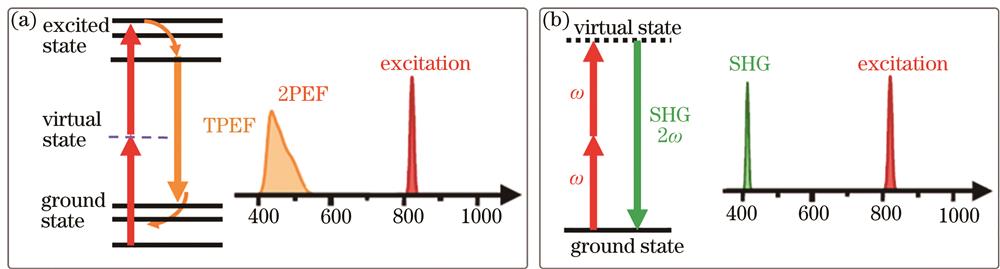
    Fig. 1. Energy level diagrams of nonlinear optical effect. (a) Two-photon excitation; (b) second harmonic generation
    Schematic diagram of breast tumor progression and tumor microenvironment changes. (a) Normal breast tissue and surrounding microenvironment; (b) breast tumor progression process; (c) surrounding microenvironment of invasive breast tumor
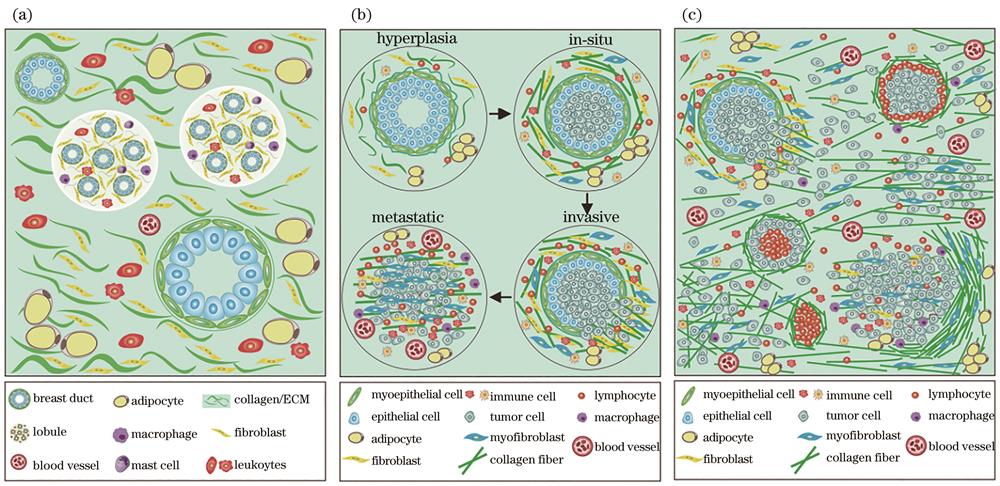
    Fig. 2. Schematic diagram of breast tumor progression and tumor microenvironment changes. (a) Normal breast tissue and surrounding microenvironment; (b) breast tumor progression process; (c) surrounding microenvironment of invasive breast tumor
    Multiphoton microscopy images of main components in tumor microenvironment
    Fig. 3. Multiphoton microscopy images of main components in tumor microenvironment
    Schematic diagrams of 8 relative spatial distribution patterns of tumor cells and extracellular matrix collagen fibers and corresponding MPM images, scale is 500 µm[20]. (a) Relative spatial distribution pattern; (b) MPM images
    Fig. 4. Schematic diagrams of 8 relative spatial distribution patterns of tumor cells and extracellular matrix collagen fibers and corresponding MPM images, scale is 500 µm[20]. (a) Relative spatial distribution pattern; (b) MPM images
    Schematic of extracting TACS corresponding microscopy features (TCMF)[30]. (a) Interception of a region of interest; (b) extraction of four types of TCMF
    Fig. 5. Schematic of extracting TACS corresponding microscopy features (TCMF)[30]. (a) Interception of a region of interest; (b) extraction of four types of TCMF
    Relative spatial distribution patterns of three important components of tumor microenvironment: tumor cells, lymphocytes and extracellular matrix collagen fibers and corresponding MPM images, scale is 500 µm[34]. (a) Relative spatial distribution pattern; (b) MPM images
    Fig. 6. Relative spatial distribution patterns of three important components of tumor microenvironment: tumor cells, lymphocytes and extracellular matrix collagen fibers and corresponding MPM images, scale is 500 µm[34]. (a) Relative spatial distribution pattern; (b) MPM images
    Shunwu Xu, Jiajia He, Gangqin Xi, Lianhuang Li, Xiahui Han, Liqin Zheng, Jianxin Chen. Application Progress of Multiphoton Microscopy in Prognostic Prediction of Breast Tumor Microenvironments[J]. Laser & Optoelectronics Progress, 2022, 59(6): 0617013
    Download Citation