Author Affiliations
1State Key Laboratory for Mesoscopic Physics and Department of Physics, Peking University, Beijing 100871, China2Research Institute for Electronic Science, Hokkaido University, Sapporo 001-0021, Japan3Department of Applied Chemistry, National Chiao Tung University, Hsinchu 30010, Taiwan4Collaborative Innovation Center of Quantum Matter, Beijing 100871, China5e-mail: misawa@es.hokudai.ac.jp6e-mail: qhgong@pku.edu.cnshow less
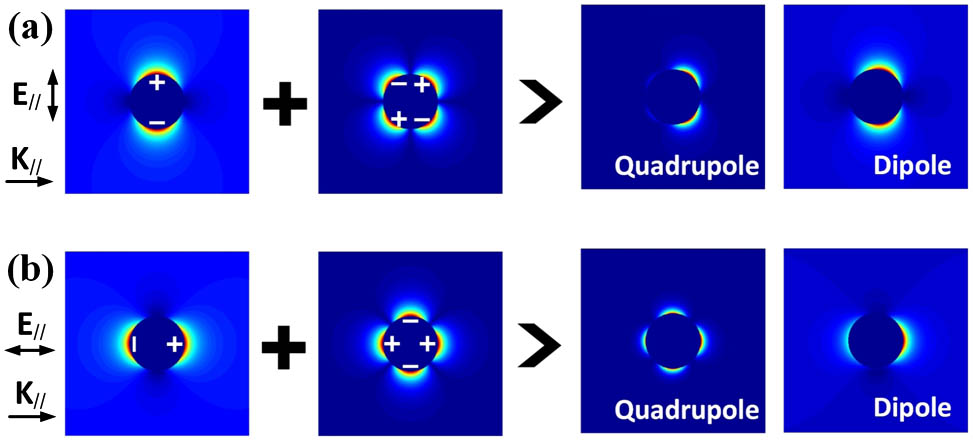
Fig. 1. Superposition manners of the dipole and quadrupole modes. (a) The dipole mode couples with the odd symmetric quadrupole mode. (b) The dipole mode couples with the even symmetric quadrupole mode. The “dipole” in the pictures indicates that the dipole mode is dominant. The “quadrupole” in the pictures indicates that the quadrupole mode is dominant. For simple calculations, all distributions are calculated at the plane of y=0. E// and K// denote the component of the polarization and wave vector parallel to the graph, respectively.
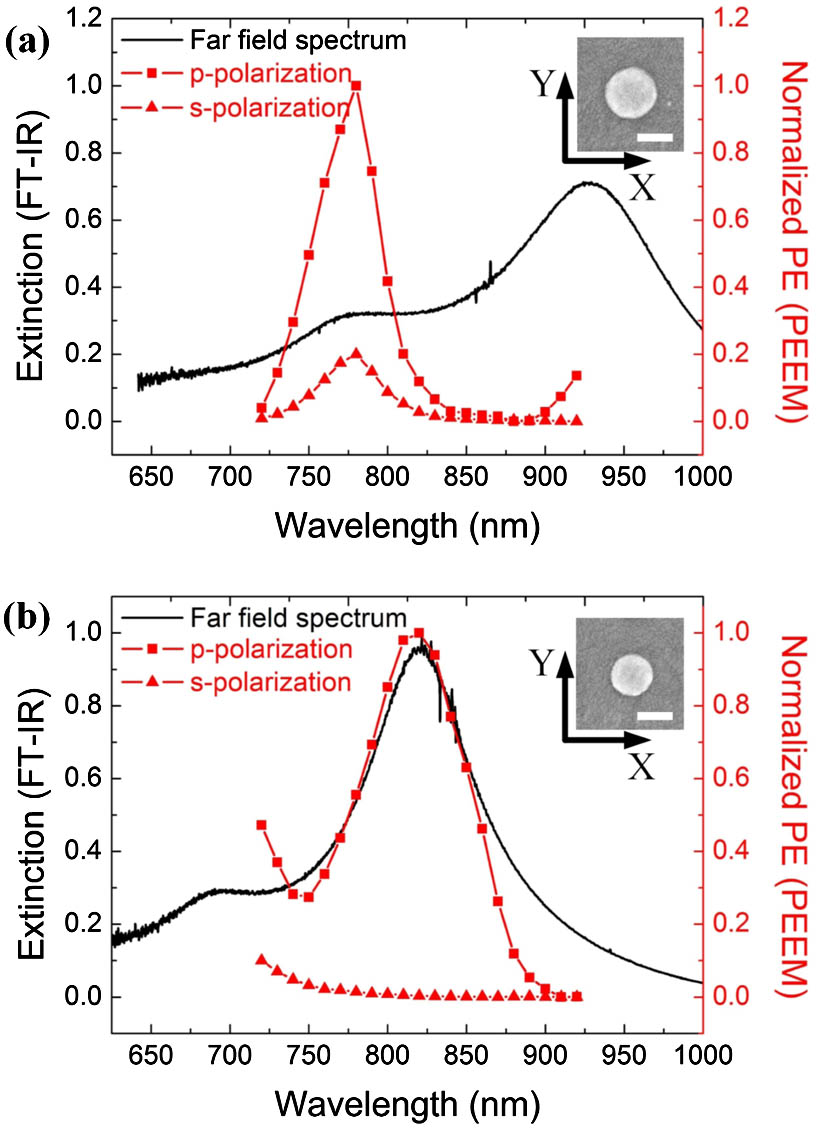
Fig. 2. Far-field and near-field intensity spectra of the nanodisk samples with diameters of (a) 280 and (b) 220 nm. Black lines are the far-field spectra measured by FT-IR; the two red lines are the near-field intensity spectra measured by PEEM at oblique incidence with s-polarization and p-polarization. The curves with s-polarization are normalized to that with p-polarization. Insets are SEM images; the scale bar is 200 nm.
Fig. 3. PEEM images with different light sources. (a) Topography of 280 nm nanodisks imaged with UV light. (b) Field distributions of 280 nm nanodisks exited at the dipole LSPR wavelength (920 nm) with horizontal polarized (H−p) laser. (c) Field distributions of 280 nm nanodisks excited at the quadrupole LSPR wavelength (780 nm) with different polarizations. Left: s-polarization (s-p). Right: p-polarization (p−p). (d) Field distributions of 220 nm nanodisks excited at the dipole LSPR wavelength (820 nm) with different polarizations. Left: s-polarization (s−p). Right: p-polarization (p−p). Dash circles outline the geometry of the Au nanodisks. All the intensity contrasts in PEEM images have been adjusted to clearly show the distributions.
Fig. 4. Field distributions simulated by FDTD and measured by PEEM. (a–c, g–i) Field distributions with s-polarization. (d–f, j–l) Field distributions with p-polarization. In (a–f), the diameter of the nanodisk is 280 nm; in (g–l), the diameter of the nanodisk is 220 nm. (a, d, g, j) Field distributions on the upper plane of the structures simulated by FDTD. (b, e, h, k) Field distributions on the lower plane of the structures simulated by FDTD. (c, f, i, l) Field distributions measured by PEEM. “Quadrupole” indicates that the distributions are excited with the excitation wavelength near the quadrupole resonance wavelength. “Dipole” indicates that the distributions are excited with the excitation wavelength near the dipole resonance wavelength. All the intensity contrasts in PEEM and simulated images have been adjusted to clearly show the distributions.
Fig. 5. Spectra of the nanoblock samples with side lengths of (a) 230 and (b) 200 nm. Black lines are the far-field spectra measured by FT-IR; the two red lines are the near-field intensity spectra measured by PEEM at oblique incidence with s-polarization and p-polarization. The two curves are normalized to the curve with s-polarization. (c) and (d) Field distributions under different wavelengths. First row: Field distributions on the upper plane of the structures simulated by FDTD. Second row: Field distributions on the lower plane of the structures simulated by FDTD. Third row: Field distributions measured by PEEM. “Quadrupole” indicates that the distributions are excited with the laser near the quadrupole resonance wavelength. “Dipole” indicates that the distributions are excited with the laser near the dipole resonance wavelength. Insets are SEM images; the scale bar is 200 nm. All the intensity contrasts in PEEM and simulated images have been adjusted to show the distributions clearly.
Fig. 6. Diagram of electron emission and electric field distribution. (a) Possible channels in which electrons are ejected. (b) Simulated cross section of the electric field distribution of the 230 nm nanoblock excited by p-polarized laser with the excitation wavelength at 840 nm.