• Laser & Optoelectronics Progress
  • Vol. 57, Issue 20, 201701 (2020)
Zhenzhen Wan1、*, Chunxue Li1, Fang Liu2、3, Shaoyong Zhang1, and Shuai Han1
Author Affiliations
  • 1College of Electronic Information Engineering, Hebei University, Baoding, Hebei 0 71002, China
  • 2Department of Pathology, Baoding Children's Hospital, Baoding, Hebei 0 71000, China
  • 3Key Laboratory of Clinical Research on Children's Respiratory Digestive Diseases in Baoding City, Baoding, Hebei 0 71000, China
  • show less
    DOI: 10.3788/LOP57.201701 Cite this Article Set citation alerts
    Zhenzhen Wan, Chunxue Li, Fang Liu, Shaoyong Zhang, Shuai Han. Computer-Aided Diagnosis of Pathological Section for Eosinophilic Gastroenteritis[J]. Laser & Optoelectronics Progress, 2020, 57(20): 201701 Copy Citation Text show less
    Pathological section drawing
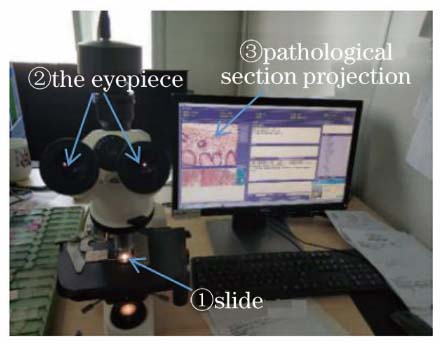
    Fig. 1. Pathological section drawing
    Cell classification diagram
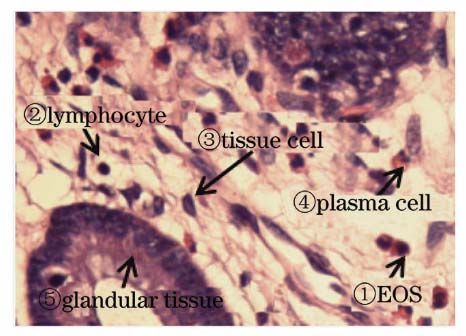
    Fig. 2. Cell classification diagram
    YCbCr and filtering effect diagrams. (a) Original diagram; (b) YCbCr diagram; (c) gradient amplitude filtering
    Fig. 3. YCbCr and filtering effect diagrams. (a) Original diagram; (b) YCbCr diagram; (c) gradient amplitude filtering
    Eosinophil characteristics
    Fig. 4. Eosinophil characteristics
    Mathematical morphology diagrams. (a) Binarization; (b) reconstruction of open and closed operation; (c) filling of holes
    Fig. 5. Mathematical morphology diagrams. (a) Binarization; (b) reconstruction of open and closed operation; (c) filling of holes
    Results after foreground marking. (a) Result after extracting local maximum; (b) result after extracting local maximum after improvement; (c) distance transformation
    Fig. 6. Results after foreground marking. (a) Result after extracting local maximum; (b) result after extracting local maximum after improvement; (c) distance transformation
    Results of improved watershed algorithm. (a) Watershed ridge line; (b) image by overlaying original image on object edge; (c) marker matrix overlay original image
    Fig. 7. Results of improved watershed algorithm. (a) Watershed ridge line; (b) image by overlaying original image on object edge; (c) marker matrix overlay original image
    Segmentation of improved and traditional watershed algorithms
    Fig. 8. Segmentation of improved and traditional watershed algorithms
    Frequency distribution histogram of EOS counts
    Fig. 9. Frequency distribution histogram of EOS counts
    Accuracy frequency of improved and traditional watershed algorithms
    Fig. 10. Accuracy frequency of improved and traditional watershed algorithms
    Over-segmentation rate of improved and traditional watershed algorithms
    Fig. 11. Over-segmentation rate of improved and traditional watershed algorithms
    CellimageEOS numberfrom doctorsTraditional algorithmImproved algorithm
    EOSnumberAccuracyrate /%Over dividedrate /%EOSnumberAccuracyrate /%Over dividedrate/%
    1364283.37.73797.21.4
    2162080.011.11794.13.0
    3293772.412.13096.61.7
    4334175.810.83594.02.9
    5495979.69.35293.93.0
    6283767.913.83093.03.4
    7566583.97.45896.41.8
    8131769.213.31492.93.7
    Table 1. Experimental data of improved and traditional watershed algorithms
    Zhenzhen Wan, Chunxue Li, Fang Liu, Shaoyong Zhang, Shuai Han. Computer-Aided Diagnosis of Pathological Section for Eosinophilic Gastroenteritis[J]. Laser & Optoelectronics Progress, 2020, 57(20): 201701
    Download Citation