
Xiaohan Li, Lu Chen, Xiang Zhou. Segmentation in multi-objects scene based on disparity and fringe modulation analysis[J]. Infrared and Laser Engineering, 2020, 49(6): 20200085
- Infrared and Laser Engineering
- Vol. 49, Issue 6, 20200085 (2020)
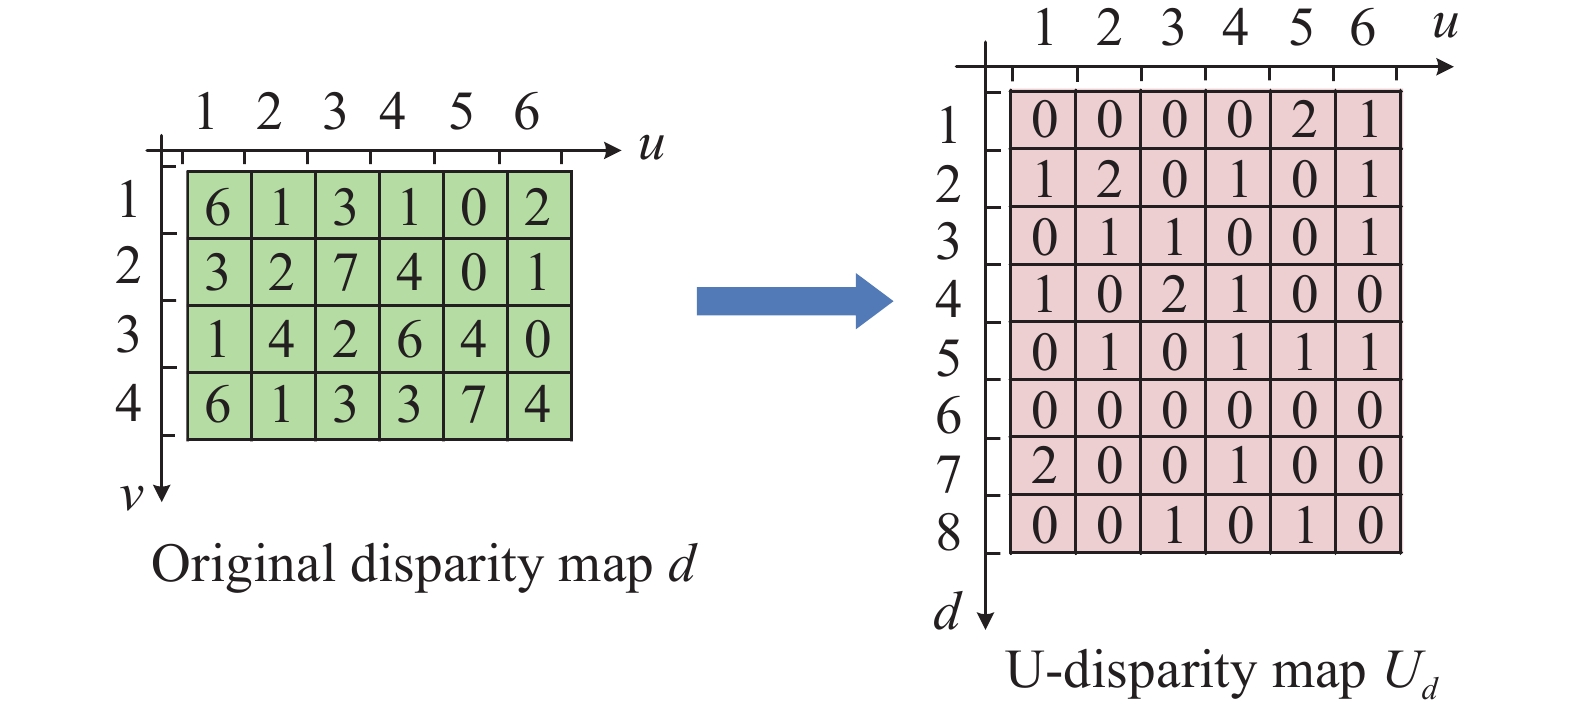
Fig. 1. Transformations from the disparity map to U-disparity map
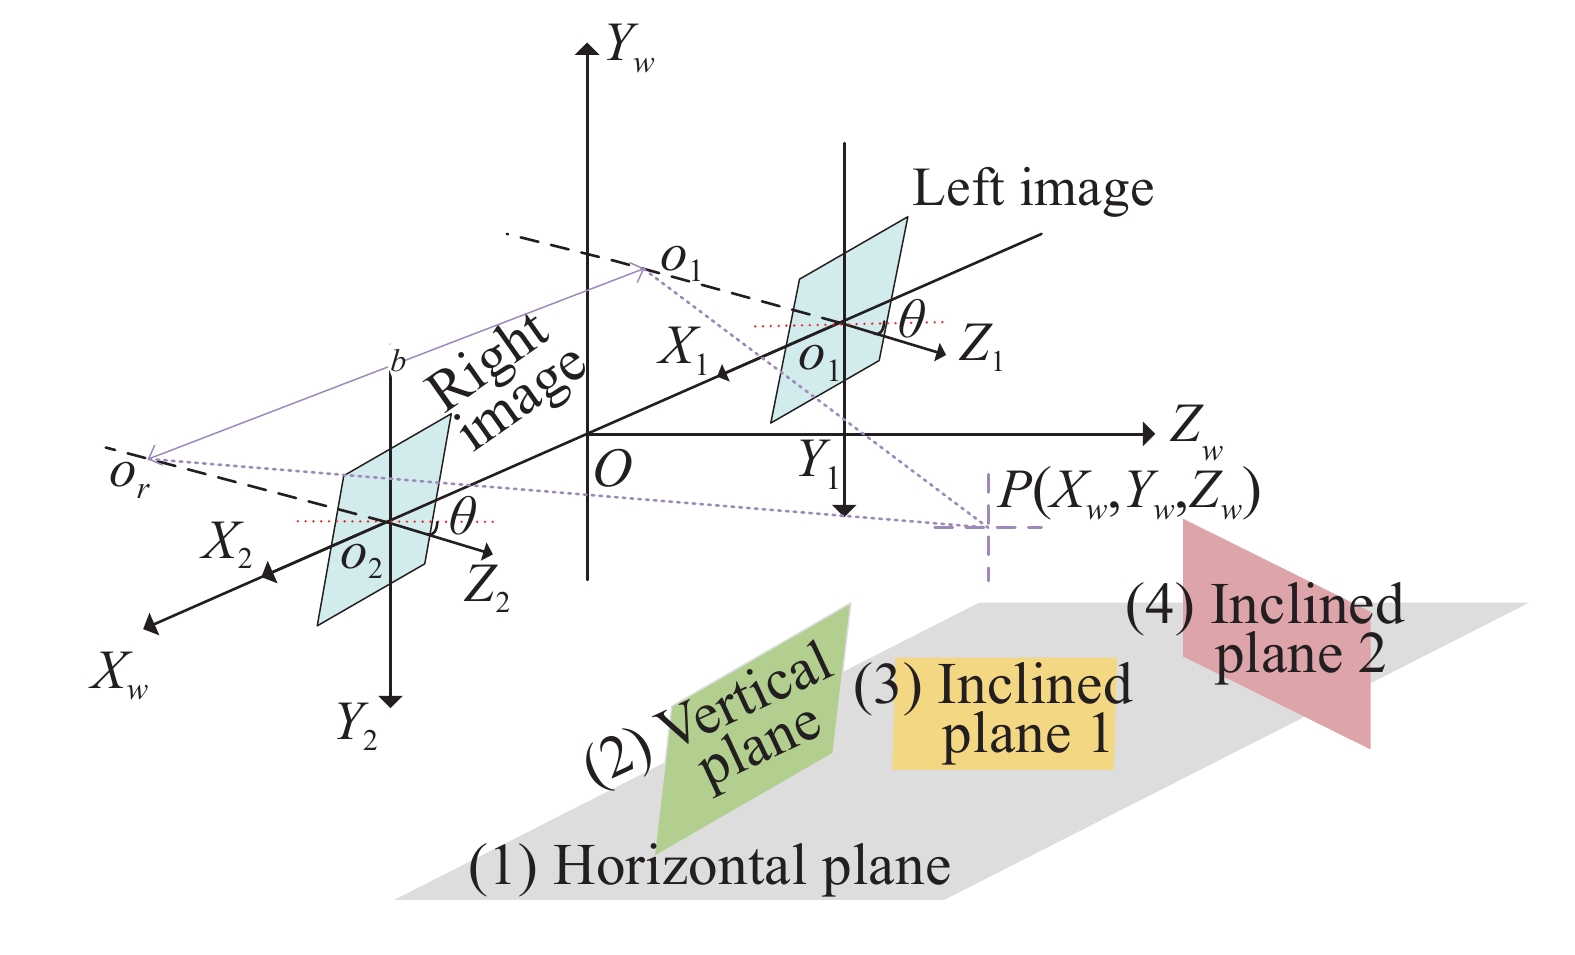
Fig. 2. Several planes in the world coordinate system
Fig. 3. Flowchart of the proposed algorithm
Fig. 4. (a) Gray image of the plaster model; (b) pseudo color disparity map; (c) projection result on the U-disparity map; (d) binary image of (c)
Fig. 5. (a)Binary U-disparity map; (b)noise with large disparity range labeled with red oblique lines
Fig. 6. Scene segmentation results of group 1. (a) Gray image; (b) 3D reconstruction result; (c) labeled regions of segmentation results in the disparity map; (d),(e) preliminary segmentation result; (f) final segmentation result
Fig. 7. Scene segmentation results of group 2. (a) Gray image; (b) 3D reconstruction result;(c) labeled regions of segmentation results in the disparity map; (d)-(f) preliminary segmentation results of the background board and the two models; (g),(h) final segmentation results of the two models
Fig. 8. Scene segmentation results of group 3. (a) Gray image; (b) labeled regions of segmentation results in the disparity map; (c) segmentation region of (e) in the corresponding phase image; (d) segmentation region in the corresponding disparity image of (c); (e)-(g) preliminary segmentation result; (h)-(j) final segmentation result
Fig. 9. Disparity sequence obtained by Realsense D415 depth camera by the proposed method. (a) RGB image; (b) disparity map; (c) labeled regions of segmentation results in the rendered disparity map
| ||||||||||||||||||||||||||||||||||||||||||||||||||||
Table 1. Comparison of evaluation data of Fig.6 -8

Set citation alerts for the article
Please enter your email address
© Copyright 2018-2021 | Chinese Laser Press. All Rights Reserved 沪ICP备15018463号-20