
Yu Ji, Chang-Wang Lian, Rui Yan, Chuang Ren, Dong Yang, Zhen-Hua Wan, Bin Zhao, Chen Wang, Zhi-Heng Fang, Jian Zheng. Convective amplification of stimulated Raman rescattering in a picosecond laser plasma interaction regime[J]. Matter and Radiation at Extremes, 2021, 6(1): 015901
- Matter and Radiation at Extremes
- Vol. 6, Issue 1, 015901 (2021)
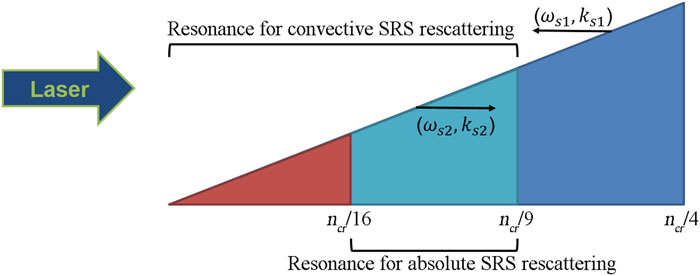
Fig. 1. Schematic of the resonant regions for absolute and convective modes of Re-BSRS instabilities in an inhomogeneous plasma.
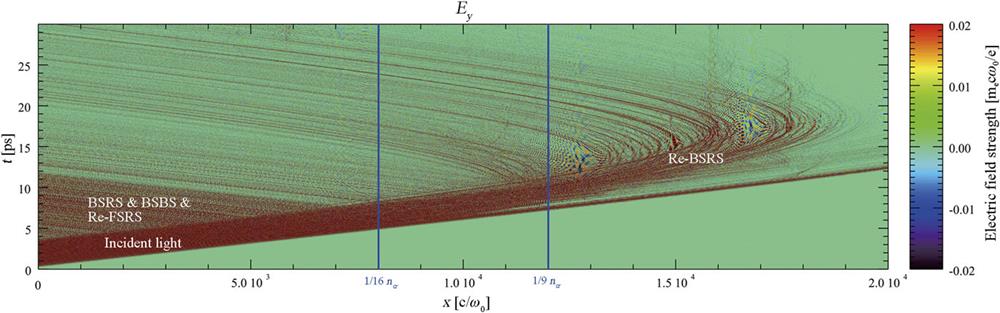
Fig. 2. Evolution of the E y field (contributed only by the laser’s electric field in 1D simulations) of simulation case (i) in x –t space.
Fig. 3. Time-resolved E y 2
Fig. 4. Snapshots of the in-flight E y 2 t = 6.0 ps, (b) t = 8.5 ps, and (c) t = 14.0 ps. Different types of LPI signals are indicated. The dashed lines in (c) are the turning points of the rescattered light with a range of frequencies.
Fig. 5. Time-integrated reflection fraction (a) due to backward-traveling light in different frequency ranges and (b) due to different types of LPI.
Fig. 6. [(a)–(d)] Comparison of the backward-propagating light spectra within the frequency range of [0.6, 0.95]ω 0 in cases (i) [(a) and (c)] and (ii) [(b) and (d)]. (e) Comparison of the convective amplification of a forward-propagating Re-BSRS light component with ω s 2 = 0.47ω 0 in cases (i) and (ii). The star symbols in (a)–(d) represent the most resonant light component that can serve as a pump for the Re-BSRS mode ω s 2 = 0.47ω 0 at the given moment. The circles and triangles in (e) represent the peak values vs the peak’s positions on the E y 2 E y 2
Fig. 7. Correlation of hot electrons with Re-BSRS. (a) Temporal and spatial evolution of Re-BSRS light within the frequency range 0.35ω 0 < ω s 2 < 0.5ω 0. (b) Temporal and spatial evolution of the distribution of the backward-moving hot electrons with kinetic energies >50 keV. The presence of a bunch of hot electrons near the left boundary after t ≈ 18 ps is probably due to the boundary conditions in the long-time simulation and is expected to be artificial.
Fig. 8. 2D simulation results for case (vi). (a) Time evolution of E y 2 k x space in a spatial domain near n e = n cr/9. (b) Evolution of E y 2 ω s 2 = 0.4ω 0. The circles represent the peak value vs the peak’s position on the envelope at different times, while three snapshots of the envelopes at three different times are shown by dashed lines.
Fig. 9. Spectra in k y –k x space of (a) B z representing incident and scattered light and (b) electron number density representing plasma waves in the region with a background density range of [0.06n cr, 0.11n cr] at t = 4.1 ps in case (vi).
|
Table 1. Simulation parameters.


Set citation alerts for the article
Please enter your email address

© Copyright 2018-2021 | Chinese Laser Press. All Rights Reserved 沪ICP备15018463号-20