• Journal of Semiconductors
  • Vol. 41, Issue 6, 062701 (2020)
Peng Wang1、2, Gaofei Li3, Miao Wang3, Hong Li3, Jing Zheng3, Liyou Yang3, Yigang Chen1, Dongdong Li2, and Linfeng Lu2
Author Affiliations
  • 1School of Materials Science and Engineering, Shanghai University, Shanghai 200444, China
  • 2CAS Key Lab of Low-Carbon Conversion Science and Engineering, Shanghai Advanced Research Institute, Chinese Academy of Sciences, Shanghai 201210, China
  • 3Jinneng Clean Energy Limited Company, Lvliang 032100, China
  • show less
    DOI: 10.1088/1674-4926/41/6/062701 Cite this Article
    Peng Wang, Gaofei Li, Miao Wang, Hong Li, Jing Zheng, Liyou Yang, Yigang Chen, Dongdong Li, Linfeng Lu. Numerical study of mono-crystalline silicon solar cells with passivated emitter and rear contact configuration for the efficiency beyond 24% based on mass production technology[J]. Journal of Semiconductors, 2020, 41(6): 062701 Copy Citation Text show less
    (Color online) (a) A digital camera image of a PERC solar cell with five busbars from our product line. (b) Schematic illustration of the basic PERC solar cell structure in the simulation.
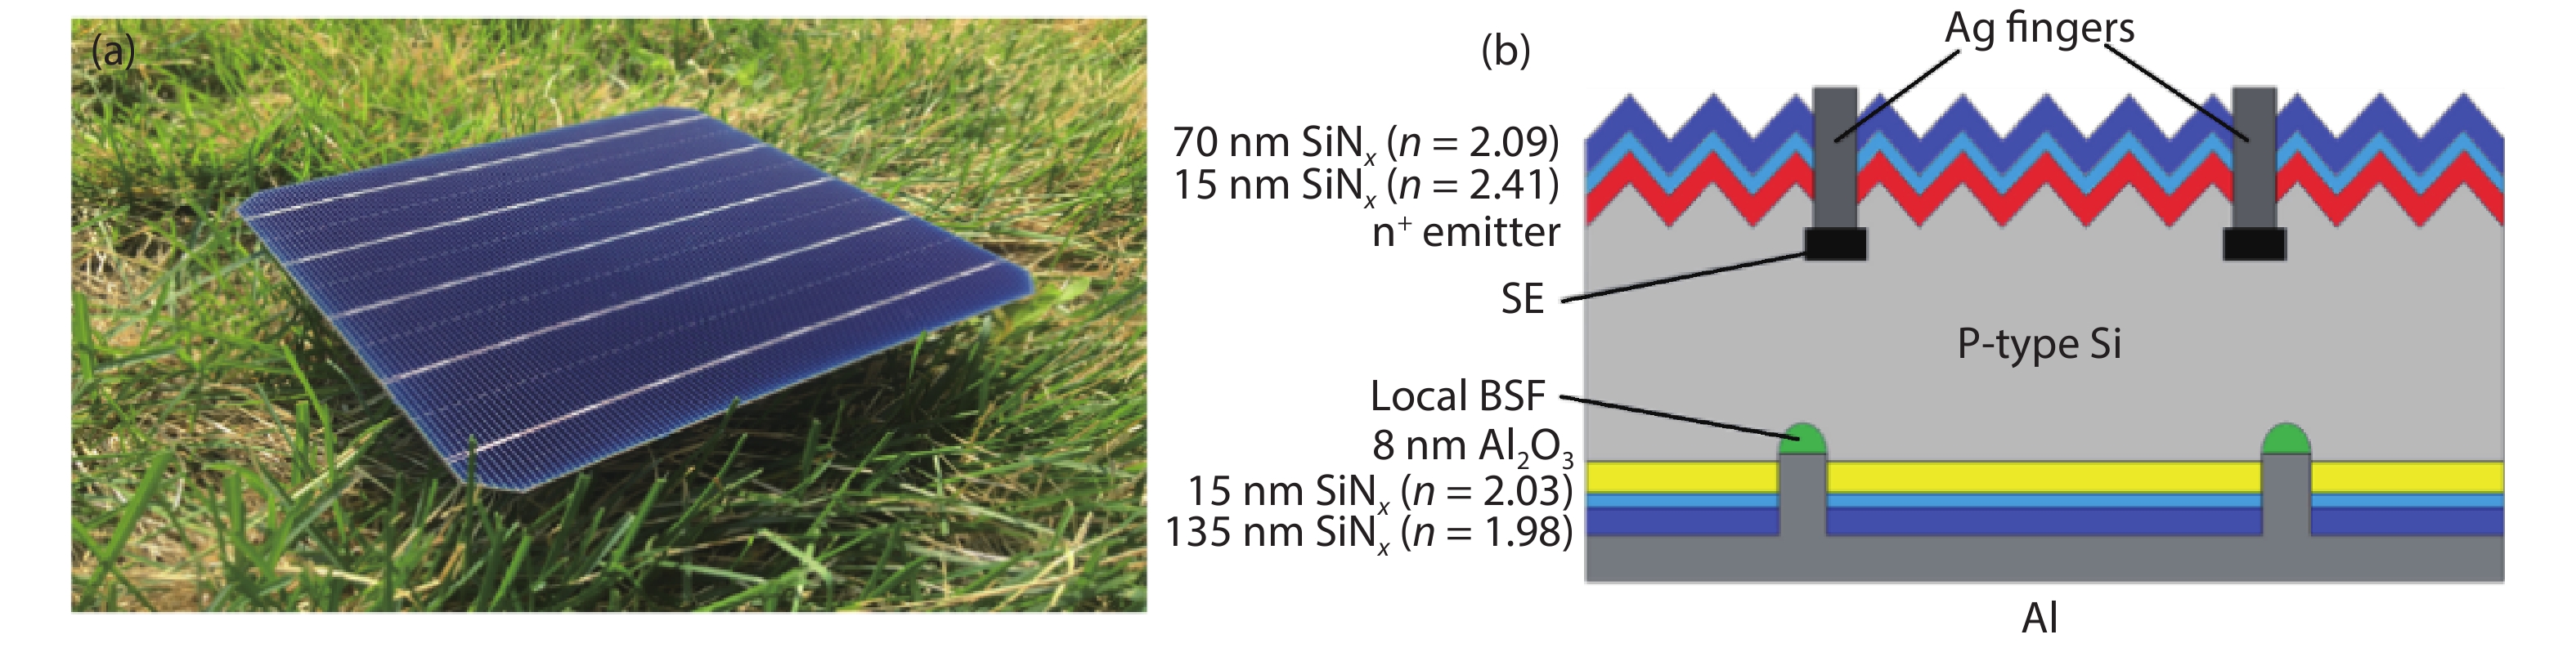
    Fig. 1. (Color online) (a) A digital camera image of a PERC solar cell with five busbars from our product line. (b) Schematic illustration of the basic PERC solar cell structure in the simulation.
    The J–V curve of PERC reference cell and the electrical properties comparison between simulated and practical mass-produced PERC cell.
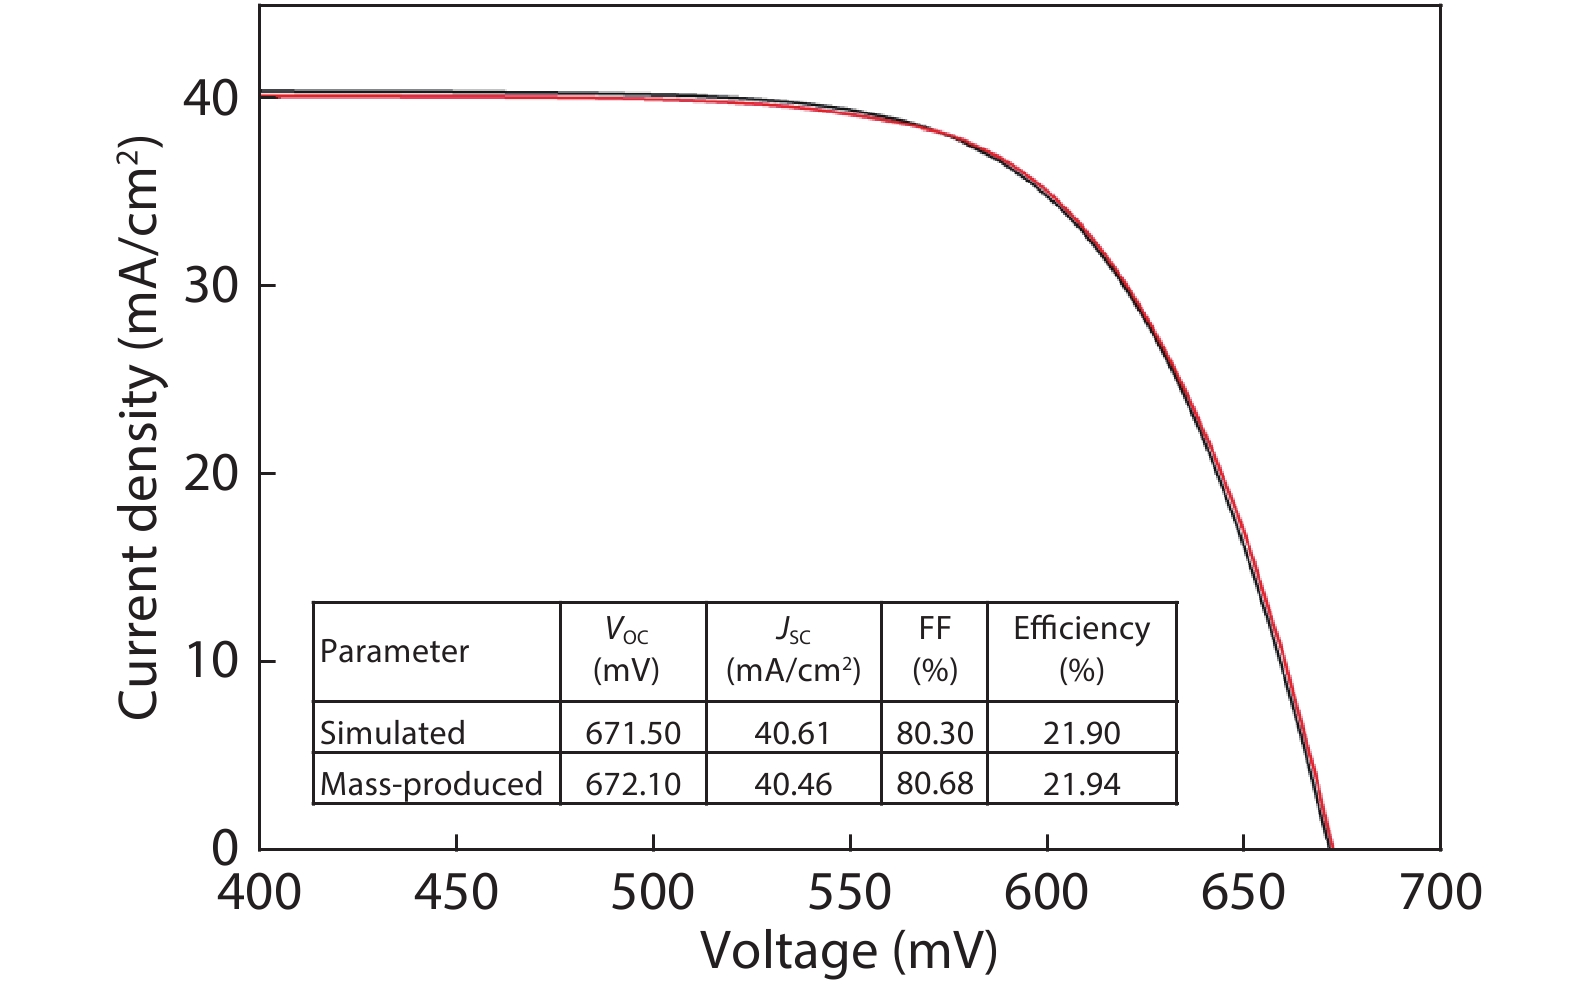
    Fig. 2. The J–V curve of PERC reference cell and the electrical properties comparison between simulated and practical mass-produced PERC cell.
    (Color online) The relationship between the saturation current density J0E and sheet resistance of SiOxNy/SiNx[26], SiO2/SiNx[25], SiO2/Al2O3/SiNx[25] and Al2O3/SiNx[25] passivation layers on n+ emitter of PERC solar cell.
    Fig. 3. (Color online) The relationship between the saturation current density J0E and sheet resistance of SiOxNy/SiNx[26], SiO2/SiNx[25], SiO2/Al2O3/SiNx[25] and Al2O3/SiNx[25] passivation layers on n+ emitter of PERC solar cell.
    (Color online) Comparison of (a) simulated efficiency and VOC, (b) simulated JSC and FF of PERC solar cells using different n+ emitter passivation stacked layers.
    Fig. 4. (Color online) Comparison of (a) simulated efficiency and VOC, (b) simulated JSC and FF of PERC solar cells using different n+ emitter passivation stacked layers.
    (Color online) Relationship between resistivity and carrier lifetime of silicon wafer under intrinsic limit condition and different BO deactivated processing conditions[29–31].
    Fig. 5. (Color online) Relationship between resistivity and carrier lifetime of silicon wafer under intrinsic limit condition and different BO deactivated processing conditions[2931].
    (Color online) The electrical performance of PERC solar cells varies with the resistivity of silicon wafers under intrinsic limit and different BO deactivated processing conditions[29–31].
    Fig. 6. (Color online) The electrical performance of PERC solar cells varies with the resistivity of silicon wafers under intrinsic limit and different BO deactivated processing conditions[2931].
    (Color online) Simulated solar cell of a possible scenario for further PERC cell improvements. In step (1), the star, triangle, circle and rhombus points represent cells with SiO2/SiNx, SiO2/Al2O3/SiNx, SiOxNy/SiNx and Al2O3/SiNx, respectively. In step (2), the star, rhombus and circle points represent carrier lifetimes of 6200, 2500, and 430 μs, respectively. In step (3), the hollow star represents the cell with 12 BB and the solid star represents the cell using 12 BB together with Ni/Cu electrode.
    Fig. 7. (Color online) Simulated solar cell of a possible scenario for further PERC cell improvements. In step (1), the star, triangle, circle and rhombus points represent cells with SiO2/SiNx, SiO2/Al2O3/SiNx, SiOxNy/SiNx and Al2O3/SiNx, respectively. In step (2), the star, rhombus and circle points represent carrier lifetimes of 6200, 2500, and 430 μs, respectively. In step (3), the hollow star represents the cell with 12 BB and the solid star represents the cell using 12 BB together with Ni/Cu electrode.
    (Color online) Sources of the efficiency loss between the simulated PERC solar cell with 24.04% to the limit efficiency of 29%.
    Fig. 8. (Color online) Sources of the efficiency loss between the simulated PERC solar cell with 24.04% to the limit efficiency of 29%.
    RegionParameterValue
    OpticsUpright pyramids52°, 4 μm height
    Incident illuminationAM1.5g (1000 W/m2)
    Front passivation layers15 nm SiNx (n = 2.41)/70 nm SiNx (n = 2.09)
    n+ emitter Sheet resistance120 Ω/□
    Junction depth[20]0.36 μm
    Non-contacted region J0E[20]80 fA/cm2
    Contacted region J0E[20]500 fA/cm2
    Contact resistivity[21]2 mΩ·cm2
    Selective emitterSheet resistance[21]70 Ω/□
    Junction depth[21]0.5 μm
    Non-contacted region J0E[20]100 fA/cm2
    Contacted region J0E[20]500 fA/cm2
    Contact resistivity[21]2 mΩ·cm2
    BulkCell thickness180 μm
    Resistivity1 Ω·cm
    Background lifetime[21]512 μs
    BSFSheet resistance[22]30 Ω/□
    Junction depth5 μm
    Non-contacted region J0E[22]13.1 fA/cm2
    Contacted region J0E[22]795 fA/cm2
    Contact resistivity[21]5 mΩ·cm2
    Table 1. Simulation parameters of PERC reference cell.
    MetalResistivity (µΩ·cm) Contact resistivity (mΩ·cm2)
    Ag32
    Al355
    Ni/Cu1.60.1
    Table 2. Comparison of resistivity and contact resistivity of different metal electrode[21].
    Peng Wang, Gaofei Li, Miao Wang, Hong Li, Jing Zheng, Liyou Yang, Yigang Chen, Dongdong Li, Linfeng Lu. Numerical study of mono-crystalline silicon solar cells with passivated emitter and rear contact configuration for the efficiency beyond 24% based on mass production technology[J]. Journal of Semiconductors, 2020, 41(6): 062701
    Download Citation