
Silu Zhang, Liwei Liu, Sheng Ren, Zilin Li, Yihua Zhao, Zhigang Yang, Rui Hu, Junle Qu. Recent advances in nonlinear optics for bio-imaging applications[J]. Opto-Electronic Advances, 2020, 3(10): 200003-1
- Opto-Electronic Advances
- Vol. 3, Issue 10, 200003-1 (2020)
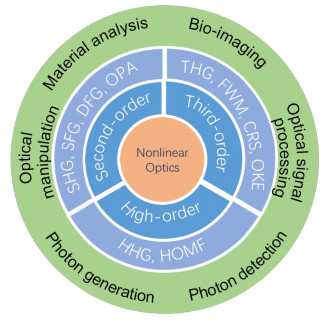
Fig. 1. Typical examples of nonlinear optics processes and applications. SHG: second-harmonic generation, SFG: sum-frequency generation, DFG: difference-frequency generation, OPA: optical parametric amplification, THG: third-harmonic generation, FWM: four-wave mixing, CRS: coherent Raman scattering, OKE: optical Kerr effect, HHG: high-harmonic generation, HOMF: high-order multiphoton fluorescence.
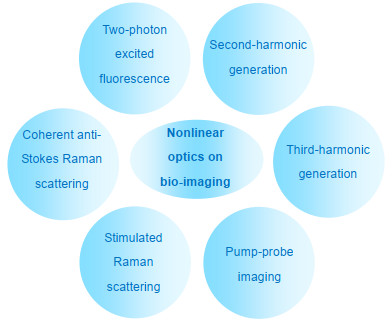
Fig. 2. Main nonlinear optical modalities applied to bioimaging.
Fig. 3. Energy diagrams of nonlinear optical processes employed for the bio-imaging.
TPEF : two-photon excited fluorescence. In this process, the material is excited by two photons with frequency of ω 1 and emits a photon (ω TPEF) with higher energy than each incident photon. SHG : second-harmonic generation. In this process, two photons with frequency of ω 1 are converted to one photon (ω SHG) with energy doubled of the incident photon.
THG : third-harmonic generation. In this process, three photons are converted to one photon (ω THG) with energy triple of the incident photon. CARS: coherent anti-Stokes Raman scattering. In this process, pump beam with frequency of ω p and Stokes beam with frequency of ω s interact with the material and generate a signal at anti-Stokes frequency ω as=2ω p-ω s. The signal can be enhanced when Ω =ω p-ω s is close to the frequency of a vibrational energy state of a chemical bond in the sample. SRS : stimulated Raman scattering. In this process, when the frequency difference of pump beam and stokes beam Ω , matches the vibrational resonance, a small part of the input energy transfers from one beam to the other. Pump-probe: in this process, a transient absorption is induced by the pump beam (ω p) and change the excited state of the material first. Then such change is detected by a probe beam (ω pr), and the dynamics of excited state can be deduced through varying the delay time between probe and pump beam pulses. The solid lines are the electronic and vibrational states, and the dashed lines are the virtual states.
Fig. 4. Two-photon excited fluorescence imaging of vasculature and neuron in vivo.
(a ) Three-dimensional imaging of layer V pyramidal neurons labeled with yellow fluorescent protein (left) and vasculature labeled with Texas Red (right), and excited by a fiber laser. (b ) Selected z-sections of the merged stacks in (a). (c ) Three-dimensional imaging of vasculature labeled with Texas Red, and excited with an optical parametric amplifier. (d ) z-sections of the stacks in (c). (e ) Vectorized vasculature in (c). The scale bar is 50 μm. Figure reproduced from: ref.43, Elsevier.
Fig. 5. Second harmonic generation imaging of the collagen tissues.
(a ) Self-assembled collagen gel. (b ) Mouse dermis, (c ) mouse bone. (d ) Human ovary. Figure reproduced from: ref.83, Springer Nature.
Fig. 6. Third harmonic generation microscopic imaging of the tissues in vivo.
(a ) Third harmonic generation. (b ) Second harmonic generation imaging of mouse ear in vivo. (c ) Third harmonic generation and second harmonic generation. (d ) Third harmonic generation imaging of the mouse ear after the injection of FeOOH nanoparticles. Size of view fields: (a, b) 240 µm × 240 µm, (c, d) 80 µm × 80 µm. Figure reproduced from: ref.153, Wiley-VCH.
Fig. 7. Coherent anti-Stokes Raman scattering imaging of tissues with CH2 contrast. Image of (a ) white adipose tissue in mouse omentum majus, (b ) mouse lung tissue with alveoli, (c ) adipocyte covered mouse kidney surface, (d ) mouse kidney with renal tubules, (e ) bovine retina cross section, and (f) human retina at the retinal surface. Figure reproduced from ref.172, Annual Reviews.
Fig. 8. Stimulated Raman scattering imaging of biological samples.
(a ) Image of chemical mapping of C. elegans intracellular compartments, LROs: lysosome-related organelles, the scale bar is 50 mm. (b ) Live HeLa cells, left: signals from C-D (2133 cm-1) showing deuterium-labeled amino acids, right: signals from C-H (2845 cm-1), the scale bars is 10 μm. (c ) Phenyl-diyne cholesterol in C. elegans, left: signal from C≡C (2247 cm-1) showing distinct cholesterol store, right: signal from C-H rich fat store (2885 cm-1), the scale bars is 10 mm. (d ) Left: time-lapse of HeLa cell division, DNA (magenta), lipids (green); right: section of normal human skin tissue, DNA (magenta), lipids (green), the scale bar is 20 mm. (e ) Drug tablets, green: microcrystalline cellulose, blue: dibasic calcium phosphate anhydrous, red: the drug amlodipine besylate, yellow/orange: sodium starch glycolate, magenta: magnesium stearate, the scale bars is 200 mm. Figure reproduced from ref.203, American Association for the Advancement of Science.
Fig. 9. Transient absorption imaging of heme granule dynamics in C. elegans.
(a ) Image of C. elegans at time zero, arrow: heme granule, blue line: worm intestinal membrane outline, the scale bar is 40 μm. (b ) Enlarged view of heme granule in the white box of (a) at different time points. Figure reproduced from: ref.239, American Society of Chemistry.


Set citation alerts for the article
Please enter your email address

© Copyright 2018-2021 | Chinese Laser Press. All Rights Reserved 沪ICP备15018463号-20