• Opto-Electronic Advances
  • Vol. 3, Issue 10, 200003-1 (2020)
Silu Zhang, Liwei Liu*, Sheng Ren, Zilin Li, Yihua Zhao, Zhigang Yang, Rui Hu, and Junle Qu
Author Affiliations
  • Key Laboratory of Optoelectronic Devices and Systems of Guangdong Province and Ministry of Education, College of Physics and Optoelectronic Engineering, Shenzhen University, Shenzhen 518000, China
  • show less
    DOI: 10.29026/oea.2020.200003 Cite this Article
    Silu Zhang, Liwei Liu, Sheng Ren, Zilin Li, Yihua Zhao, Zhigang Yang, Rui Hu, Junle Qu. Recent advances in nonlinear optics for bio-imaging applications[J]. Opto-Electronic Advances, 2020, 3(10): 200003-1 Copy Citation Text show less

    Abstract

    Nonlinear optics, which is a subject for studying the interaction between intense light and materials, has great impact on various research fields. Since many structures in biological tissues exhibit strong nonlinear optical effects, nonlinear optics has been widely applied in biomedical studies. Especially in the aspect of bio-imaging, nonlinear optical techniques can provide rapid, label-free and chemically specific imaging of biological samples, which enable the investigation of biological processes and analysis of samples beyond other microscopy techniques. In this review, we focus on the introduction of nonlinear optical processes and their applications in bio-imaging as well as the recent advances in this filed. Our perspective of this field is also presented.

    Introduction

    Nonlinear optics usually describes elastic and inelastic light scattering phenomena from interactions between light and materials. Many materials exhibit intrinsic nonlinear optical properties. These nonlinear optical materials are widely used in photon generation, manipulation, transmission, detection, and imaging1-7. Some endogenous structures in biological samples also have capabilities to produce intrinsic nonlinear optical signals. Besides, materials which show strong nonlinear optical effects can serve as exogenous label of biological samples. Thus, nonlinear optics has been extensively explored for developing new research tools for biology, and are, in most cases, combined with microscopy, which further extends their applications in bio-imaging. Many nonlinear optical processes, such as multiphoton fluorescence, harmonic generation, four-wave mixing, stimulated Raman resonance and pump-probes have been implemented for the imaging of various biological samples. Nonlinear optical microscopy can provide label-free imaging, three-dimensional optical sectioning, and deep observation in tissues and can also reduce the photo damage to biological samples. In addition, nonlinear optics can provide chemical specific and high-speed imaging strategies, which enable the biomedical dynamic process studies. Firstly, we introduce the basic principles of the nonlinear optical processes. Next, we overview the conventional nonlinear optical materials and structures. Then we highlight several nonlinear optical processes which are extensively investigated for recent advances in bio-imaging applications. Lastly, we give our outlook in this field.

    Basics of nonlinear optics

    Nonlinear optics is a branch of optics in which the interaction between intense light and matter is studied. The optical properties of a material system can be modified in response to the high-intensity coherent light, i.e. laser beam. This leads to the nonlinear optical processes, such as harmonic generation, four-wave mixing, multiphoton fluorescence, self-focusing, solitons and saturable absorption. The field of nonlinear optics started as the experiment of the second-harmonic generation by Franken et al. in 19618. This is the first nonlinear optical effect ever observed in an experiment, which occurred shortly after the laser was invented in 19609. After that, numerous nonlinear optical effects have been observed. All these nonlinear effects may consist of two aspects, firstly the medium produces nonlinear responses under the action of strong light, and then in reaction, modulation of incident light field by medium.

    When the electric field is applied to the material, the induced polarization P(t) can be expressed as a power series in terms of the electric field strength E(t):

    $ \boldsymbol{P}(t) = {\varepsilon _0}[{\chi ^{(1)}}\boldsymbol{E}{(t)^1} + {\chi ^{(2)}}\boldsymbol{E}{(t)^2} + {\chi ^{(3)}}\boldsymbol{E}{(t)^3} + ...], $

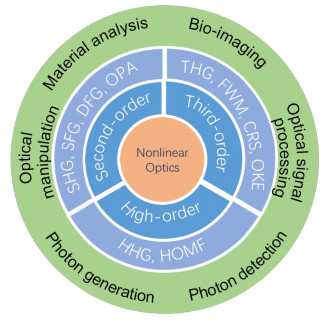
    where ${\varepsilon _0}$ is the permittivity of free space; ${\chi ^{(1)}}$ is the linear susceptibility which describe the linear optics process; ${\chi ^{(2)}}$and${\chi ^{(3)}}$are the second and third order nonlinear optical susceptibilities, respectively. When the incident light is strong enough, or the nonlinear optical susceptibilities are large, the nonlinear terms become non-ignorable. The output light frequency could be different from the input light frequency. The typical examples of second-order nonlinear optical effects include second-harmonic generation, sum-frequency generation, difference-frequency generation, and optical parametric amplification and oscillation. The third-order nonlinear optical effects include third-harmonic generation, four-wave mixing, and optical Kerr effect. The high-order nonlinear optical effects include higher order harmonic generation and higher order multiphoton fluorescence. These effects, especially the second- and third- order nonlinear optical effects, are widely applied in photon generation, frequency manipulation, and imaging.

    The second-order nonlinear optical processes come from the second-order contribution to nonlinear polarizatio${\boldsymbol{P}^{(2)}}(t) = {\varepsilon _0}{\chi ^{(2)}}\boldsymbol{E}{(t)^2}$. In the case of the second-harmonic generation, incident beam with frequency ω converts to the radiation with frequency 2ω. The second-harmonic generation is due to the interaction and exchange of photons with different frequencies. Two photons of frequency ω are absorbed by the medium, and produce a photon of frequency 2ω simultaneously. For sum or difference frequency generation, the incident optical field containing two frequency components interacts within a second order nonlinear optical material. The various frequencies of the polarization could be produced, including 2ω1, 2ω2, ω1+ω2, and ω1-ω2. The latter two describe the process of sum-frequency generation and difference-frequency generation, respectively. Since the nonlinear polarization can only produce output signal efficiently when the condition of phase matching is satisfied, which can only occur for one frequency component. Thus, there is only one new major frequency that will be present in the radiation. In optical parametric amplification and oscillation, a weak input beam is amplified with the help of a strong high frequency pump beam through difference-frequency generation process. When an optical resonator is used to hold the nonlinear material, the radiation at lower frequencies can be largely amplified.

    The third-order nonlinear optical processes come from the third-order contribution to nonlinear polarization${\boldsymbol{P}^{(3)}}(t) = {\varepsilon _0}{\chi ^{(3)}}\boldsymbol{E}{(t)^3}$. As a typical third-order nonlinear optical process, the third-harmonic generation describes a process that a radiation with frequency 3ωis created by an incident field with frequency ω. In this process, three incident photons with frequency ω are destroyed and simultaneously one photon with frequency 3ω is created. In the four-wave mixing process, three input light of frequencies ω1, ω2, and ω3, interact with material and produce a signal at frequency ω4. The four-wave mixing output can be enhanced due to the vibrational or electronic properties of the materials. The coherent anti-Stokes Raman scattering, stimulated Raman scattering and optical Kerr effect are typical examples of vibrationally enhanced four-wave mixing. When the incident light field satisfies the material's electron transition resonance condition, the electronically enhanced four-wave mixing signal can be observed.

    It should be noted that the nonlinear optical susceptibility is a tensor, and it depends on the structures of materials. Actually, the independent component number of the tensor can be reduced due to intrinsic symmetry of the material. Thus, the nonlinear optical effects provide sensitive tools for detecting the orientation of materials. The second-order and other even-order nonlinear optical effects can only occur in the noncentrosymmetric materials. While the third-order nonlinear optical effects can occur in the materials regardless of being centrosymmetric or not1-2.

    Conventional nonlinear optical materials

    According to the induced polarization formula, the materials for nonlinear optics should have large susceptibilities. Besides this basic requirement, the nonlinear optical materials also need to meet other conditions. For example, the materials should be chemically stable that could resist laser power; they should be transmissive and have fast response to the input laser pulse; for the second order or other even order nonlinear optical materials, there is an extra requirement of noncentrosymmetry.

    Second-order nonlinear optical materials

    As discussed previously, only the materials without center of inversion symmetry can have a second-order nonlinear effect. Besides, the materials need to satisfy the standard phase matching to have a high efficiency of nonlinear process. The birefringent crystals that allow compensation for dispersion is an important category of second-order nonlinear optical materials, such as AgGaSe2, BaB2O4, LiIO3, LiNbO3, KH2PO4 and so on10. Since the birefringence phase matching suffers from the limited tuning wavelength range, small nonlinear coefficient, increased phase matching temperature, and difficult coupling angle, the approach of quasi-phase matching, which can periodically reverse the nonlinear interaction to compensate for phase mismatching, is preferred. The periodic poling to the materials is the commonly used method to realize it11. These periodically poled materials are one of the types of nonlinear optical materials, such as periodically poled KTiOPO412, RbTiOAsO413, LiTaO314-15, BaTiO316, and KNbO317. In addition, the electric asymmetric organic molecules which have large molecular hyperpolarizability can present second-order nonlinear optical effects. To build long-range ordered structures for realizing applicable scale of nonlinear optical effect, film structure is preferred.

    Some materials with nano or micro structures can present strong second-order nonlinear optical effects. The inorganic materials including ZnO16, KNbO319, GaN20, GaP21 and GaAs22-23 nanowires and atomically layered two-dimensional MoS224 and GaSe25 can realize second harmonic generation. The organic materials including tripeptides nanostructures26, dipeptides microtubes27, electrospun α-helical poly(α-Amino Acid) nanofibers28, and self-assembled 3–methyl–4-methoxy–4–nitrostilbene hexagonal micro-prisms29 also have shown strong second-harmonic generation.

    Third-order nonlinear optical materials

    Third-order materials have the third-order nonlinear optical responses, leading to the processes such as two photon absorption and third-harmonic generation. The insulating crystals typically have third-order nonlinear optical susceptibilities around 10-14–10-13 esu. Semiconductors often have larger third-order susceptibilities of 10-13–10-10 esu which is wavelength dependent. The susceptibility depends on the incident photon energy and the bandgap of the semiconductor. When the photon energy is smaller than the energy of bandgap, there is little difference between the semiconductors and the insulating crystals. When the photon energy is close to the bandgap energy, the excitation resonance is the main nonlinear optical mechanism in the semiconductors. When the photon energy is larger than the bandgap energy, the nonlinear response results from the electron excitation from valence band to conduction band, and leads to the change of optical properties of the materials30. Organic materials are another important category of third-order nonlinear optical materials, and large optical nonlinearities have been reported in them. For example, polydiacetylene and derivatives can have third-order nonlinear optical susceptibilities around 10-10 esu. Organic molecules with metal ions like phthalocyanine and porphyrin31-33 also have promising third-order optical nonlinearities. Moreover, very strong nonlinear optical effects are often reported in the composite materials. For example, when embedding semiconductor or metal nanoparticles in glass with only a small volume concentration, the nonlinear susceptibility can be increased six orders larger than that of the glass34.

    Some nano or micro structures also have been built for realizing third-order nonlinear optical properties. For example, anisotropic two-photon excited fluorescence has been observed in ZnO nano/microwires35; two-photon pumped lasing has been achieved using CdS microwires36 and ZnO nanowires37 and nanoparticle38. Organic materials like 2-(N, N-diethylanilin-4-yl)-4, 6-bis (3, 5-dimethylpyrazol-1-yl)-1, 3, 5-triazine nanowires can serve as two-photon absorbers and waveguides39. In the hybrid material fabricated through embedding cationic dye 4-[p-(dimethylamino)styryl]-1-methylpyridinium to anionic metal-organic framework, two-photon pumped lasing was observed40.

    The nonlinear optical properties of materials play an important role in many optical applications, including bio-imaging, material structure analysis, optical signal processing, optical manipulation, photon generation, photon detection, and many others (Fig. 1). For bio-imaging specifically, various structures in biomedical samples show intrinsic nonlinear optical signals, and the signals can also be enhanced by extra nonlinear optical materials. Thus, the nonlinear optical imaging for biomedical applications has been extensively studied. Herein, our review focuses on the nonlinear optical bio-imaging and their recent advances.

    Typical examples of nonlinear optics processes and applications. SHG: second-harmonic generation, SFG: sum-frequency generation, DFG: difference-frequency generation, OPA: optical parametric amplification, THG: third-harmonic generation, FWM: four-wave mixing, CRS: coherent Raman scattering, OKE: optical Kerr effect, HHG: high-harmonic generation, HOMF: high-order multiphoton fluorescence.

    Figure 1.Typical examples of nonlinear optics processes and applications. SHG: second-harmonic generation, SFG: sum-frequency generation, DFG: difference-frequency generation, OPA: optical parametric amplification, THG: third-harmonic generation, FWM: four-wave mixing, CRS: coherent Raman scattering, OKE: optical Kerr effect, HHG: high-harmonic generation, HOMF: high-order multiphoton fluorescence.

    Nonlinear optical techniques applied to bio-imaging

    To our knowledge, the nonlinear optical imaging techniques, including two-photon excited fluorescence, second-harmonic generation, third-harmonic generation, coherent anti-Stokes Raman scattering, stimulated Raman scattering and pump-probe imaging (Fig. 2), are promising in studying the biological samples, because of their high optical spatial and temporal resolution, no requirement for extra label, non-contact/non-destructive operation, and chemical specificity. Figure 3 shows the energy diagrams of these nonlinear optical processes.

    Main nonlinear optical modalities applied to bioimaging.

    Figure 2.Main nonlinear optical modalities applied to bioimaging.

    Energy diagrams of nonlinear optical processes employed for the bio-imaging.TPEF: two-photon excited fluorescence. In this process, the material is excited by two photons with frequency of ω1 and emits a photon (ωTPEF) with higher energy than each incident photon. SHG: second-harmonic generation. In this process, two photons with frequency of ω1 are converted to one photon (ωSHG) with energy doubled of the incident photon.THG: third-harmonic generation. In this process, three photons are converted to one photon (ωTHG) with energy triple of the incident photon. CARS: coherent anti-Stokes Raman scattering. In this process, pump beam with frequency of ωp and Stokes beam with frequency of ωs interact with the material and generate a signal at anti-Stokes frequency ωas=2ωp-ωs. The signal can be enhanced when Ω=ωp-ωs is close to the frequency of a vibrational energy state of a chemical bond in the sample. SRS: stimulated Raman scattering. In this process, when the frequency difference of pump beam and stokes beam Ω, matches the vibrational resonance, a small part of the input energy transfers from one beam to the other. Pump-probe: in this process, a transient absorption is induced by the pump beam (ωp) and change the excited state of the material first. Then such change is detected by a probe beam (ωpr), and the dynamics of excited state can be deduced through varying the delay time between probe and pump beam pulses. The solid lines are the electronic and vibrational states, and the dashed lines are the virtual states.

    Figure 3.Energy diagrams of nonlinear optical processes employed for the bio-imaging. TPEF: two-photon excited fluorescence. In this process, the material is excited by two photons with frequency of ω1 and emits a photon (ωTPEF) with higher energy than each incident photon. SHG: second-harmonic generation. In this process, two photons with frequency of ω1 are converted to one photon (ωSHG) with energy doubled of the incident photon. THG: third-harmonic generation. In this process, three photons are converted to one photon (ωTHG) with energy triple of the incident photon. CARS: coherent anti-Stokes Raman scattering. In this process, pump beam with frequency of ωp and Stokes beam with frequency of ωs interact with the material and generate a signal at anti-Stokes frequency ωas=2ωp-ωs. The signal can be enhanced when =ωp-ωs is close to the frequency of a vibrational energy state of a chemical bond in the sample. SRS: stimulated Raman scattering. In this process, when the frequency difference of pump beam and stokes beam , matches the vibrational resonance, a small part of the input energy transfers from one beam to the other. Pump-probe: in this process, a transient absorption is induced by the pump beam (ωp) and change the excited state of the material first. Then such change is detected by a probe beam (ωpr), and the dynamics of excited state can be deduced through varying the delay time between probe and pump beam pulses. The solid lines are the electronic and vibrational states, and the dashed lines are the virtual states.

    Two-photon and three-photon excited fluorescence microscopic imaging

    In the two-photon excited fluorescence (TPEF) process, which is the most common in multiphoton fluorescence process, the molecule is excited by the absorption of two photons simultaneously. This technique can prolong the incident light wavelength to infrared range, compared to the excitation by one photon in the range of ultraviolet or visible light. The infrared light can improve the penetration depth in the tissue and reduce potential photodamag41-42. Therefore, it is thought as one of the most popular noninvasive imaging tools which allows for imaging hundreds of microns deep in tissues (Fig. 4)43.

    Two-photon excited fluorescence imaging of vasculature and neuron in vivo.(a) Three-dimensional imaging of layer V pyramidal neurons labeled with yellow fluorescent protein (left) and vasculature labeled with Texas Red (right), and excited by a fiber laser. (b) Selected z-sections of the merged stacks in (a). (c) Three-dimensional imaging of vasculature labeled with Texas Red, and excited with an optical parametric amplifier. (d) z-sections of the stacks in (c). (e) Vectorized vasculature in (c). The scale bar is 50 μm. Figure reproduced from: ref.43, Elsevier.

    Figure 4.Two-photon excited fluorescence imaging of vasculature and neuron in vivo. (a) Three-dimensional imaging of layer V pyramidal neurons labeled with yellow fluorescent protein (left) and vasculature labeled with Texas Red (right), and excited by a fiber laser. (b) Selected z-sections of the merged stacks in (a). (c) Three-dimensional imaging of vasculature labeled with Texas Red, and excited with an optical parametric amplifier. (d) z-sections of the stacks in (c). (e) Vectorized vasculature in (c). The scale bar is 50 μm. Figure reproduced from: ref.43, Elsevier.

    The TPEF microscopy was first reported by Denk et al. in 1990. They demonstrated intrinsic three-dimensional spatial resolution with laser scanning44. The TPEF microscopy can image some of the endogenous fluorophores such as nicotinamide adenine dinucleotide (NADH)45-47, flavin adenine dinucleotide (FAD)48 and elastin49. These endogenous fluorophores whose absorption bands are in ultraviolet range can be excited by using infrared illumination50. Such intrinsic contrasts enable the investigation of native cell and tissue structures without introducing artificial label compounds. Yu et al. reported on two photon excited fluorescence polarization and lifetime imaging of intrinsic NADH in breast cancer and normal cells for quantitatively analyzing the concentration and ratio between two different conformations (free or enzyme bound) of NADH. They revealed the sensitivity in detecting intracellular NADH concentration and conformation to cell physiology at the single-cell level51. Kasischke et al. reported TPEF imaging of intrinsic NADH and their geometric association with the cortical microcirculation, revealing the well-defined boundaries of the tissue oxygen diffusion in mouse cortex52. Balu et al. monitored changes in two photon-excited NADH fluorescence in human epidermal cells during blood-supplied oxygen deprivation in vivo, noninvasively revealing the depth dependent sensitivity of keratinocytes to vascular oxygen supply and their metabolism in human skin53.

    To improve the resolution and penetration depth, the exogenous labeling of the biological structure of interest is usually needed in most cases. Synthetic dyes and fluorescent proteins are the most widely used labeling agents. Recently, Mansour et al. reported the in vivo two photon imaging of blood vessels and functional neuronal networks through the introduction of Texas Red dextran, genetic encoding green fluorescent protein, and calcium fluorescent protein indicator in human brain organoids, which are transplanted into the adult mouse brain54. New synthetic fluorescent probes with improved optical properties such as large two photon absorption cross section and high quantum yield, which could lower the excitation power and reduce the photodamage and photobleaching, are being continuously developed55-59. In addition, some nanoparticles with good two photon fluorescence properties, such as gold nanoparticles60-61, gold-silver hybrid nanoparticles61-63, upconverting nanoparticles64, surface modified carbon dots65-66, and polymer nanoparticles67-68, have been developed for in vivo TPEF imaging.

    The three-photon excitation can further prolong the incident light wavelength over the two-photon excitation. Xu's group demonstrated three-photon fluorescence imaging of subcortical structures in mouse brain at the spectral window of 1700 nm69. They also reported three-photon imaging for recording neurons activity in mouse brain70. Recently, they realized three-photon imaging of vasculature through mouse skull, and also calcium imaging in cortical layers in awake mice over weeks71. On the other hand, some researchers focused on the tissue heating problem of three-photon excitation which higher optical pulse power is needed. Recently, Rowlands et al. developed a wide field three-photon excitation scheme for imaging biological samples without causing photodamage72. Besides, Guesmi et al. reported an optimized multiband pulses source for three-photon excitation and realized fast deep tissue imaging with low tissue heating73. Moreover, they think the development of proper sources which can provide efficient three-photon excitation of biological samples is critical for three-photon bio-imaging application.

    Second harmonic generation microscopic imaging

    In the second-harmonic generation (SHG) process, which is a second-order nonlinear optical process, two incident photons interact with the materials and convert to one emission photon with double of the excited photon energy. It can only occur in the noncentrosymmetric structures. Since some of the biological components can assemble into noncentrosymmetric structures, the second harmonic generation has been applied to image the biological structures such as collagen, microtubules and muscle myosin74-75. It is a sensitive label-free probe method, and the signal can be well separated from the auto-fluorescence of biological samples (Fig. 5).

    Second harmonic generation imaging of the collagen tissues.(a) Self-assembled collagen gel. (b) Mouse dermis, (c) mouse bone. (d) Human ovary. Figure reproduced from: ref.83, Springer Nature.

    Figure 5.Second harmonic generation imaging of the collagen tissues. (a) Self-assembled collagen gel. (b) Mouse dermis, (c) mouse bone. (d) Human ovary. Figure reproduced from: ref.83, Springer Nature.

    SHG is firstly reported in 19618 shortly after the invention of laser. Then the microscopic demonstration of the SHG appeared in 1970s76-77. In 1986, SHG imaging of the collagen fibers orientation in rat tail was shown by Freund et al.78 As it continues to develop, with SHG imaging with intrinsic contrast generated from collagen, microtubules and muscle myosin, people do not need to introduce extra labelling agents. Type–I collagen is the most abundant structural protein in human body79, thus the SHG signal can be effectively obtained from the cornea, the skin, bones or tendons80-85. These capabilities make SHG a powerful tool for biological researches and disease diagnosis. For example, SHG was reported to delineate breast cancers in different stages86-88; show the increase of collagen fiber formation in ovary cancers89-90; identify the tumor boundary in skin cancers91-94; detect fibrosis in liver and kidney95-96; diagnose connective tissue disorders such as Osteogenesis imperfect97, Sjogren's syndrome98 and skin damages99; and show collagen plaques intermingling with elastin in atherosclerosis100-101. Chen et al. provided the detailed strategy to obtain and quantitatively analyze the structural information on the arrangement of collagen in tissues83. Additionally, Prasad and Qu's teams applied SHG to produce light excitation of photosensitizer for photodynamic therapy102.

    Since many nanostructures also have intense SHG signals18, 19, 103-105, including ZnO nanowires18, GaN nanowires20, KNbO3 nanowires19, noble metallic nanoparticles106-108, Fe(IO3)3, KTiOPO4, BiTiO3 nanocrystals103, 104, 109110, some of them have been used as probes for specific biomolecules109. SHG signals can be used to track the nanoparticles in cells and tissues109-111. Magouroux et al. used KNbO3 nanoparticles to label the membrane of embryonic stem cells and monitored the evolution of embryonic stem cells (ESCs) by capturing ESC-derived cardiomyocytes beating within a three-dimensional cluster112. Recently, de Boer et al. demonstrated that second harmonic near infrared absorption of gold nanoparticles can optically evoke neuronal activity in mouse cortical neurons in acute slices and in vivo. And they also used this approach to stimulate individual epitheliomuscular cells and evoke body contractions in Hydra vulgaris113.

    Third harmonic generation microscopic imaging

    In the third harmonic generation (THG) process, which is a third-order nonlinear optical process, three incident photons generate one photon with triple of the excited photon energy. The THG can occur in the materials regardless of their centrosymmetry, which is different from the SHG. Since its signal from homogenous material can vanish because of the Gouy phase shift of the incident field across the focus2, 114, it is sensitive to the interfaces and inhomogeneities. It has been applied to the imaging of biological samples without labels. Besides, the THG can prolong the excitation wavelength to near infrared (NIR) II range (1100–1350 nm). The light within this range can penetrate deeper in tissues than the NIR I (600–800 nm) light115. This feature makes THG a promising choice for deep tissue imaging.

    THG at the interface was firstly demonstrated using a focused intense femtosecond pulsed laser by Tsang in 1995116. Then the THG microscopy was reported by Barad et al. in 1997117. After that, THG microscopy was applied in biology. The live neurons in cell culture and yeast cells were imaged by Yelin et al. in 1999118. So far, the THG microscopy has been applied to the imaging of many biological samples, such as lipid bodies119, zebrafish embryos120-122, zebra fish nervous system120, vocal folds123, retina124, oral mucosa125-126, rat tympanic membrane127, bone128-129, fat tissue130, skin tissue94, 131-136, epithelial tissues131, 136-137, and brain structures69-71, 138-141. Recently, Kazarine et al. developed a technique of THG image scanning cytometry and applied it to malaria detection. The technique is based on their previous work that revealed hemozoin, which is a metabolic byproduct of the malaria parasite and present a significant third harmonic generation signal. They used this endogenous contrast to label-free image scanning cytometry of patient blood smears for the automated malaria detection142. ​Huizen et al. applied the THG combined SHG microscopy to imaging of fresh unprocessed healthy human tissue. They compared the images with the gold standard hematoxylin and eosin histological images and identify the key structural components in the tissue143.

    On the other hand, for long term cell tracking, non-bleachable THG contrast from nanoparticles is usually required. Since the THG signal from nanoparticles can be enhanced by surface plasmon resonances144, which commonly occur in gold145-146 and silver147-148 nanoparticles, it is feasible to image these nanoparticles through the THG microscopy and also make use of them as potential biomarkers. Besides, semiconductor nanomaterials, such as Si, ZnO and CdSe nanostructures, have also been found presenting the THG signals149-151. For example, Jung et al. reported imaging of Si nanowires with high resolution in vivo149. Recently, Dubreil et al. observed BiFeO3 nanoparticles labeled stem cells 1.3 mm deep in tissue by a 1300 nm femtosecond laser152. Lee et al. developed a new type of mesostructured α-FeOOH nanorods, which exhibit an enhanced THG signal under excited wavelength of 1230 nm because of the sub‐wavelength heterogeneity of refractive index. They also applied these nanorods as non-bleaching biocompatible third harmonic generation contrast agents for long-term observation in vivo (Fig. 6)153.

    Third harmonic generation microscopic imaging of the tissues in vivo.(a) Third harmonic generation. (b) Second harmonic generation imaging of mouse ear in vivo. (c) Third harmonic generation and second harmonic generation. (d) Third harmonic generation imaging of the mouse ear after the injection of FeOOH nanoparticles. Size of view fields: (a, b) 240 µm × 240 µm, (c, d) 80 µm × 80 µm. Figure reproduced from: ref.153, Wiley-VCH.

    Figure 6.Third harmonic generation microscopic imaging of the tissues in vivo. (a) Third harmonic generation. (b) Second harmonic generation imaging of mouse ear in vivo. (c) Third harmonic generation and second harmonic generation. (d) Third harmonic generation imaging of the mouse ear after the injection of FeOOH nanoparticles. Size of view fields: (a, b) 240 µm × 240 µm, (c, d) 80 µm × 80 µm. Figure reproduced from: ref.153, Wiley-VCH.

    Coherent anti-Stokes Raman scattering microscopic imaging

    The coherent anti-Stokes Raman scattering (CARS) process is a vibrational resonance enhanced four-wave mixing process, which is a third-order nonlinear optical process. In this process, two beams, one is pump beam with frequency ωp and the other is Stokes beam with frequency ωs, interact with the material and generate a signal at anti-Stokes frequency 2ωp-ωs. The signal can be enhanced when ωp-ωs is close to the frequency of a vibrational energy state of a chemical bond in the sample. It can provide chemical contrast without exogenous labels, and has already been used in the label-free chemically specific imaging for characterization of biological samples (Fig. 7).

    Coherent anti-Stokes Raman scattering imaging of tissues with CH2 contrast. Image of (a) white adipose tissue in mouse omentum majus, (b) mouse lung tissue with alveoli, (c) adipocyte covered mouse kidney surface, (d) mouse kidney with renal tubules, (e) bovine retina cross section, and (f) human retina at the retinal surface. Figure reproduced from ref.172, Annual Reviews.

    Figure 7.Coherent anti-Stokes Raman scattering imaging of tissues with CH2 contrast. Image of (a) white adipose tissue in mouse omentum majus, (b) mouse lung tissue with alveoli, (c) adipocyte covered mouse kidney surface, (d) mouse kidney with renal tubules, (e) bovine retina cross section, and (f) human retina at the retinal surface. Figure reproduced from ref.172, Annual Reviews.

    The CARS process was first reported by Terhune and Maker in 1965154. And then the CARS spectroscopy was developed and used for chemical analysis155. In 1982, the CARS microscopy in two-dimension was reported by Duncan et al. In 1999, the three-dimensional CARS microscopy was developed for imaging live cells by Zumbusch et al.156 After that, the high-speed laser-scanning CARS microscopy157, Epi-detected CARS microscopy158, and multiplex CARS microscopy159-160 have been developed for biomedical applications. The CARS is a sensitive tool for probing strong CH-related vibrations in lipids. The signal allows for monitoring lipid metabolism in living cells and model organisms161-166 and lipid droplets transport, lipolysis and growth167-169. In addition, since the lipid structures are widely distributed in tissues, CARS imaging has been applied to many organism and tissue observation, such as observing skin170-171, adipose tissue, kidney tissue, retina172, lung tissue173, smooth muscle in colon174 and blood vessels175, nerve bundle176-179, and brain tissue180-181. Besides, the typically weak fingerprint region of Raman signals could be probed through intrapulse three colour excitation and non-resonant background amplification. This technique enables the identification of nuclei, collagen, protein, as well as lipid droplets in two- or three-dimensional tissues, expanding the prospect of CARS in biological imaging and potential clinic use182. Furthermore, CARS has also been used to identify healthy and diseased tissue in skin cancer171, colon cancer183-184, and brain cancer185.

    Recently, Karuna et al. reported label-free three-dimensional quantitative imaging of chemical composition of the human osteosarcoma cell division by using the hyperspectral CARS microscopy186. Niedieker et al. applied CARS imaging to characterize the myopathological features in muscles from patients with different myopathies, and to identify the distinct specific disease features187. Hirose et al. developed a CARS rigid endoscope using two individual optical fibers to image rat sciatic nerves and also rabbit prostatic fascia without sample slicing, which revealed the potential application of the CARS endoscope to robot-assisted surgery188.

    The CARS microscopy also serves as a tool to map the drug molecules dynamics without any fluorescent labels. For example, Kang et al. visualized the distribution and release of paclitaxel in a polymer matrix189; Hartshorn et al. mapped the chemical components in indomethacin tablets190; Fussell et al. studied the distribution of micronized salmeterol xinafoate and budesonide on the surface of lactose carrier191. Additionally, CARS is sensitive to polymer-based nanoparticles because of their abundant C-H bonds. The CARS has been used to observe the intracellular trafficking of the nanoparticle drug carriers and monitor the drug release process192-195.

    Stimulated Raman scattering microscopic imaging

    The stimulated Raman scattering (SRS) process is another vibrational resonance enhanced four-wave mixing process. In this process, when the frequency difference of two incident beams, pump beam and stokes beam, matches the vibrational resonance, a small part of the input energy transfers from one beam to the other. The intensity of one beam is modulated in response to the variation, and this modulation can be transferred to the other beam. In such process, the intensity of Stokes beam has a gain and pump beam has a loss. The SRS signal can be measured by sensitive photodetection, such as lock-in amplifier196-201 or tuned amplifier202. The main advantage of SRS over CARS is the absence of non-resonance background. Some examples of stimulated Raman scattering imaging of biological samples are shown in Fig. 8.

    Stimulated Raman scattering imaging of biological samples.(a) Image of chemical mapping of C. elegans intracellular compartments, LROs: lysosome-related organelles, the scale bar is 50 mm. (b) Live HeLa cells, left: signals from C-D (2133 cm-1) showing deuterium-labeled amino acids, right: signals from C-H (2845 cm-1), the scale bars is 10 μm. (c) Phenyl-diyne cholesterol in C. elegans, left: signal from C≡C (2247 cm-1) showing distinct cholesterol store, right: signal from C-H rich fat store (2885 cm-1), the scale bars is 10 mm. (d) Left: time-lapse of HeLa cell division, DNA (magenta), lipids (green); right: section of normal human skin tissue, DNA (magenta), lipids (green), the scale bar is 20 mm. (e) Drug tablets, green: microcrystalline cellulose, blue: dibasic calcium phosphate anhydrous, red: the drug amlodipine besylate, yellow/orange: sodium starch glycolate, magenta: magnesium stearate, the scale bars is 200 mm. Figure reproduced from ref.203, American Association for the Advancement of Science.

    Figure 8.Stimulated Raman scattering imaging of biological samples. (a) Image of chemical mapping of C. elegans intracellular compartments, LROs: lysosome-related organelles, the scale bar is 50 mm. (b) Live HeLa cells, left: signals from C-D (2133 cm-1) showing deuterium-labeled amino acids, right: signals from C-H (2845 cm-1), the scale bars is 10 μm. (c) Phenyl-diyne cholesterol in C. elegans, left: signal from C≡C (2247 cm-1) showing distinct cholesterol store, right: signal from C-H rich fat store (2885 cm-1), the scale bars is 10 mm. (d) Left: time-lapse of HeLa cell division, DNA (magenta), lipids (green); right: section of normal human skin tissue, DNA (magenta), lipids (green), the scale bar is 20 mm. (e) Drug tablets, green: microcrystalline cellulose, blue: dibasic calcium phosphate anhydrous, red: the drug amlodipine besylate, yellow/orange: sodium starch glycolate, magenta: magnesium stearate, the scale bars is 200 mm. Figure reproduced from ref.203, American Association for the Advancement of Science.

    The SRS process was first reported in 1962204. After that, the SRS spectroscopy with continuous-wave laser was developed in 1977205. In 2007, the SRS imaging was demonstrated on polystyrene beads with femtosecond laser206. In 2008, Xie's group demonstrated highly sensitive imaging of biological samples with picosecond laser, and opened the new era of SRS microscopy for biomedical imaging196. SRS provides a new tool for lipid study without non-resonant background. It has been applied to the study of fat storage in C. elegans207, transport of lipid droplets in early fruit fly embryos208, fat droplets, cholesterol-rich lysosomes, and lipid oxidation in C. elegans209, and myelin sheaths in Xenopus laevis tadpoles210. SRS microscopy also allowed for co-mapping of lipids, protein, and DNA, through their distinct features in the C-H stretching vibration region. This enabled the multicolored stain-free histopathology of cells and organs tissues, such as skin and brain tissues, and is comparable with the conventional hematoxylin and eosin based histopathology211-214. Some biochemicals, such as cholesterol, glyceryl trioleate and bovine serum albumin, can also be detected through their fingerprint Raman spectra. Cholesterol storage in intact atherosclerotic arterial tissues215 and Esterified cholesterol accumulation in prostate cancer and metastases214 were imaged by SRS microscopy. High-level unsaturated lipids were detected in ovarian cancer stem cells by SRS microscopy216. Furthermore, SRS microscopy was applied to identify squamous cell carcinoma in human skin tissue217, and detect brain tumor in mice in vivo218. The Raman spectroscopy has been used for brain tumor detection during surgery on a patient219. Recently, Ji et al. applied SRS microscopy to image amyloid plaques in brain tissue from the mouse model of Alzheimer's disease. They distinguished misfolded protein in Alzheimer's diseased brain tissues through SRS spectral blue shift of the amide I band. This method provided a new tool to study Alzheimer's disease and other protein misfolding associated neurodegenerative diseases220. Yan et al. applied hyperspectral SRS microscopy to image the lipid metabolites in normal and cancerous liver tissues from patients, and found aberrant accumulation of saturated fat in human liver cancer. Their finding revealed that saturated fat played an important role in liver cancer development and could serve as a potential biomarker for liver cancer 221.

    Besides, isotope substitution has been developed for Raman contrast, since the C-D bond Raman spectra can be separated from the endogenous Raman features. For example, deuterated fatty acids were imaged to study the conversion of palmitic acid into lipid droplets in live cells and the fat storage in C. elegans199; deuterated amino acids were used to image the protein synthesis in cells222; deuterated glucose was used to visualize de novo lipogenesis in pancreatic cancer cells223. 13C-labeled phenylalanine also served as Raman contrast and was used to monitor proteome degradation process in cells224. Recently, Li et al. applied multiple vibrational tags, including alkyne-tagged fatty acid, deuterium-labeled saturated fatty acid and unsaturated fatty acid, to image the lipid synthesis and lipolysis in C. elegans225.

    SRS microscopy has also been applied to monitor the drug molecules using chemical Raman fingerprint. For example, Slipchenko et al. mapped the active pharmaceutical ingredient and excipients in amlodipine besylate tablets226; Fu et al. imaged the tyrosine kinase inhibitors distribution in living cells227; Chiu et al. measured the deuterated water, propylene glycol and dimethyl sulphoxide molecular diffusion in the human nail228.

    Pump-probe transient absorption

    The pump-probe transient absorption technique can be used to detect the molecules that have no fluorescence because of non-radiative decay from the excited state, and it is based on the third-order nonlinear optics. In this process, a transient absorption is induced by the pump beam and changes the excited state of the material first. Then such change is detected by a probe beam, and the dynamics of the excited state can be deduced through varying the delay time between probe and pump beam pulses. This technique has been used for imaging non-fluorescent chromophores, such as cytochromes and hemoglobin229-231.

    The transient absorption microscopy was firstly applied in biology for measuring dye fluorescence lifetime in cells by Dong et al. in 1990s232. Then in 2007, the transient absorption imaging with high frequency modulation was reported by Fu et al. and used for imaging melanin and oxy-/ deoxyhemoglobin233-234. Min et al. demonstrated the three-dimensional imaging of non-fluorescent chromoproteins, chromogenic reporter in gene expression, transdermal drug distributions, and microvasculature which is based on hemoglobin235. Besides, the transient absorption microscopy can differentiate eumelanin and pheomelanin, which are two types of melanins, due to their different transient absorptive response236. The transient absorption imaging has been used to monitor melanoma progression237 and assess metastatic potential of melanomas238. Recently, Chen et al. studied the dynamics of heme storage and distribution in C. elegans by using high-resolution transient absorption microscopy239 (Fig. 9). Dong et al. applied transient absorption imaging to differentiate glycated hemoglobin from hemoglobin due to their different excited state dynamics. They studied heme modification and quantified the glycated hemoglobin fraction at single red blood cell level. They found that the distribution of glycated hemoglobin fraction was different in diabetic whole blood from that in healthy whole blood. They also developed a mathematical model to derive the blood glucose concentration and monitored the long-term bloodstream glucose concentration240.

    Transient absorption imaging of heme granule dynamics in C. elegans.(a) Image of C. elegans at time zero, arrow: heme granule, blue line: worm intestinal membrane outline, the scale bar is 40 μm. (b) Enlarged view of heme granule in the white box of (a) at different time points. Figure reproduced from: ref.239, American Society of Chemistry.

    Figure 9.Transient absorption imaging of heme granule dynamics in C. elegans. (a) Image of C. elegans at time zero, arrow: heme granule, blue line: worm intestinal membrane outline, the scale bar is 40 μm. (b) Enlarged view of heme granule in the white box of (a) at different time points. Figure reproduced from: ref.239, American Society of Chemistry.

    Moreover, transient absorption imaging can also be realized through exogenous contrast agents such as nanoparticles. The non-fluorescent contrasts have been generated from several nanostructures in biological samples, including semiconducting and metallic carbon nanotubes241, nanodiamonds242, gold nanorods243 and graphene/graphene oxide244.

    Outlook

    Nonlinear optics can provide label-free, chemical specific and high-speed imaging strategies, which facilitate the studies of the biomedical dynamic process both in vitro and in vivo. It plays an important role in the bio-imaging for decades. Each nonlinear optical imaging strategy has distinct viability to certain structures or molecules. This is the advantage of nonlinear optical imaging. On the other hand, each nonlinear optical imaging strategy may rely on specific chemicals or certain optical probes, not able to simultaneously observe different structures and interaction in bio-samples. To visualize the complex biological system, the combination of these nonlinear optical imaging techniques is desired. This promotes the development of multimodal nonlinear optical imaging platforms. The two/three-photon excited fluorescence microscopy and second-/third-harmonic generation microscopy are one-beam systems. The coherent anti-Stokes Raman scattering, stimulated Raman scattering and pump-probe transient absorption microscopy are two-beam systems. The two-beam system coherent anti-Stokes Raman scattering microscopy can serve as a base platform for building other nonlinear optical modules. Such integration enables the simultaneous visualization of different structures or molecules and even their interaction in the complex biological samples. In our opinion, the current development bottleneck of nonlinear optical bio-imaging is in the aspects of imaging depth, spatial resolution, detection sensitivity and acquisiton speed. Although many exciting developments have been made, to achieve the goal of clinic translation, new technical breakthroughs are still needed. The further improvement on imaging depth, spatial resolution, detection sensitivity and acquisition speed is expected. For deeper imaging, new active focusing technique, or the optical fiber delivery, even endoscopy may be the direction of development. For higher spatial resolution, the combination with the super resolution imaging techniques could be a direction. For increasing the detection sensitivity, especially to achieve the single molecule detection, combining the coherent Raman scattering microscopy with force measurement of chemical bond vibration may be a solution. For higher acquisition speed, frequency multiplexed schemes245 could be used to monitor fast process. As more breakthrough emerges, the nonlinear optical imaging is believed to have great promise to become a powerful tool for both fundamental biomedical studies, and clinic application such as diagnostic and therapeutic evaluation.

    Acknowledgements

    This work was supported in part by the National Natural Science Foundation of China (61722508/ 61525503/ 61620106016/ 61835009/ 61935012/ 61961136005), (Key) Project of Department of Education of Guangdong Province (2016KCXTD007), and Shenzhen Basic Research Project (JCYJ20180305124902165).

    Competing interests

    The authors declare no competing financial interests.

    References

    [1] Y R Shen. The Principles of Nonlinear Optics(1984).

    [2] R W Boyd. Nonlinear Optics(2007).

    [3] G P Agrawal. Applications of Nonlinear Fiber Optics(2001).

    [4] B E A Saleh, M C Teich. Fundamentals of Photonics(2007).

    [5] E Garmire. Nonlinear optics in daily life. Opt Exp, 21, 30532-30544(2013).

    [6] L W Chen, Y Zhou, M X Wu, M H Hong. Remote-mode microsphere nano-imaging: new boundaries for optical microscopes. Opto Electron Adv, 1, 170001(2018).

    [7] Z X Liu, M L Jiang, Y L Hu, F Lin, B Shen et al. Scanning cathodoluminescence microscopy: applications in semiconductor and metallic nanostructures. Opto-Electron Adv, 1, 180007(2018).

    [8] P A Franken, A E Hill, C W Peters, G Weinreich. Generation of optical harmonics. Phys Rev Lett, 7, 118-119(1961).

    [9] T H Maiman. Optical and microwave-optical experiments in ruby. Phys Rev Lett, 4, 564-566(1960).

    [10] D N Nikogosyan. Nonlinear Optical Crystals: A Complete Survey(2005).

    [11] L E Myers, W R Bosenberg. Periodically poled lithium niobate and quasi-phase-matched optical parametric oscillators. IEEE J Quantum Electron, 33, 1663-1672(1997).

    [12] Q Chen, W P Risk. Periodic poling of KTiOPO4 using an applied electric field. Electron Lett, 30, 1516-1517(1994).

    [13] H Karlsson, F Laurell, P Henriksson, G Arvidsson. Frequency doubling in periodically poled RbTiOAsO4. Electron Lett, 32, 556-557(1996).

    [14] K Mizuuchi, K Yamamoto. Generation of 340-nm light by frequency doubling of a laser diode in bulk periodically poled LiTaO3. Opt Lett, 21, 107-109(1996).

    [15] J P Meyn, M M Fejer. Tunable ultraviolet radiation by second-harmonic generation in periodically poled lithium tantalate. Opt Lett, 22, 1214-1216(1997).

    [16] S D Setzler, P G Schunemann, T M Pollak, L A Pomeranz, M J Missey. Advanced Solid-State Lasers, OSA Trends in Optics and Photonics Series. Washington DC: Optical Society of America, 676(1999).

    [17] J P Meyn, M E Klein, D Woll, R Wallenstein, D Rytz. Periodically poled potassium niobate for second-harmonic generation at 463 nm. Opt Lett, 24, 1154-1156(1999).

    [18] J C Johnson, H Q Yan, R D Schaller, P B Petersen, P D Yang et al. Near-field imaging of nonlinear optical mixing in single zinc oxide nanowires. Nano Lett, 2, 279-283(2002).

    [19] Y Nakayama, P J Pauzauskie, A Radenovic, R M Onorato, R J Saykally et al. Tunable nanowire nonlinear optical probe. Nature, 447, 1098-1101(2007).

    [20] J P Long, B S Simpkins, D J Rowenhorst, P E Pehrsson. Far-field imaging of optical second-harmonic generation in single GaN nanowires. Nano Lett, 7, 831-836(2007).

    [21] R Sanatinia, M Swillo, S Anand. Surface second-harmonic generation from vertical GaP nanopillars. Nano Lett, 12, 820-826(2012).

    [22] A Casadei, E F Pecora, J Trevino, C Forestiere, D Rüffer et al. Photonic-plasmonic coupling of GaAs single nanowires to optical nanoantennas. Nano Lett, 14, 2271-2278(2014).

    [23] G Bautista, J Mäkitalo, Y Chen, V Dhaka, M Grasso et al. Second-harmonic generation imaging of semiconductor nanowires with focused vector beams. Nano Lett, 15, 1564-1569(2015).

    [24] X B Yin, Z L Ye, D A Chenet, Y Ye, K OoBrien et al. Edge nonlinear optics on a MoS2 atomic monolayer. Science, 344, 488-490(2014).

    [25] X Zhou, J X Cheng, Y B Zhou, H Cao, H Hong et al. Strong second-harmonic generation in atomic layered GaSe. J Am Chem Soc, 137, 7994-7997(2015).

    [26] A Handelman, S Lavrov, A Kudryavtsev, A Khatchatouriants, Y Rosenberg et al. Nonlinear optical bioinspired peptide nanostructures. Adv Opt Mater, 1, 875-884(2013).

    [27] S Semin, A Van Etteger, L Cattaneo, N Amdursky, L Kulyuk et al. Strong thermo-induced single and two-photon green luminescence in self-organized peptide microtubes. Small, 11, 1156-1160(2015).

    [28] D Farrar, K L Ren, D Cheng, S Kim, W Moon et al. Permanent polarity and piezoelectricity of electrospun α-Helical Poly(α-Amino Acid) Fibers. Adv Mat, 23, 3954-3958(2011).

    [29] H H Zhang, Q Liao, X D Wang, Z Z Xu, H B Fu. Self-assembled organic hexagonal micro-prisms with high second harmonic generation efficiency for photonic devices. Nanoscale, 7, 10186-10192(2015).

    [30] H M Gibbs, G Khitrova, N Peyghambarian. Nonlinear Photonics(1990).

    [31] R Philip, M Ravikanth, Kumar G Ravindra. Studies of third order optical nonlinearity in iron (ó) phthalocyanine nj-oxo dimers using picosecond four-wave mixing. Opt Comm, 165, 91-97(1999).

    [32] G de la Torre, P Vázquez, , T Torres. Role of structural factors in the nonlinear optical properties of phthalocyanines and related compounds. Chem Rev, 104, 3723-3750(2004).

    [33] M O Senge, M Fazekas, E G A Notaras, W J Blau, M Zawadzka et al. Nonlinear optical properties of porphyrins. Adv Mat, 19, 2737-2774(2007).

    [34] Xu J, Boyd R W, Fischer G L. Nonlinear optical materials. Reference Module in Materials Science and Materials Engineering, Elsevier (2016).

    [35] K Wang, J Zhou, L Y Yuan, Y T Tao, J Chen et al. Anisotropic third-order optical nonlinearity of a single ZnO micro/nanowire. Nano Lett, 12, 833-838(2012).

    [36] L C Zhang, K Wang, Z Liu, G Yang, G Z Shen et al. Two-photon pumped lasing in a single CdS microwire. Appl Phys Lett, 102, 211915(2013).

    [37] C F Zhang, F Zhang, T Xia, N Kumar, J I Hahm et al. Low-threshold two-photon pumped ZnO nanowire lasers. Opt Express, 17, 7893-7900(2009).

    [38] E V Chelnokov, N Bityurin. Two-photon pumped random laser in nanocrystalline ZnO. Appl Phy Lett, 89, 171119(2006).

    [39] C Zhang, C L Zou, Y L Yan, R Hao, F W Sun et al. Two-photon pumped lasing in single-crystal organic nanowire exciton polariton resonators. J Am Chem Soc, 133, 7276-7279(2011).

    [40] J C Yu, Y J Cui, H Xu, Y Yang, Z Y Wang et al. Confinement of pyridinium hemicyanine dye within an anionic metal-organic framework for two-photon-pumped lasing. Nat Comm, 4, 2719(2013).

    [41] F Helmchen, W Denk. Deep tissue two-photon microscopy. Nat Methods, 2, 932-940(2005).

    [42] K Schenke-Layland, I Riemann, O Damour, U A Stock, K König. Two-photon microscopes and in vivo multiphoton tomographs-Powerful diagnostic tools for tissue engineering and drug delivery. Adv Drug Deliv Rev, 58, 878-896(2006).

    [43] D R Miller, J W Jarrett, A M Hassan, A K Dunn. Deep tissue imaging with multiphoton fluorescence microscopy. Curr Opin Biomed Eng, 4, 32-39(2017).

    [44] W Denk, J H Strickler, W W Webb. Two-photon laser scanning fluorescence microscopy. Science, 248, 73-76(1990).

    [45] D W Piston, M S Kirby, H Cheng, W J Lederer, W W Webb. Two-photon-excitation fluorescence imaging of three-dimensional calcium-ion activity. Appl Opt, 33, 662-669(1994).

    [46] G H Patterson, S M Knobel, P Arkhammar, O Thastrup, D W Piston. Separation of the glucose-stimulated cytoplasmic and mitochondrial NAD(P)H responses in pancreatic islet ǂ cells. Proc Natl Acad Sci USA, 97, 5203-5207(2000).

    [47] B D Bennett, T L Jetton, G T Ying, M A Magnuson, D W Piston. Quantitative subcellular imaging of glucose metabolism within intact pancreatic islets. J Biol Chem, 271, 3647-3651(1996).

    [48] S H Huang, A A Heikal, W W Webb. Two-photon fluorescence spectroscopy and microscopy of NAD(P)H and flavoprotein. Biophys J, 82, 2811-2825(2002).

    [49] Z Deyl, K Macek, M Adam, . Studies on the chemical nature of elastin fluorescence. Biochimi Biophys Acta, 625, 248-254(1980).

    [50] W R Zipfel, R M Williams, R Christie, A Y Nikitin, B T Hyman et al. Live tissue intrinsic emission microscopy using multiphoton-excited native fluorescence and second harmonic generation. Proc Natl Acad Sci USA, 100, 7075-7080(2003).

    [51] Q R Yu, A A Heikal. Two-photon autofluorescence dynamics imaging reveals sensitivity of intracellular NADH concentration and conformation to cell physiology at the single-cell level. J Photochem Photobiol B, 95, 46-57(2009).

    [52] K A Kasischke, E M Lambert, B Panepento, A Sun, H A Gelbard et al. Two-photon NADH imaging exposes boundaries of oxygen diffusion in cortical vascular supply regions. J Cereb Blood Flow Metab, 31, 68-81(2010).

    [53] M Balu, A Mazhar, C K Hayakawa, R Mittal, T B Krasieva et al. In vivo multiphoton NADH fluorescence reveals depth-dependent keratinocyte metabolism in human skin. Biophys J, 104, 258-267(2013).

    [54] A A Mansour, J T Gonçalves, C W Bloyd, H Li, S Fernandes et al. An in vivo model of functional and vascularized human brain organoids. Nat Biotechnol, 36, 432-441(2018).

    [55] J Mei, Y H Huang, H Tian. Progress and trends in AIE-based bioprobes: a brief overview. ACS Appl Mater Interfaces, 10, 12217-12261(2018).

    [56] M Collot, T K Fam, P Ashokkumar, O Faklaris, T Galli et al. Ultrabright and fluorogenic probes for multicolor imaging and tracking of lipid droplets in cells and tissues. J Am Chem Soc, 140, 5401-5411(2018).

    [57] X D Lou, Z J Zhao, B Z Tang. Organic dots based on AIEgens for two-photon fluorescence bioimaging. Small, 12, 6430-6450(2016).

    [58] D Ding, C C Goh, G X Feng, Z J Zhao, J Liu et al. Ultrabright organic dots with aggregation-induced emission characteristics for real-time two-photon intravital vasculature imaging. Adv Mat, 25, 6083-6088(2013).

    [59] R X Yi, P Das, F R Lin, B L Shen, Z G Yang et al. Fluorescence enhancement of small squaraine dye and its two-photon excited fluorescence in long-term near-infrared I & ò bioimaging. Opt Express, 27, 12360-12372(2019).

    [60] H F Wang, T B Huff, D A Zweifel, W He, P S Low et al. In vitro and in vivo two-photon luminescence imaging of single gold nanorods.. Proc Natl Acad Sci USA, 102, 15752-15756(2005).

    [61] T D Rane, A M Armani. Two-photon microscopy analysis of gold nanoparticle uptake in 3D cell spheroids. PLoS One, 11, e0167548(2016).

    [62] L Tong, C M Cobley, J Y Chen, Y N Xia, J X Cheng. Bright three-photon luminescence from gold/silver alloyed nanostructures for bioimaging with negligible photothermal toxicity. Angew Chem Int Ed, 49, 3485-3488(2010).

    [63] L Au, Q Zhang, C M Cobley, M Gidding, A G Schwartz et al. Quantifying the cellular uptake of antibody-conjugated Au nanocages by two-photon microscopy and inductively coupled plasma mass spectrometry. ACS Nano, 4, 35-42(2010).

    [64] Y I Park, K T Lee, Y D Suh, T Hyeon. Upconverting nanoparticles: a versatile platform for wide-field two-photon microscopy and multi-modal in vivo imaging. Chem Soc Rev, 44, 1302-1317(2015).

    [65] S T Yang, L Cao, P G Luo, F S Lu, X Wang et al. Carbon dots for optical imaging in vivo. J Am Chem Soc, 131, 11308-11309(2009).

    [66] D Li, P T Jing, L H Sun, Y An, X Y Shan et al. Near-infrared excitation/emission and multiphoton-induced fluorescence of carbon dots. Adv Mat, 30, 1705913(2018).

    [67] C F Wu, D T Chiu. Highly fluorescent semiconducting polymer dots for biology and medicine. Angew Chem Int Ed, 52, 3086-3109(2013).

    [68] Y T Gao, G X Feng, T Jiang, C Goh, L Ng et al. Biocompatible Nanoparticles based on diketo-pyrrolo-pyrrole (DPP) with aggregation-induced Red/NIR emission for in vivo two-photon fluorescence imaging. Adv Funct Mater, 25, 2857-2866(2015).

    [69] N G Horton, K Wang, D Kobat, C G Clark, F W Wise et al. In vivo three-photon microscopy of subcortical structures within an intact mouse brain. Nat Photon, 7, 205-209(2013).

    [70] D G Ouzounov, T Y Wang, M R Wang, D D Feng, N G Horton et al. In vivo three-photon imaging of activity of GCaMP6-labeled neurons deep in intact mouse brain. Nat Methods, 14, 388-390(2017).

    [71] T Y Wang, D G Ouzounov, C Y Wu, N G Horton, B Zhang et al. Three-photon imaging of mouse brain structure and function through the intact skull. Nat Methods, 15, 789-792(2018).

    [72] C J Rowlands, D Park, O T Bruns, K D Piatkevich, D Fukumura et al. Wide-field three-photon excitation in biological samples. Light Sci Appl, 6, e16255(2017).

    [73] K Guesmi, L Abdeladim, S Tozer, P Mahou, T Kumamoto et al. Dual-color deep-tissue three-photon microscopy with a multiband infrared laser. Light Sci Appl, 7, 12(2018).

    [74] P J Campagnola, L M Loew. Second-harmonic imaging microscopy for visualizing biomolecular arrays in cells, tissues and organisms. Nat Biotechnol, 21, 1356-1360(2003).

    [75] W Mohler, A C Millard, P J Campagnola. Second harmonic generation imaging of endogenous structural proteins. Methods, 29, 97-109(2003).

    [76] R Hellwarth, P Christensen. Nonlinear optical microscopic examination of structure in polycrystalline ZnSe. Opt Comm, 12, 318-322(1974).

    [77] C Sheppard, J Gannaway, R Kompfner, D Walsh. The scanning harmonic optical microscope. IEEE J Quantum Electron, 13, 912(1977).

    [78] I Freund, M Deutsch, A Sprecher. Connective tissue polarity. Optical second-harmonic microscopy, crossed-beam summation, and small-angle scattering in rat-tail tendon. Biophys J, 50, 693-712(1986).

    [79] H Lodish, A Berk, C A Kaiser, M Krieger, A Bretscher et al. Molecular Cell Biology(2013).

    [80] J M Bueno, F J Ávila, P Artal. Second harmonic generation microscopy: a tool for quantitative analysis of tissues, Microscopy and Analysis, 19-27(2016).

    [81] P Campagnola. Second harmonic generation imaging microscopy: applications to diseases diagnostic. Anal Chem, 83, 3224-3231(2011).

    [82] I Gusachenko, V Tran, Y G Houssen, J M Allain, M C Schanne-Klein. Polarization-resolved second-harmonic generation in tendon upon mechanical stretching. Biophys J, 102, 2220-2229(2012).

    [83] X Y Chen, O Nadiarynkh, S Plotnikov, P J Campagnola. Second harmonic generation microscopy for quantitative analysis of collagen fibrillar structure. Nat Protoc, 7, 654-669(2012).

    [84] W Lo, W L Chen, C M Hsueh, A A Ghazaryan, S J Chen et al. Fast Fourier transform-based analysis of second-harmonic generation Image in keratoconic cornea. Invest Ophthalmol Vis Sci, 53, 3501-3507(2012).

    [85] H Y Tan, Y L Chang, W Lo, C M Hsueh, W L Chen et al. Characterizing the morphologic changes in collagen crosslinked-treated corneas by Fourier transform-second harmonic generation imaging. J Cat Refract Surg, 39, 779-788(2013).

    [86] P P Provenzano, K W Eliceiri, J M Campbell, D R Inman, J G White et al. Collagen reorganization at the tumor-stromal interface facilitates local invasion. BMC Med, 4, 38(2006).

    [87] M W Conklin, J C Eickhoff, K M Riching, C A Pehlke, K W Eliceiri et al. Aligned collagen is a prognostic signature for survival in human breast carcinoma. Am J Pathol, 178, 1221-1232(2011).

    [88] E Sahai, J Wyckoff, U Philippar, J E Segall, F Gertler et al. Simultaneous imaging of GFP, CFP and collagen in tumors in vivo using multiphoton microscopy. BMC Biotechnol, 5, 14(2005).

    [89] N D Kirkpatrick, M A Brewer, U Utzinger. Endogenous optical biomarkers of ovarian cancer evaluated with multiphoton microscopy. Cancer Epidemiol Biomarkers Prev, 16, 2048-2057(2007).

    [90] O Nadiarnykh, R B LaComb, M A Brewer, P J Campagnola. Alterations of the extracellular matrix in ovarian cancer studied by second harmonic generation imaging microscopy. BMC Cancer, 10, 94(2010).

    [91] S J Lin, S H Jee, C J Kuo, R J Wu, W C Lin et al. Discrimination of basal cell carcinoma from normal dermal stroma by quantitative multiphoton imaging. Opt Lett, 31, 2756-2758(2006).

    [92] R Cicchi, D Massi, S Sestini, P Carli, V De Giorgi et al. Multidimensional non-linear laser imaging of Basal Cell Carcinoma. Opt Express, 15, 10135-10148(2007).

    [93] E Dimitrow, M Ziemer, M J Koehler, J Norgauer, K König et al. Sensitivity and specificity of multiphoton laser tomography for in vivo and ex vivo diagnosis of malignant melanoma. J Invest Dermatol, 129, 1752-1758(2009).

    [94] S Y Chen, S U Chen, H Y Wu, W J Lee, Y H Liao et al. In vivo virtual biopsy of human skin by using noninvasive higher harmonic generation microscopy. IEEE J Sel Top Quant Electron, 16, 478-492(2010).

    [95] W X Sun, S Chang, D C S Tai, N Tan, G F Xiao et al. Nonlinear optical microscopy: use of second harmonic generation and two-photon microscopy for automated quantitative liver fibrosis studies. J Biomed Opt, 13, 064010(2008).

    [96] M Strupler, A M Pena, M Hernest, P L Tharaux, J L Martin et al. Second harmonic imaging and scoring of collagen in fibrotic tissues. Opt Express, 15, 4054-4065(2007).

    [97] R Lacomb, O Nadiarnykh, P J Campagnola. Quantitative Second Harmonic Generation imaging of the diseased state osteogenesis imperfecta: experiment and simulation. Biophys J, 94, 4504-4514(2008).

    [98] K Schenke-Layland, J S Xie, E Angelis, B Starcher, K J Wu et al. Increased degradation of extracellular matrix structures of lacrimal glands implicated in the pathogenesis of Sjögren's syndrome. Matrix Biol, 27, 53-66(2008).

    [99] S J Lin, R E Wu, H Y Tan, W Lo, W C Lin et al. Evaluating cutaneous photoaging by use of multiphoton fluorescence and second-harmonic generation microscopy. Opt Lett, 30, 2275-2277(2005).

    [100] T T Le, I Langohr, M J Locker, M Sturek, J X Cheng. Label-free molecular imaging of atherosclerotic lesions using multimodal nonlinear optical microscopy. J Biomed Opt, 12, 054007(2007).

    [101] G P Kwon, J L Schroeder, M J Amar, A T Remaley, R S Balaban et al. Contribution of macromolecular structure to the retention of low-density lipoprotein at arterial branch points. Circulation, 117, 2919-2927(2008).

    [102] A V Kachynski, A Pliss, A N Kuzmin, T Y Ohulchanskyy, A Baev et al. Photodynamic therapy by in situ nonlinear photon conversion. Nat Photonics, 8, 455-461(2014).

    [103] L Bonacina, Y Mugnier, F Courvoisier, R Le Dantec, J Extermann et al. Polar Fe(IO3)3 nanocrystals as local probes for nonlinear microscopy. Appl Phys B, 87, 399-403(2007).

    [104] X L Le, C Y Zhou, A Slablab, D Chauvat, C Tard et al. Photostable second-harmonic generation from a single KTiOPO4 nanocrystal for nonlinear microscopy. Small, 4, 1332-1336(2008).

    [105] A V Kachynski, A N Kuzmin, M Nyk, I Roy, P N Prasad. Zinc oxide nanocrystals for nonresonant nonlinear optical microscopy in biology and medicine. J Phys Chem C, 112, 10721-10724(2008).

    [106] J Butet, G Bachelier, I Russier-Antoine, C Jonin, E Benichou et al. Interference between selected dipoles and octupoles in the optical second-harmonic generation from spherical gold nanoparticles. Phys Rev Lett, 105, 077401(2010).

    [107] J Butet, J Duboisset, G Bachelier, I Russier-Antoine, E Benichou et al. Optical second harmonic generation of single metallic nanoparticles embedded in a homogeneous medium. Nano Lett, 10, 1717-1721(2010).

    [108] M Zavelani-Rossi, M Celebrano, P Biagioni, D Polli, M Finazzi et al. Near-field second-harmonic generation in single gold nanoparticles. Appl Phys Lett, 92, 093119(2008).

    [109] C L Hsieh, R Grange, Y Pu, D Psaltis. Bioconjugation of barium titanate nanocrystals with immunoglobulin G antibody for second harmonic radiation imaging probes. Biomaterials, 31, 2272-2277(2010).

    [110] P Pantazis, J Maloney, D Wu, S E Fraser. Second harmonic generating (SHG) nanoprobes for in vivo imaging. Proc Natl Acad Sci USA, 107, 14535-14540(2010).

    [111] T R Kuo, C L Wu, C T Hsu, W Lo, S J Chiang et al. Chemical enhancer induced changes in the mechanisms of transdermal delivery of zinc oxide nanoparticles. Biomaterials, 30, 3002-3008(2009).

    [112] T Magouroux, J Extermann, P Hoffmann, Y Mugnier, R L Dantec et al. High-speed tracking of murine cardiac stem cells by harmonic nanodoublers. Small, 8, 2752-2756(2012).

    [113] W D A M de Boer, J J Hirtz, A Capretti, T Gregorkiewicz, et al. Neuronal photoactivation through second-harmonic near-infrared absorption by gold nanoparticles. Light Sci Appl, 7, 100(2018).

    [114] J X Cheng, X S Xie. Green's function formulation for third-harmonic generation microscopy. J Opt Soc Am B, 19, 1604-1610(2002).

    [115] L A Sordillo, Y Pu, S Pratavieira, Y Budansky, R R Alfano. Deep optical imaging of tissue using the second and third near-infrared spectral windows. J. Biomed Opt, 19, 056004(2014).

    [116] T Y F Tsang. Optical third-harmonic generation at interfaces. Phys Rev A, 52, 4116-4125(1995).

    [117] Y Barad, H Eisenberg, M Horowitz, Y Silberberg. Nonlinear scanning laser microscopy by third harmonic generation. Appl Phys Lett, 70, 922-924(1997).

    [118] D Yelin, Y Silberberg. Laser scanning third-harmonic-generation microscopy in biology. Opt Express, 5, 169-175(1999).

    [119] D Débarre, W Supatto, A M Pena, A Fabre, T Tordjmann et al. Imaging lipid bodies in cells and tissues using third-harmonic generation microscopy. Nat Methods, 3, 47-53(2006).

    [120] S Y Chen, C S Hsieh, S W Chu, C Y Lin, C Y Ko et al. Noninvasive harmonics optical microscopy for long-term observation of embryonic nervous system development in vivo. J Biomed Opt, 11, 054022(2006).

    [121] S R Pryke, L A Rollins, S C Griffith. Females use multiple mating and genetically loaded sperm competition to target compatible genes. Science, 329, 964-967(2010).

    [122] S W Chu, S Y Chen, T H Tsai, T M Liu, C Y Lin et al. In vivo developmental biology study using noninvasive multi-harmonic generation microscopy. Opt Express, 11, 3093-3099(2003).

    [123] M Yildirim, N Durr, A Ben-Yakar. Tripling the maximum imaging depth with third-harmonic generation microscopy. J. Biomed Opt, 20, 096013(2015).

    [124] A Karunendiran, R Cisek, D Tokarz, V Barzda, B A Stewart. Examination of Drosophila eye development with third harmonic generation microscopy. Biomed Opt Express, 8, 4504-4513(2017).

    [125] S P Tai, W J Lee, D B Shieh, P C Wu, H Y Huang et al. In vivo optical biopsy of hamster oral cavity with epi-third-harmonic-generation microscopy. Opt Express, 14, 6178-6187(2006).

    [126] M R Tsai, S Y Chen, D B Shieh, P J Lou, C K Sun. In vivo optical virtual biopsy of human oral mucosa with harmonic generation microscopy. Biomed Opt Express, 2, 2317-2328(2011).

    [127] W J Lee, C F Lee, S Y Chen, Y S Chen, C K Sun. Virtual biopsy of rat tympanic membrane using higher harmonic generation microscopy. J. Biomed Opt, 15, 046012(2010).

    [128] R Genthial, E Beaurepaire, M C Schanne-Klein, F Peyrin, D Farlay et al. Label-free imaging of bone multiscale porosity and interfaces using third-harmonic generation microscopy. Sci Rep, 7, 3419(2017).

    [129] D Tokarz, R Cisek, M N Wein, R Turcotte, C Haase et al. Intravital imaging of osteocytes in mouse calvaria using third harmonic generation microscopy. PLoS One, 12, e0186846(2017).

    [130] C K Tsai, T D Wang, J W Lin, R B Hsu, L Z Guo et al. Virtual optical biopsy of human adipocytes with third harmonic generation microscopy. Biomed Opt Express, 4, 178-186(2013).

    [131] B Weigelin, G J Bakker, P Friedl. Intravital third harmonic generation microscopy of collective melanoma cell invasion: Principles of interface guidance and microvesicle dynamics. IntraVital, 1, 32-43(2012).

    [132] G G Lee, H H Lin, M R Tsai, S Y Chou, W J Lee et al. Automatic cell segmentation and nuclear-to-cytoplasmic ratio analysis for third harmonic generated microscopy medical images. IEEE Trans Biomed Circuits Syst, 7, 158-168(2013).

    [133] J H Lee, S Y Chen, C H Yu, S W Chu, L F Wang et al. Noninvasive in vitro and in vivo assessment of epidermal hyperkeratosis and dermal fibrosis in atopic dermatitis. J Biomed Opt, 14, 014008(2009).

    [134] S P Tai, T H Tsai, W J Lee, D B Shieh, Y H Liao et al. Optical biopsy of fixed human skin with backward-collected optical harmonics signals. Opt Express, 13, 8231-8242(2005).

    [135] M R Tsai, Y H Cheng, J S Chen, Y S Sheen, Y H Liao et al. Differential diagnosis of nonmelanoma pigmented skin lesions based on harmonic generation microscopy. J Biomed Opt, 19, 036001(2014).

    [136] P C Wu, T Y Hsieh, Z U Tsai, T M Liu. In vivo quantification of the structural changes of collagens in a melanoma microenvironment with second and third harmonic generation microscopy. Sci Rep, 5, 8879(2015).

    [137] J Adur, V B Pelegati, A A De Thomaz, M O Baratti, D B Almeida et al. Optical biomarkers of serous and mucinous human ovarian tumor assessed with nonlinear optics microscopies. PLoS One, 7, e47007(2012).

    [138] N V Kuzmin, P Wesseling, P C de Witt Hamer, D P Noske, G D Galgano et al. Third harmonic generation imaging for fast, label-free pathology of human brain tumors. Biomed Opt Express, 7, 1889-1904(2016).

    [139] H Lim, D Sharoukhov, I Kassim, Y Q Zhang, J L Salzer et al. Label-free imaging of Schwann cell myelination by third harmonic generation microscopy. Proc Natl Acad Sci USA, 111, 18025-18030(2014).

    [140] S Witte, A Negrean, J C Lodder, C P J de Kock, G T Silva et al. Label-free live brain imaging and targeted patching with third-harmonic generation microscopy. Proc Natl Acad Sci USA, 108, 5970-5975(2011).

    [141] A A Lanin, A S Chebotarev, M S Pochechuev, I V Kelmanson, A B Fedotov et al. Three-photon-resonance-enhanced third-harmonic generation for label-free deep-brain imaging: In search of a chemical contrast. J Raman Spectrosc, 50, 1296-1302(2019).

    [142] A Kazarine, F Baakdah, A A Gopal, W Oyibo, E Georges et al. Malaria detection by third-harmonic generation image scanning cytometry. Anal Chem, 91, 2216-2223(2019).

    [143] L M G van Huizen, N V Kuzmin, E Barbé, S van der Velde, E A te Velde et al. Second and third harmonic generation microscopy visualizes key structural components in fresh unprocessed healthy human breast tissue. J Biophoton, 12, e201800297(2019).

    [144] D Yelin, D Oron, S Thiberge, E Moses, Y Silberberg. Multiphoton plasmon-resonance microscopy. Opt Express, 11, 1385-1391(2003).

    [145] M Lippitz, M A van Dijk, M Orrit. Third-harmonic generation from single gold nanoparticles. Nano Lett, 5, 799-802(2005).

    [146] O Schwartz, D Oron. Background-free third harmonic imaging of gold nanorods. Nano Lett, 9, 4093-4097(2009).

    [147] T M Liu, S P Tai, C H Yu, Y C Wen, S W Chu et al. Measuring plasmon-resonance enhanced third-harmonic χ(3) of Ag nanoparticles. Appl Phys Lett, 89, 043122(2006).

    [148] S P Tai, Y Wu, D B Shieh, L J Chen, K J Lin et al. Molecular imaging of cancer cells using plasmon-resonant-enhanced third-harmonic-generation in silver nanoparticles. Adv Mat, 19, 4520-4523(2007).

    [149] Y Jung, L Tong, A Tanaudommongkon, J X Cheng, C Yang et al. In vitro and in vivo nonlinear optical imaging of silicon nanowires. Nano Lett, 9, 2440-2444(2009).

    [150] C F Chang, H C Chen, M J Chen, W R Liu, W F Hsieh et al. Direct backward third-harmonic generation in nanostructures. Opt Express, 18, 7397-7406(2010).

    [151] N Chen, Y He, Y Y Su, X M Li, Q Huang et al. The cytotoxicity of cadmium-based quantum dots. Biomaterials, 33, 1238-1244(2012).

    [152] L Dubreil, I Leroux, M Ledevin, C Schleder, L Lagalice et al. Multi-harmonic imaging in the second near-infrared window of nanoparticle-labeled stem cells as a monitoring tool in tissue depth. ACS Nano, 11, 6672-6681(2017).

    [153] C W Lee, P C Wu, I L Hsu, T M Liu, W H Chong et al. New templated ostwald ripening process of mesostructured FeOOH for third-harmonic generation bioimaging. Small, 15, 1805086(2019).

    [154] R W Terhune, P D Maker, C M Savage. Measurements of nonlinear light scattering. Phys Rev Lett, 14, 681-684(1965).

    [155] R F Begley, A B Harvey, R L Byer. Coherent anti-stokes Raman spectroscopy. Appl Phys Lett, 25, 387-390(1974).

    [156] A Zumbusch, G R Holtom, X S Xie. Three-dimensional vibrational imaging by coherent anti-Stokes Raman scattering. Phys Rev Lett, 82, 4142-4145(1999).

    [157] J X Cheng, Y K Jia, G F Zheng, X S Xie. Laser-scanning coherent anti-Stokes Raman scattering microscopy and applications to cell biology. Biophys J, 83, 502-509(2002).

    [158] A Volkmer, J X Cheng, X S Xie. Vibrational imaging with high sensitivity via epidetected coherent anti-Stokes Raman scattering microscopy. Phys Rev Lett, 87, 023901(2001).

    [159] J X Cheng, A Volkmer, L D Book, X S Xie. Multiplex coherent anti-Stokes Raman scattering microspectroscopy and study of lipid vesicles. J Phys Chem B, 106, 8493-8498(2002).

    [160] M Müller, J M Schins. Imaging the thermodynamic state of lipid membranes with multiplex CARS microscopy. J Phys Chem B, 106, 3715-3723(2002).

    [161] X L Nan, W Y Yang, X S Xie. CARS microscopy lights up lipids in living cells. Biophoton Int, 11, 44-47(2004).

    [162] B Rakic, S M Sagan, M Noestheden, S Bélanger, X L Nan et al. Peroxisome proliferator-activated receptor ǁ antagonism inhibits hepatitis C virus replication. Chem Biol, 13, 23-30(2006).

    [163] X L Nan, A M Tonary, A Stolow, X S Xie, J P Pezacki et al. Intracellular imaging of HCV RNA and cellular lipids by using simultaneous two-photon fluorescence and coherent anti-Stokes Raman scattering microscopies. Chem Bio Chem, 7, 1895-1897(2006).

    [164] T Hellerer, C Axäng, C Brackmann, P Hillertz, M Pilon et al. Monitoring of lipid storage in Caenorhabditis elegans using coherent anti-Stokes Raman scattering (CARS) microscopy. Proc Natl Acad Sci USA, 104, 14658-14663(2007).

    [165] X S Xie, J Yu, W Y Yang. Living cells as test tubes. Science, 312, 228-230(2006).

    [166] K Yen, T T Le, A Bansal, S D Narasimhan, J X Cheng et al. A comparative study of fat storage quantitation in nematode Caenorhabditis elegans using label and label-free methods. PLoS One, 5, e12810(2010).

    [167] X L Nan, E O Potma, X S Xie. Nonperturbative chemical imaging of organelle transport in living cells with coherent anti-Stokes Raman scattering microscopy. Biophys J, 91, 728-735(2006).

    [168] R K Lyn, D C Kennedy, A Stolow, A Ridsdale, J P Pezacki et al. Dynamics of lipid droplets induced by the hepatitis C virus core protein. Biochem Biophys Res Commun, 399, 518-524(2010).

    [169] M Paar, C Jüngst, N A Steiner, C Magnes, F Sinner et al. Remodeling of lipid droplets during lipolysis and growth in adipocytes. J Biol Chem, 287, 11164-11173(2012).

    [170] C L Evans, E O Potma, M Puoris'haag, D Côté, C P Lin et al. Chemical imaging of tissue in vivo with video-rate coherent anti-Stokes Raman scattering microscopy. Proc Natl Acad Sci USA, 102, 16807-16812(2005).

    [171] H G Breunig, M Weinigel, R Bückle, M Kellner-Höfer, J Lademann et al. Clinical coherent anti-Stokes Raman scattering and multiphoton tomography of human skin with a femtosecond laser and photonic crystal fiber. Laser Phys Lett, 10, 025604(2013).

    [172] C L Evans, X S Xie. Coherent anti-Stokes Raman Scattering microscopy: chemical imaging for biology and medicine. Annu Rev Anal Chem, 1, 883-909(2008).

    [173] I Toytman, K Cohn, T Smith, D Simanovskii, D Palanker. Wide-field coherent anti-Stokes Raman scattering microscopy with non-phase-matching illumination. Opt Lett, 32, 1941-1943(2007).

    [174] C Brackmann, M Esguerra, D Olausson, D Delbro, A Krettek et al. Coherent anti-Stokes Raman scattering microscopy of human smooth muscle cells in bioengineered tissue scaffolds. J Biomed Opt, 16, 021115(2011).

    [175] H W Wang, T T Le, J X Cheng. Label-free imaging of arterial cells and extracellular matrix using a multimodal CARS microscope. Opt Comm, 281, 1813-1822(2008).

    [176] H F Wang, Y Fu, P Zickmund, R Shi, J X Cheng. Coherent anti-stokes Raman scattering imaging of axonal myelin in live spinal tissues. Biophys J, 89, 581-591(2005).

    [177] T B Huff, J X Cheng. In vivo coherent anti-Stokes Raman scattering imaging of sciatic nerve tissue. J Microsc, 225, 175-182(2007).

    [178] Y Fu, H F Wang, T B Huff, R Shi, J X Cheng. Coherent anti-Stokes Raman scattering imaging of myelin degradation reveals a calcium-dependent pathway in lyso-PtdCho-induced demyelination. J Neurosci Res, 85, 2870-2881(2007).

    [179] J Yookyung, J H Ng, C P Keating, P Senthil-Kumar, J Zhao et al. Comprehensive evaluation of peripheral nerve regeneration in the acute healing phase using tissue clearing and optical microscopy in a rodent model. PLoS One, 9, e94054(2014).

    [180] C L Evans, X Y Xu, S Kesari, X S Xie, S T C Wong et al. Chemically-selective imaging of brain structures with CARS microscopy. Opt Express, 15, 12076-12087(2007).

    [181] F Légaré, C L Evans, , X S Xie. Towards CARS endoscopy. Optics Express, 14, 4427-4432(2006).

    [182] Jr C H Camp, Y J Lee, J M Heddleston, C M Hartshorn, A R H Walker et al. High-speed coherent Raman fingerprint imaging of biological tissues. Nat Photon, 8, 627-634(2014).

    [183] T W Bocklitz, F S Salah, N Vogler, S Heuke, O Chernavskaia et al. Pseudo-HE images derived from CARS/TPEF/SHG multimodal imaging in combination with Raman-spectroscopy as a pathological screening tool. BMC Cancer, 16, 534(2016).

    [184] D Petersen, L Mavarani, D Niedieker, E Freier, A Tannapfel et al. Virtual staining of colon cancer tissue by label-free Raman micro-spectroscopy. Analyst, 142, 1207-1215(2017).

    [185] R Galli, O Uckermann, A Temme, E Leipnitz, M Meinhardt et al. Assessing the efficacy of coherent anti-Stokes Raman scattering microscopy for the detection of infiltrating glioblastoma in fresh brain samples. J Biophoton, 10, 404-414(2017).

    [186] A Karuna, F Masia, M Wiltshire, R Errington, W Langbein. Label-free volumetric quantitative imaging of the human somatic cell division by hyperspectral coherent anti-Stokes Raman scattering. Anal Chem, 91, 2813-2821(2019).

    [187] D Niedieker, F Grosserüschkamp, A Schreiner, K Barkovits, C Kötting et al. Label-free identification of myopathological features with coherent anti-Stokes Raman scattering. Muscle Nerve, 58, 456-459(2018).

    [188] K Hirose, S Fukushima, T Fukushima, H Niioka, M Hashimoto. Invited Article: Label-free nerve imaging with a coherent anti-Stokes Raman scattering rigid endoscope using two optical fibers for laser delivery. APL Photon, 3, 092407(2018).

    [189] E Kang, H F Wang, I K Kwon, J Robinson, J X Cheng. In situ visualization of paclitaxel distribution and release by coherent anti-Stokes Raman scattering microscopy. Anal Chem, 78, 8036-8043(2006).

    [190] C M Hartshorn, Y J Lee, Jr C H Camp, Z Liu, J Heddleston et al. Multicomponent chemical imaging of pharmaceutical solid dosage forms with broadband CARS microscopy. Anal Chem, 85, 8102-8111(2013).

    [191] A L Fussell, F Grasmeijer, H W Frijlink, A H de Boer, H L Offerhaus. CARS microscopy as a tool for studying the distribution of micronised drugs in adhesive mixtures for inhalation. J Raman Spectrosc, 45, 495-500(2014).

    [192] L Tong, Y H Lu, R J Lee, J X Cheng. Imaging receptor-mediated endocytosis with a polymeric nanoparticle-based coherent anti-Stokes Raman scattering probe. J Phys Chem B, 111, 9980-9985(2007).

    [193] P S Xu, E Gullotti, L Tong, C B Highley, D R Errabelli et al. Intracellular drug delivery by poly(lactic-co-glycolic acid) nanoparticles, revisited. Mol Pharm, 6, 190-201(2009).

    [194] N L Garrett, A Lalatsa, D Begley, L Mihoreanu, I F Uchegbu et al. Label-free imaging of polymeric nanomedicines using coherent anti-stokes Raman scattering microscopy. J Raman Spectrosc, 43, 681-688(2012).

    [195] N Darville, J Saarinen, A Isomäki, L Khriachtchev, D Cleeren et al. Multimodal non-linear optical imaging for the investigation of drug nano-/microcrystal-cell interactions. Eur J Pharm Biopharm, 96, 338-348(2015).

    [196] C W Freudiger, W Min, B G Saar, S J Lu, G R Holtom et al. Label-free biomedical imaging with high sensitivity by stimulated Raman scattering microscopy. Science, 322, 1857-1861(2008).

    [197] Y Ozeki, F Dake, S Kajiyama, K Fukui, K Itoh. Analysis and experimental assessment of the sensitivity of stimulated Raman scattering microscopy. Opt Express, 17, 3651-3658(2009).

    [198] P Nandakumar, A Kovalev, A Volkmer. Vibrational imaging based on stimulated Raman scattering microscopy. New J Phys, 11, 033026(2009).

    [199] D L Zhang, M N Slipchenko, J X Cheng. Highly sensitive vibrational imaging by femtosecond pulse stimulated Raman loss. J Phys Chem Lett, 2, 1248-1253(2011).

    [200] E R Andresen, P Berto, H Rigneault. Stimulated Raman scattering microscopy by spectral focusing and fiber-generated soliton as Stokes pulse. Opt Lett, 36, 2387-2389(2011).

    [201] H T Beier, G D Noojin, B A Rockwell. Stimulated Raman scattering using a single femtosecond oscillator with flexibility for imaging and spectral applications. Opt Express, 19, 18885-18892(2011).

    [202] M N Slipchenko, R A Oglesbee, D L Zhang, W Wu, J X Cheng. Heterodyne detected nonlinear optical imaging in a lock-in free manner. J Biophoton, 5, 801-807(2012).

    [203] J X Cheng, X S Xie. Vibrational spectroscopic imaging of living systems: An emerging platform for biology and medicine. Science, 350, aaa8870(2015).

    [204] E J Woodbury, W K Ng. Ruby laser operation in near IR. Proc Inst Radio Eng, 50, 2367(1962).

    [205] A Owyoung, E D Jones. Stimulated Raman spectroscopy using low-power cw lasers. Opt Lett, 1, 152-154(1977).

    [206] E Ploetz, S Laimgruber, S Berner, W Zinth, P Gilch. Femtosecond stimulated Raman microscopy. Appl Phys B, 87, 389-393(2007).

    [207] M C Wang, W Min, C W Freudiger, G Ruvkun, X S Xie. RNAi screening for fat regulatory genes with SRS microscopy. Nat Methods, 8, 135-138(2011).

    [208] W Dou, D L Zhang, Y Jung, J X Cheng, D M Umulis. Label-free imaging of lipid-droplet intracellular motion in early Drosophila embryos using femtosecond-stimulated Raman loss microscopy. Biophys J, 102, 1666-1675(2012).

    [209] P Wang, B Liu, D L Zhang, M Y Belew, H A Tissenbaum et al. Imaging lipid metabolism in live Caenorhabditis elegans using fingerprint vibrations. Angew Chem Int Ed, 53, 11787-11792(2014).

    [210] C R Hu, D L Zhang, M N Slipchenko, J X Cheng, B Hu. Label-free real-time imaging of myelination in the Xenopus laevis tadpole by in vivo stimulated Raman scattering microscopy. J Biomed Opt, 19, 086005(2014).

    [211] C W Freudiger, R Pfannl, D A Orringer, B G Saar, M B Ji et al. Multicolored stain-free histopathology with coherent Raman imaging. Lab Invest, 92, 1492-1502(2012).

    [212] F K Lu, M B Ji, D Fu, X H Ni, C W Freudiger et al. Multicolor stimulated Raman scattering (SRS) microscopy. Mol Phys, 110, 1927-1932(2012).

    [213] F K Lu, S Basu, V Igras, M P Hoang, M B Ji et al. Label-free DNA imaging in vivo with stimulated Raman scattering microscopy. Proc Natl Acad Sci USA, 112, 11624-11629(2015).

    [214] S H Yue, J J Li, S Y Lee, H J Lee, T Shao et al. Cholesteryl ester accumulation induced by PTEN loss and PI3K/AKT activation underlies human prostate cancer aggressiveness. Cell Metab, 19, 393-406(2014).

    [215] P Wang, J J Li, P Wang, C R Hu, D L Zhang et al. Label-free quantitative imaging of cholesterol in intact tissues by hyperspectral stimulated raman scattering microscopy. Angew Chem Int Ed, 52, 13042-13046(2013).

    [216] J J Li, S Condello, J Thomes-Pepin, X X Ma, Y Xia et al. Lipid desaturation is a metabolic marker and therapeutic target of ovarian cancer stem cells. Cell Stem Cell, 20, 303-314(2017).

    [217] R Mittal, M Balu, T Krasieva, E O Potma, L Elkeeb et al. Evaluation of stimulated Raman scattering microscopy for identifying squamous cell carcinoma in human skin. Lasers Surg Med, 45, 496-502(2013).

    [218] M B Ji, D A Orringer, C W Freudiger, S Ramkissoon, X H Liu et al. Rapid, label-free detection of brain tumors with stimulated Raman scattering microscopy. Sci Transl Med, 5, 201ra119(2013).

    [219] M Jermyn, K Mok, J Mercier, J Desroches, J Pichette et al. Intraoperative brain cancer detection with Raman spectroscopy in humans. Sci Transl Med, 7, 274ra19(2015).

    [220] M B Ji, M Arbel, L L Zhang, C W Freudiger, S S Hou et al. Label-free imaging of amyloid plaques in Alzheimer's disease with stimulated Raman scattering microscopy. Sci Adv, 4, eaat7715(2018).

    [221] S Yan, S S Cui, K Ke, B X Zhao, X L Liu et al. Hyperspectral stimulated Raman scattering microscopy unravels aberrant accumulation of saturated fat in human liver cancer. Anal Chem, 90, 6362-6366(2018).

    [222] L Wei, Y Yu, Y H Shen, M C Wang, W Min. Vibrational imaging of newly synthesized proteins in live cells by stimulated Raman scattering microscopy. Proc Natl Acad Sci USA, 110, 11226-11231(2013).

    [223] J J Li, J X Cheng. Direct visualization of de novo lipogenesis in single living cells. Sci Rep, 4, 6807(2014).

    [224] Y H Shen, F Xu, L Wei, F H Hu, W Min. Live-cell quantitative imaging of proteome degradation by stimulated Raman scattering. Angew Chem Int Ed, 53, 5596-5599(2014).

    [225] X S Li, Y Li, M J Jiang, W J Wu, S C He et al. Quantitative imaging of lipid synthesis and lipolysis dynamics in Caenorhabditis elegans by stimulated Raman scattering microscopy. Anal Chem, 91, 2279-2287(2019).

    [226] M N Slipchenko, H T Chen, D R Ely, Y Jung, M T Carvajal et al. Vibrational imaging of tablets by epi-detected stimulated Raman scattering microscopy. Analyst, 135, 2613-2619(2010).

    [227] D Fu, J Zhou, W J S Zhu, P W Manley, Y K Wang et al. Imaging the intracellular distribution of tyrosine kinase inhibitors in living cells with quantitative hyperspectral stimulated Raman scattering. Nat Chem, 6, 614-622(2014).

    [228] W S Chiu, N A Belsey, N L Garrett, J Moger, M B Delgado-Charro et al. Molecular diffusion in the human nail measured by stimulated Raman scattering microscopy. Proc Natl Acad Sci USA, 112, 7725-7730(2015).

    [229] L Wei, W Min. Pump-probe optical microscopy for imaging nonfluorescent chromophores. Anal Bioanal Chem, 403, 2197-2202(2012).

    [230] M C Fischer, J W Wilson, F E Robles, W S Warren. Invited Review Article: Pump-probe microscopy. Rev Sci Instrum, 87, 031101(2016).

    [231] P T Dong, J X Chen. Pump-probe microscopy: theory, instrumentation, and application. Spectroscopy, 32, 24-36(2017).

    [232] C Y Dong, P T So, T French, E Gratton. Fluorescence lifetime imaging by asynchronous pump-probe microscopy. Biophys J, 69, 2234-2242(1995).

    [233] D Fu, T Ye, T E Matthews, G Yurtsever, Sr W S Warren. Two-color, two-photon, and excited-state absorption microscopy. J Biomed Opt, 12, 054004(2007).

    [234] F Dan, T Ye, T Matthews, B J Chen, G Yurtserver et al. High-resolution in vivo imaging of blood vessels without labeling. Opt Lett, 32, 2641-2643(2007).

    [235] W Min, S J Lu, S S Chong, R Roy, G R Holtom et al. Imaging chromophores with undetectable fluorescence by stimulated emission microscopy. Nature, 461, 1105-1109(2009).

    [236] I R Piletic, T E Matthews, W S Warren. Probing near-infrared photorelaxation pathways in eumelanins and pheomelanins. J Phys Chem A, 114, 11483-11491(2010).

    [237] T E Matthews, J W Wilson, S Degan, M J Simpson, J Y Jin et al. In vivo and ex vivo epi-mode pump-probe imaging of melanin and microvasculature.. Biomed Opt Express, 2, 1576-1583(2011).

    [238] F E Robles, S Deb, J W Wilson, C S Gainey, M A Selim et al. Pump-probe imaging of pigmented cutaneous melanoma primary lesions gives insight into metastatic potential. Biomed Opt Express, 6, 3631-3645(2015).

    [239] A J Chen, X J Yuan, J J Li, P T Dong, I Hamza et al. Label-free imaging of heme dynamics in living organisms by transient absorption microscopy. Anal Chem, 90, 3395-3401(2018).

    [240] P T Dong, H N Lin, K C Huang, J X Cheng. Label-free quantitation of glycated hemoglobin in single red blood cells by transient absorption microscopy and phasor analysis. Sci Adv, 5, eaav0561(2019).

    [241] L Tong, Y X Liu, B D Dolash, Y Jung, M N Slipchenko et al. Label-free imaging of semiconducting and metallic carbon nanotubes in cells and mice using transient absorption microscopy. Nat Nanotechnol, 7, 56-61(2012).

    [242] T Chen, F Lu, A M Streets, P Fei, J M Quan et al. Optical imaging of non-fluorescent nanodiamonds in live cells using transient absorption microscopy. Nanoscale, 5, 4701-4705(2013).

    [243] T Chen, S H Chen, J H Zhou, D H Liang, X Y Chen et al. Transient absorption microscopy of gold nanorods as spectrally orthogonal labels in live cells. Nanoscale, 6, 10536-10539(2014).

    [244] J J Li, W X Zhang, T F Chung, M N Slipchenko et al. Highly sensitive transient absorption imaging of graphene and graphene oxide in living cells and circulating blood. Sci Rep, 5, 12394(2015).

    [245] C S Liao, M N Slipchenko, P Wang, J J Li, S Y Lee et al. Microsecond scale vibrational spectroscopic imaging by multiplex stimulated Raman scattering microscopy. Light Sci Appl, 4, e265(2015).

    Silu Zhang, Liwei Liu, Sheng Ren, Zilin Li, Yihua Zhao, Zhigang Yang, Rui Hu, Junle Qu. Recent advances in nonlinear optics for bio-imaging applications[J]. Opto-Electronic Advances, 2020, 3(10): 200003-1
    Download Citation